Replaying Elasticsearch Slowlogs with Logstash and JMeter

Sometimes we just need to replay production queries – whether it’s because we want a realistic load test for the new version of a product or because we want to reproduce, in a test environment, a bug that only occurs in production (isn’t it lovely when that happens? Everything is fine in tests but when you deploy, tons of exceptions in your logs, tons of alerts from the monitoring system…).

With Elasticsearch, you can enable slowlogs to make it log queries taking longer (per shard) than a certain threshold. You can change settings on demand. For example, the following request will record all queries for test-index:

curl -XPUT localhost:9200/test-index/_settings -d '{
  "index.search.slowlog.threshold.query.warn" : "1ms"
}'

You can run those queries from the slowlog in a test environment via a tool like JMeter. In this post, we’ll cover how to parse slowlogs with Logstash to write only the queries to a file, and how to configure JMeter to run queries from that file on an Elasticsearch cluster.

Continue reading “Replaying Elasticsearch Slowlogs with Logstash and JMeter”
Parsing and Centralizing Elasticsearch Logs with Logstash

No, it’s not an endless loop waiting to happen, the plan here is to use Logstash to parse Elasticsearch logs and send them to another Elasticsearch cluster or to a log analytics service like Logsene (which conveniently exposes the Elasticsearch API, so you can use it without having to run and manage your own Elasticsearch cluster).

If you’re looking for some ELK stack intro and you think you’re in the wrong place, try our 5-minute Logstash tutorial. Still, if you have non-trivial amounts of data, you might end up here again. Because you’ll probably need to centralize Elasticsearch logs for the same reasons you centralize other logs:

  • to avoid SSH-ing into each server to figure out why something went wrong
  • to better understand issues such as slow indexing or searching (via slowlogs, for instance)
  • to search quickly in big logs

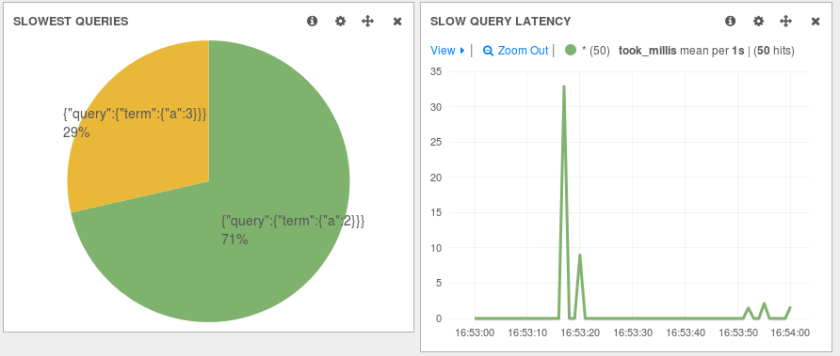
In this post, we’ll describe how to use Logstash’s file input to tail the main Elasticsearch log and the slowlogs. We’ll use grok and other filters to parse different parts of those logs into their own fields and we’ll send the resulting structured events to Logsene/Elasticsearch via the elasticsearch output. In the end, you’ll be able to do things like slowlog slicing and dicing with Kibana:

logstash_elasticsearch

TL;DR note: scroll down to the FAQ section for the whole config with comments.

Continue reading “Parsing and Centralizing Elasticsearch Logs with Logstash”