Integrate PagerDuty with SPM Performance Monitoring

Got Alarm Fatigue?

If so, you are not alone!  We talk to a lot of people who want to reduce the frequent “noise” from monitoring alarms.  To solve this common problem, Sematext added anomaly detection for alerts and PagerDuty integration to its SPM Performance Monitoring solution to dramatically reduce this noise compared with simple threshold-based alerting mechanisms.  The integration with PagerDuty helps DevOps with incident management, i.e., managing escalation and routing alerts to the right person by defined schedules and communication channels.

PagerDuty is an alarm aggregation and dispatching service for system administrators and support teams. It collects alerts from your monitoring tools, gives you an overall view of all of your monitoring alarms, and alerts an on-duty engineer if there’s a problem. PagerDuty allows you to build sophisticated alerting rules to determine who to contact when problems occur. You can build on-call schedules to equitably share on-call responsibilities. You can also set up multiple levels of coverage, so if the “primary” on-call person doesn’t respond to an alert in a timely fashion, it’s automatically escalated to a “secondary” person, and so on.” – Source: PagerDuty FAQ.

SPM Performance Monitoring is an enterprise-class, server and application performance monitoring, alerting, and anomaly detection solution. It is available both in the cloud (SaaS) and On Premises.  SPM also integrates with Logsene Log Management and Analytics to correlate metrics, alerts, anomalies, and events with application and server logs.

Get started

Basic setup steps are required to hook up both services:

  1. In PagerDuty: Get an API Key
  2. In SPM: Enter the API Key in SPM alert settings

1) In PagerDuty:

Create a new service:

  1. In your account, under the Services tab, click “Add New Service”.
  2. Select an Escalation Policy (e.g. default)
  3. Start typing “Sematext” for the Integration Type, which will narrow your filtering.
    PagerDuty add service
  4. Click the Add Service button
  5. Once the service is created, you’ll be taken to the Service page. On this page, you’ll see the “Service API key,” which you will need when you configure Sematext products to send events to PagerDuty. Copy the “Service API Key“ to the clipboard. PagerDuty service key

2) In SPM

1) Navigate to SPM Application Settings of your SPM App by clicking the App Settings button in the top right when you’re in the SPM UI.

 SPM - App Settings

2) Navigate to Alerts / PagerDuty

SPM - Service API Key for PagerDuty

3) Enter the API key from PagerDuty in the field Service API key

4) Press the Save button

Done. Every alert from your SPM app will be forwarded to PagerDuty, where you can manage escalation policies and configure notifications to other services like HipChat, Slack, Zapier, Flowdock, and more.

If you’ve got some feedback on this post or ideas for similar posts please let us know!

Elasticsearch Monitoring: SPM vs. Marvel

While many SPM Performance Monitoring users quickly see the benefits of SPM and adopt it in their organizations for monitoring — not just for Elasticsearch, but for their complete application stack — some Elasticsearch users evaluate SPM and compare it to Marvel from Elasticsearch.  We’ve been asked about SPM vs. Marvel enough times that we decided to put together this focused comparison to show some of the key differences and help individuals and organizations pick the right tool for their needs.

Marvel is a relatively young product that provides a detailed visualization of Elasticsearch metrics in a Kibana-based UI. It installs as an Elasticsearch plug-in and includes ‘Sense’ (a developer console), plus a replay functionality for shard allocation history.

SPM, on the other hand, offers multiple agent deployment modes, has both Cloud and On Premises versions, includes alerts and anomaly detection, is not limited to Elasticsearch monitoring, integrates with third party services, etc. The following Venn diagram shows key areas that SPM and Marvel have in common and also the areas where they differ.

SPM-vs-Marvel

Looking into the details surfaces many notable differences.  For example:

  • The SPM agent can run independently from the Elasticsearch process and an upgrade of the agent does not require a restart of Elasticsearch
  • Dashboards are defined with different philosophies: Marvel exposes each Metric in a separate chart, while SPM groups related metrics together in a single chart or in adjacent charts (thus making it easy for people to have more information in a single place without needing to jump between multiple views)
  • Both have the ability to show metrics from multiple nodes in a single chart: Marvel draws a separate line for each node, while in SPM you can choose to aggregate values or display them separately.

The following “SPM vs. Marvel Comparison Table” is a starting point to evaluate monitoring products for organization’s individual needs.

SPM vs. Marvel Comparison Table

Feature SPM by Sematext Marvel by Elasticsearch
Supported Applications Elasticsearch, Hadoop, Spark, Kafka, Storm, Cassandra, HBase, Redis, Memcached, NGINX(+), Apache, MySQL, Solr, AWS CloudWatch, JVM, … Elasticsearch
Agent deployment mode in- and out-of-process
(out-of-process allows for seamless updates without requiring Elasticsearch restarts)
in-process
(as Elasticsearch plug-in; updates require Elasticsearch restarts)
Predefined dashboard graphs organized in groups YES YES
Saving Individual Dashboards Each user can store multiple dashboards, mixing charts from all applications, including both metrics and logs. Current view can be saved, reset to defaults possible. These changes are global.
API for Custom Metrics and Business KPIs YES NO
Extra Elasticsearch Metrics NO

  • Metrics are added based on user demand and users  can always graph them as Custom Metrics.
YES

  • Circuit Breakers
  • ID Cache
  • Lucene memory
  • ES Threadpools
  • Percolator
OS and JVM Metrics YES (+)

  • JVM pool sizes
  • JVM pool utilization
YES
Correlation of Metrics with Logs, Events, Alerts, and Anomalies YES

  • SPM and Logsene integration
  • Ability to ingest and chart arbitrary external Events
NO

  • Cluster Pulse displays only Elasticsearch Events
Deployment model SaaS or On Premises On Premises
Security/User Roles &
Permissions
YES NO
Easy & Secure Sharing of Reports with internal and external organizations YES

  • via short links
  • vie embeds / iframe
  • via email
NO
Machine Learning-based Anomaly Detection YES NO
Threshold based Alerts YES NO
Heartbeat Alerts YES NO
Forwarding Alerts to 3rd parties YES

  • E-Mail
  • PagerDuty
  • Nagios / Shinken
  • HipChat
  • Slack
  • Webhooks
NO
Metrics Aggregation YES

  • Pre-aggregation at multiple granularity levels, including 1 min granularity.  Advantage: more efficient storage, scales better, faster for graphing performance over longer time periods at the expense of sub-minute precision.
YES

  • Query-time aggregation. No write or query-time aggregation.
    Advantage: 10 second precision by default at the expense of storage size, write, and read performance and memory footprint.

As an aside, most of the features in this comparison table would also apply if we compared SPM to BigDesk, ElasticHQ, Statsd, Graphite, Ganglia, Nagios, Riemann, and other application-specific monitoring or alerting tools out there.

If you have any questions about this comparison or have any feedback, please let us know!

Integrating SPM Performance Monitoring with HipChat

Many agile DevOps teams rely on communication via HipChat,  which provides an API and mobile apps to receive messages while being away from one’s desktop. SPM Performance Monitoring‘s new integration via WebHooks provides the capability to forward alerts to many services, including HipChat.

The integration of both services can be achieved by collecting the room_id and an access token from HipChat and then building a WebHook in SPM.  The SPM Wiki explains how to get this information from HipChat and build the WebHook in SPM: Alerts – HipChat integration

Performance-Monitoring-Hip-Chat-Integration

This whole process only takes a minute or two.  HipChat is a tool that is becoming more popular among the DevOps crowd, and here at Sematext we pride ourselves on staying on top of what our users need and expect.

Need some extra help with this setup or another app you might want to integrate?  Have ideas for other integrations we should explore? Please drop us a line, we’re here to help and listen.

Performance Monitoring Comparison: Build vs. Buy

Using a performance monitoring system that you built yourself? You are not alone!  Many organizations monitor their applications and IT infrastructure with a bolted-together and often incompatible assortment of tools.  With larger organizations this can number to a dozen or more different tools.  Seriously.  Build vs. Buy, Do-It-Yourself (DIY), homegrown, in-house, Not Invented Here (NIH) — there are almost as many terms to describe this approach as there are products to do the monitoring.

There’s a good chance you’re using tools like Statsd, Graphite, Nagios and others to stay on top of things.  But that’s a LOT of work.  And why spend all the time doing all that work yourself?  Life, as we all know, is too short.  Is glueing together N tools or building yet another custom monitoring tool really a good use of (y)our (life)time?  This also leads to the next obvious question:

Why Not Use One Monitoring Solution to Do It All?

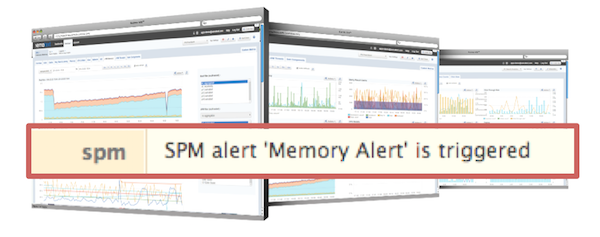
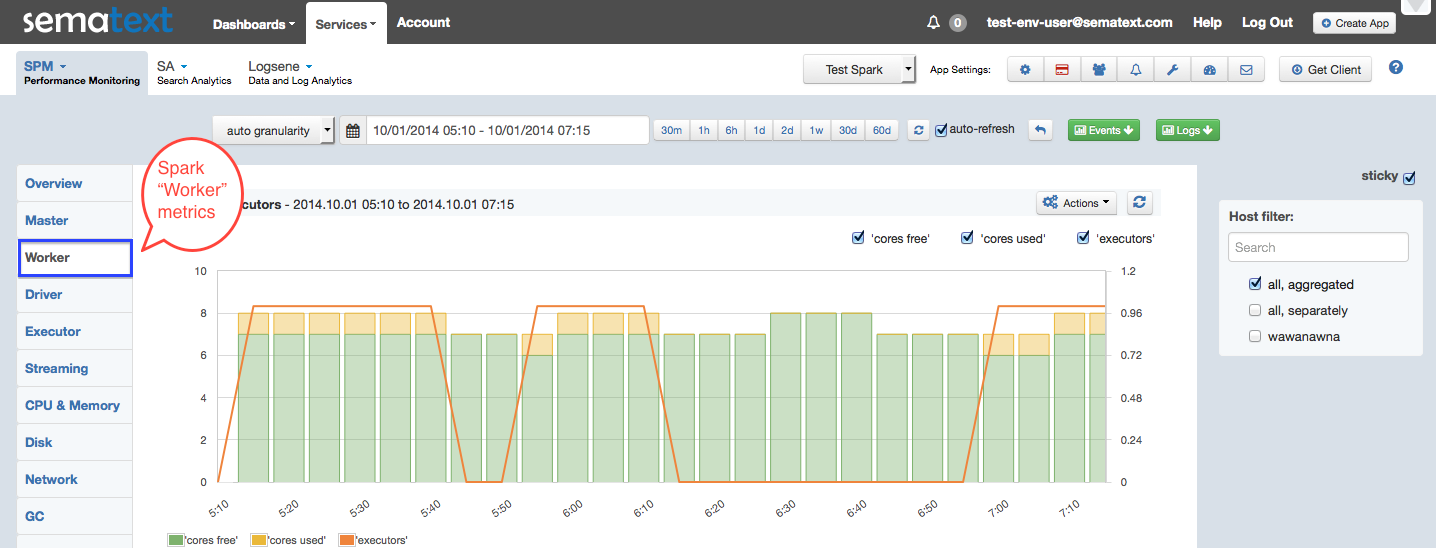
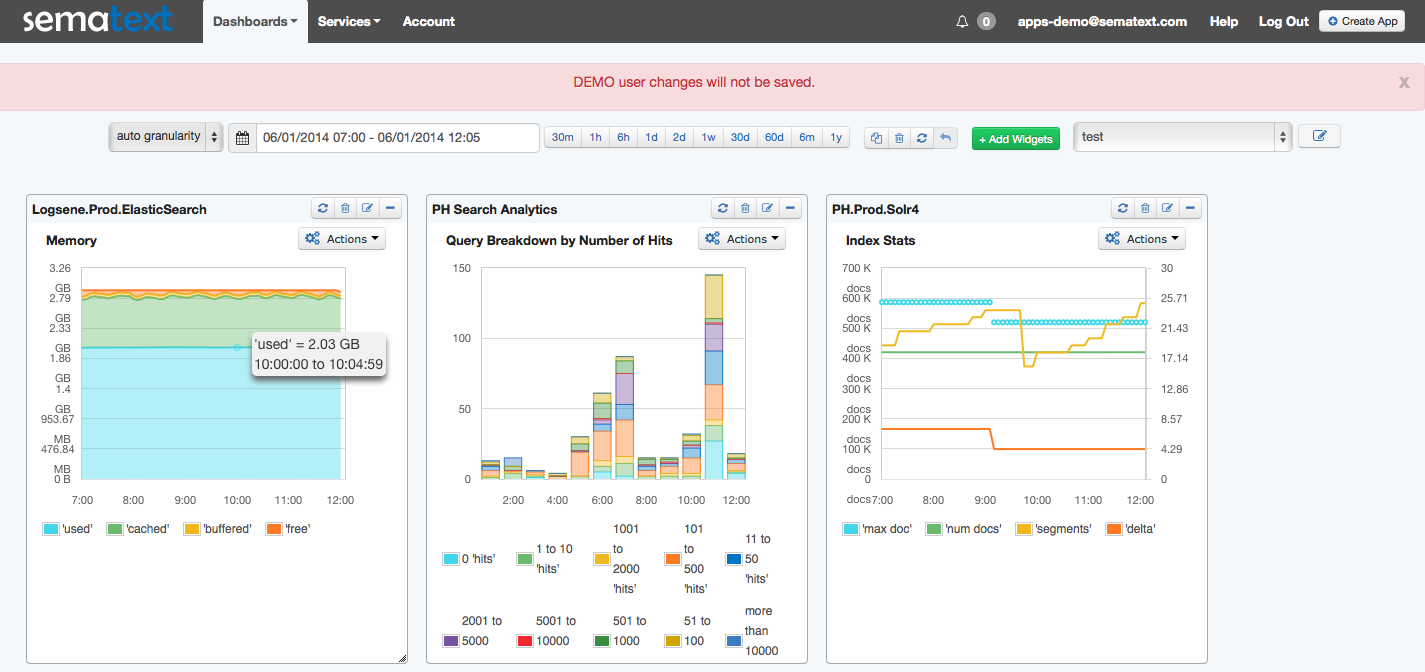
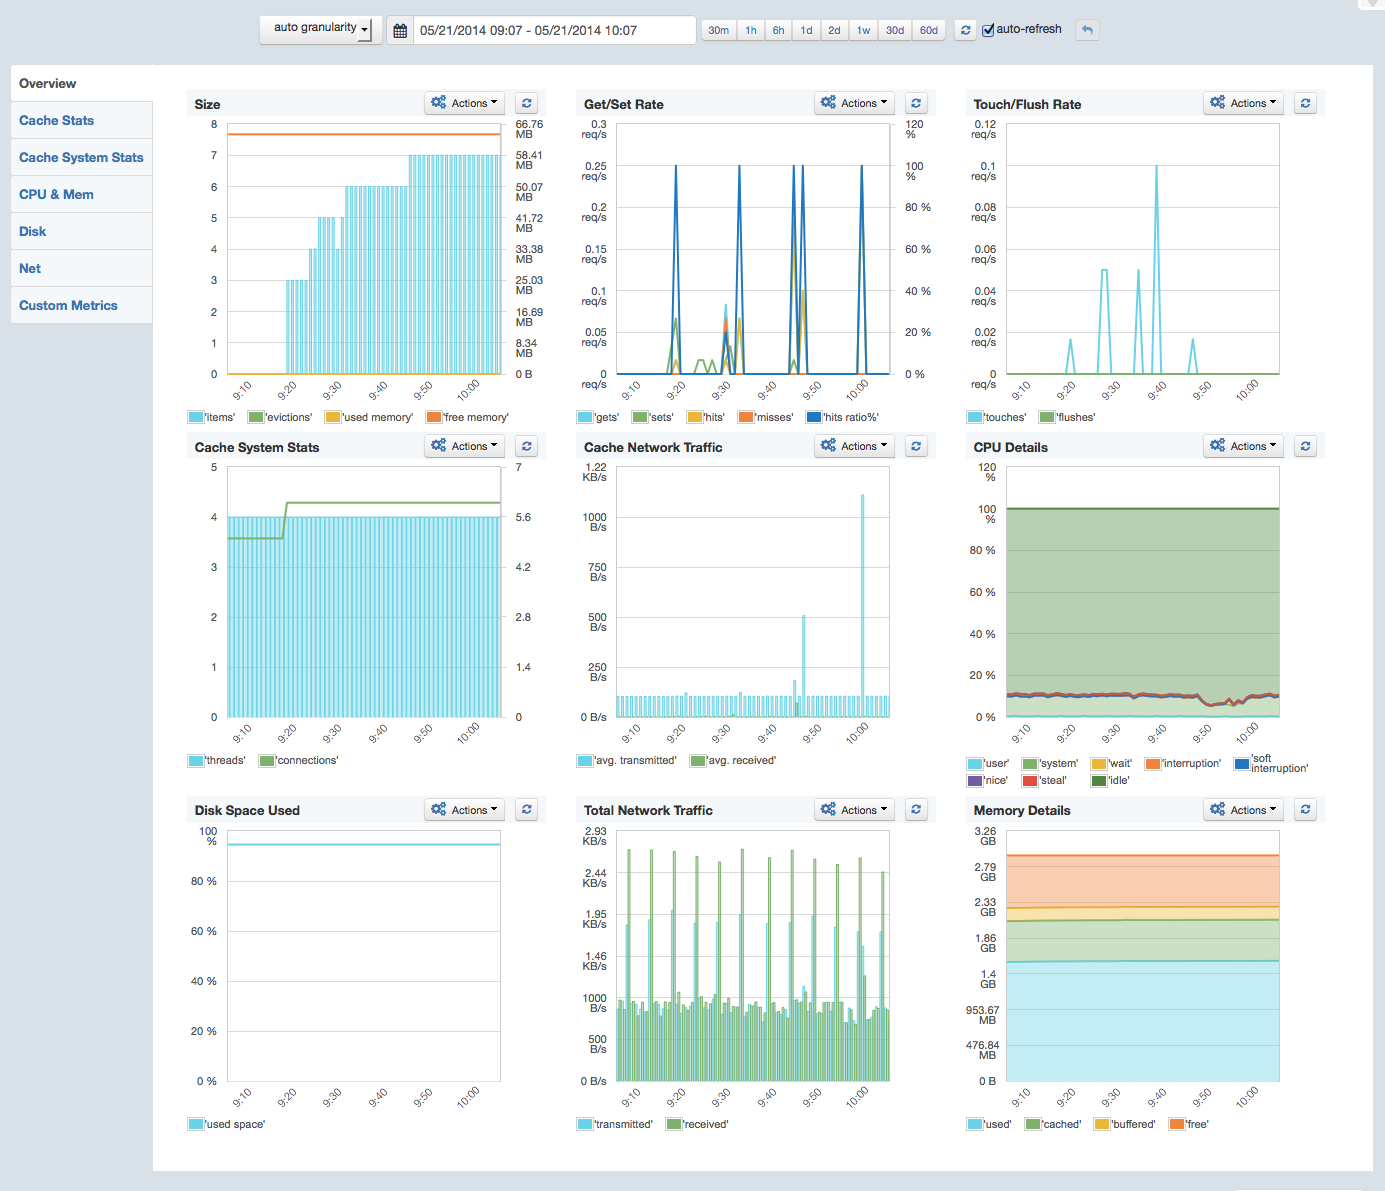
SPM Performance Monitoring, Alerting and Anomaly Detection is a comprehensive solution that does the work of many individual monitoring tools in one powerful package.  Applications, servers, other key IT devices — even logs! — are all covered.  A partial list of monitored apps includes Elasticsearch, Solr, Hadoop, HBase, Spark, Cassandra, Kafka, Storm, Redis, NGINX Plus and NGINX.  You can even see what I’m talking about right now by checking out our SPM live demo.

In fact, as one SPM user recently told us:

“I don’t want to be a data ape and consume your data to build other reports.  I think that is one of the attractions with SPM — I can push the data to Graphite or another monitoring tool, but you already have the reports done. So my time to insight is much faster.”

There Are Some Huge Differences Between Building and Buying

If your Building approach is draining engineer time that could be better spent elsewhere, then you should consider some of the key differences between building your own monitoring “system” and using SPM, including:

  • Log & Event Correlation: SPM can aggregate, graph and correlate logs with performance metrics and alerts (via integration with Logsene Log Management and Analytics).  If you are managing your logs then you are using a separate solution that does not integrate with your “Build” monitoring system.  Being able to see logs along with performance metrics is essential for effective troubleshooting.
  • On Premises or in Cloud: SPM offers an On Premises version in addition to SaaS.  Most app-specific monitoring tools are SaaS-only, but some organizations like their metrics and logs close to home base.
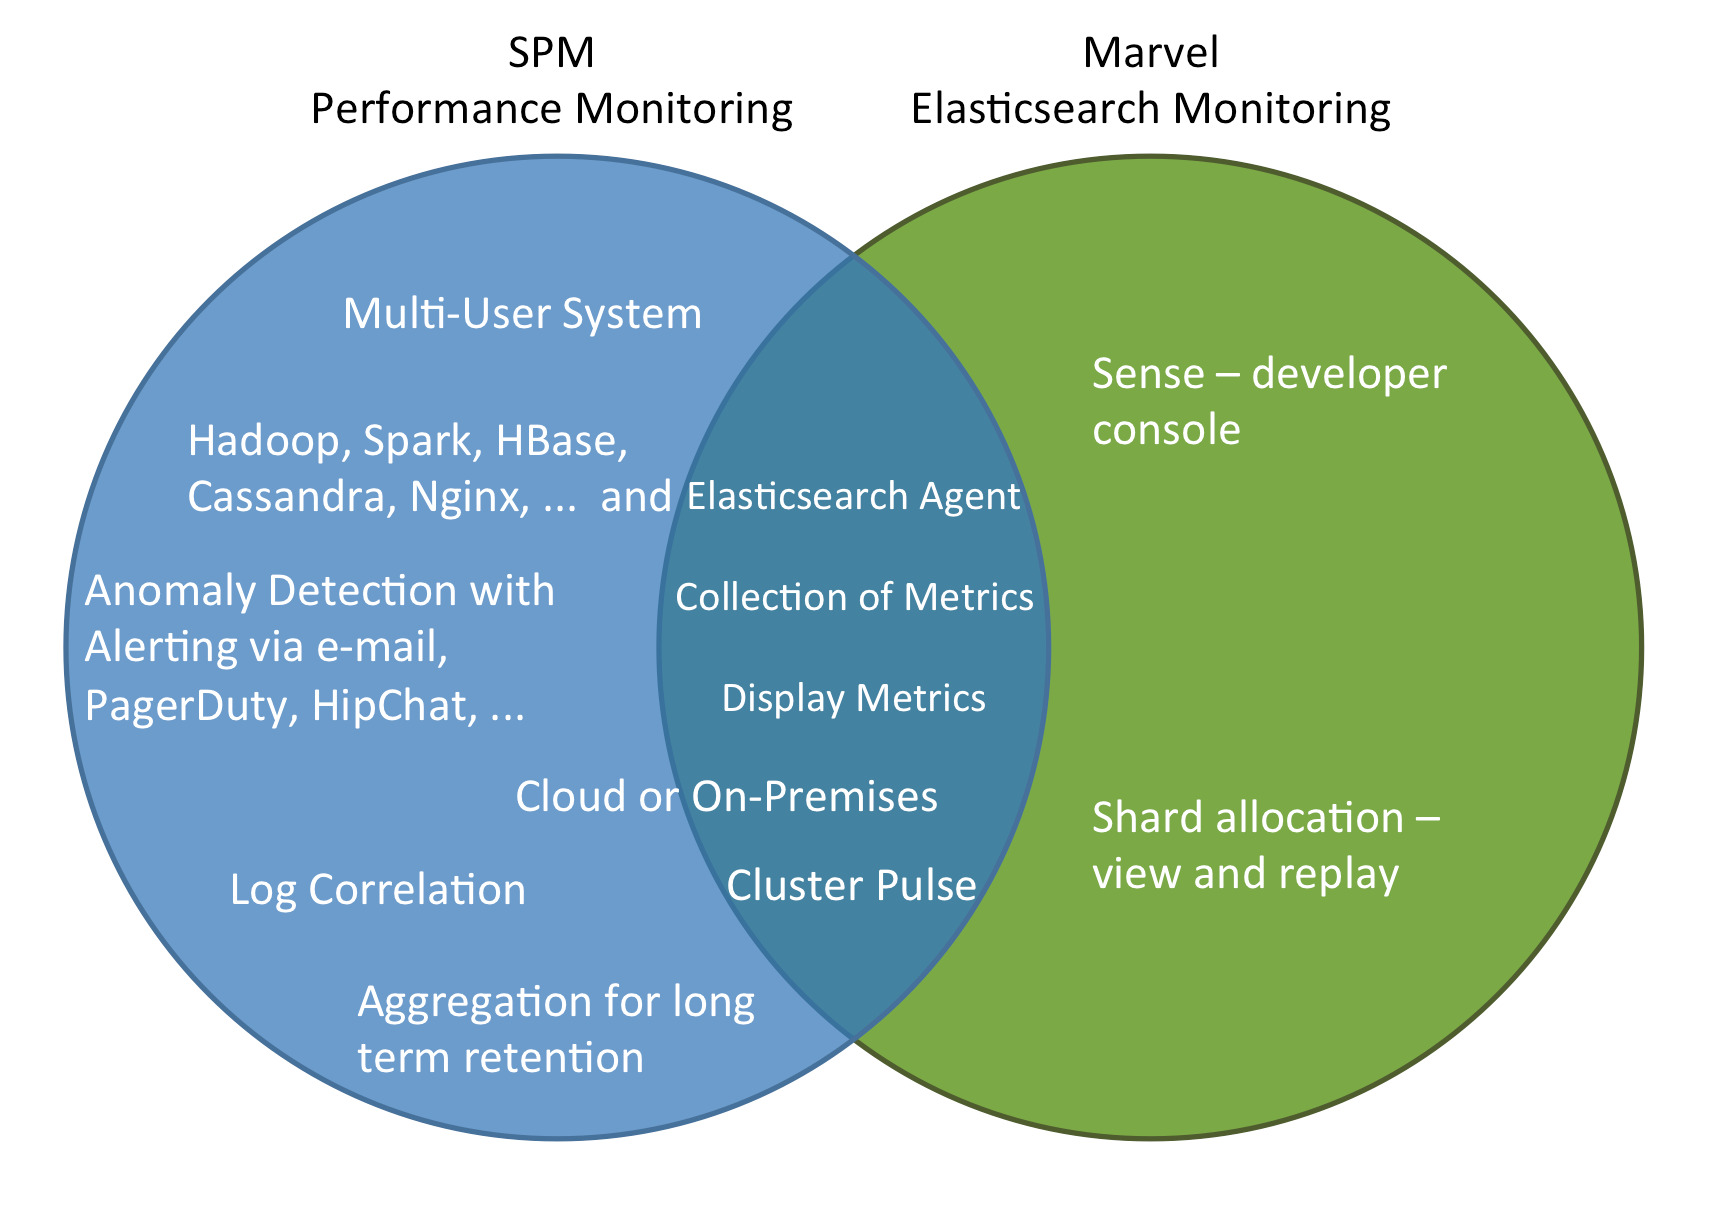
  • Native App Monitoring vs. 3rd Party Plugins: SPM monitors all apps natively.  If you are monitoring a number of individual apps via a range of 3rd party plugins then you have to deal with multiple installation and data collection mechanisms, various levels of maturity, and widely varying qualities of implementation and of reporting.
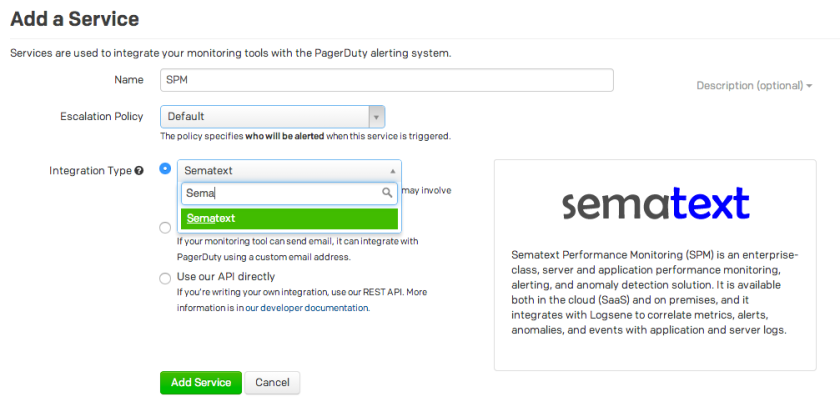
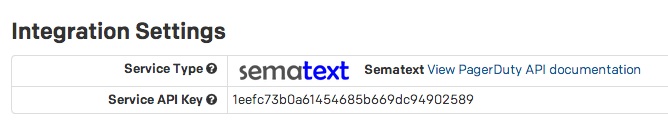
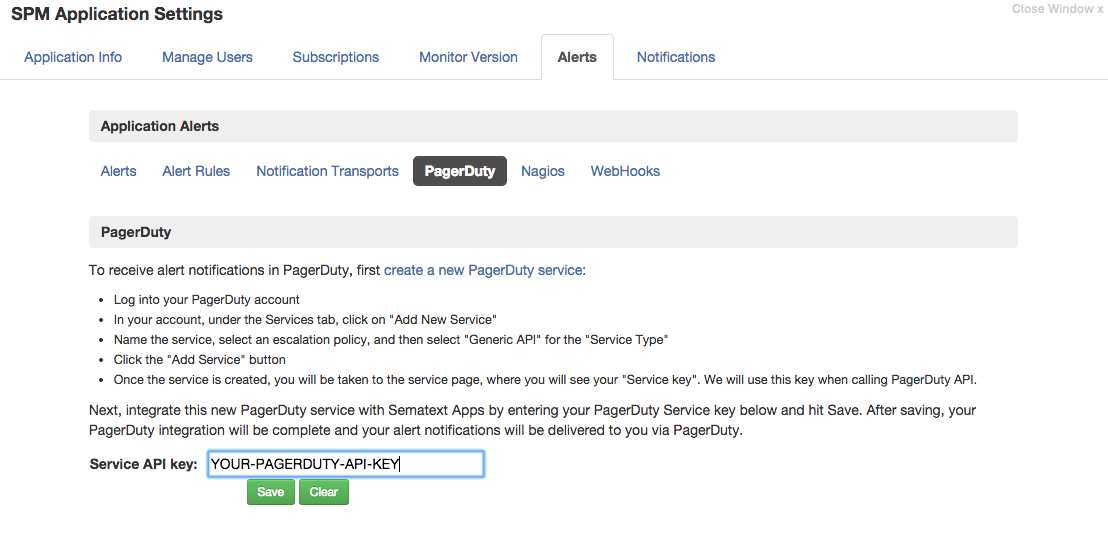
  • Anomaly Detection: SPM has support not only for heartbeat alerts and threshold-based alerts, but also for automatic machine learning based anomaly detection.  A Build system most likely does not have comprehensive anomaly detection capabilities.

And Then There is the Cost of Using All Those Different Monitoring Tools…

Cost comparisons between Building your own monitoring system and Buying a solution like SPM are not linear.  While some monitoring tools are open-source and free (though the time to configure them can be costly in its own right), commercial tools run a wide gamut of costs, infrastructure limits, data limits, time limits, pricing schemes, etc.  Just keeping track of the costs is often a job in itself.  In general, the more tools you have, the more value SPM delivers.

Here’s one scenario that will give you an idea of potential Build costs:

Build Your Own Monitoring System — Cost Scenario

  • Hourly rate:        $100 (ballpark figure; could be much higher)
  • Installation:        2 hours (very optimistic)
  • Configuration:   8 hours (very optimistic)
  • Maintenance:    2 hours/month (optimistic)
  • Upgrading:        2 days (i.e., ~20 hours)/year (IF all goes well!)
  • # of servers to run this configuration:  3 (monitoring 10 total servers*)
  • Cost per server (hardware): $1,000 each (i.e., $3,000 total)

___________________________________________________________

  • Total Cost in Year 1:        $6,200
  • Total Cost in Year 2:        $3,200 (not including any additional server purchases)
  • Total Cost in Year 3:        $3,200 (at least, though most likely higher)

And we didn’t even count the time cost to actually learn how to use all these tools!

Moreover, we used very optimistic numbers, assumed nothing will go wrong, assumed no issues like backwards incompatibilities, problems around dependencies, etc. etc. – all issues that are actually very common and can consume days and make the above costs much higher.  We do a ton of DevOps work at Sematext and, like everyone in this field, know how common this is.

* this number can vary widely, but for example purposes, if you want a complete monitoring solution that can do everything SPM can do — monitoring, alerting, anomaly detection, graph emailing, embedding, etc. — then the total servers that can be monitored with 3 monitoring servers will be lower than it would with a bare bones, incomplete monitoring tool.

SPM — Cost Scenario

  • # of servers: 10 servers (for example purposes)
  • Standard plan (our lowest cost plan beyond Free): $25/server/month
  • Time to Register and Install N agents: 1 hour (or $100 at hourly rate)

________________________________________________________________

  • Total Cost in Year 1:        $3,100
  • Total Cost in Year 2:        $3,000
  • Total Cost in Year 3:        $3,000

And these costs don’t even include any Volume Discounts that we would offer!

You can find clear, simple pricing plans for SPM right here.

Conclusion

While it’s great that there are many tools available for monitoring — some of them free — and communities built around those tools, in the DevOps world it still comes back to time.  Time to learn these tools.  Time to stay up-to-date on them.  Time to deploy.  Time to configure.  Time to maintain.  Time to assemble a bunch of disparate tools so you can monitor more than just one app.  You get the picture.  And time, as we all know, carries a cost.  With DevOps this is typically a significant cost.  So before undertaking a long and neverending “Build” journey, it makes sense to look at all the costs — in money and time — of buying a complete monitoring solution like SPM vs. building your own system. The closer you look, the more value a tool like SPM offers you and your organization.

Try SPM for Free for 30 Days

Tired of building, and building, and building…  Try SPM Performance Monitoring for Free for 30 days by registering here.  There’s no commitment and no credit card required.

Apache Spark Monitoring in SPM

Apache Spark is an open-source, large-scale data processing engine built on top of the Hadoop Distributed File System (HDFS) and enables applications in Hadoop clusters to run up to 100x faster in memory, and 10x faster even when running on disk.  So it’s not surprising the usage of Spark is booming as this Google Trends graph shows.

And while Spark usage has been going through the roof, Engineers and DevOps handling Spark have not had a good monitoring tool at their disposal.  Well, that is, until now.  By releasing the first Spark monitoring product to market Sematext has, with the addition of Spark monitoring to SPM Performance Monitoring, Alerting and Anomaly Detection, just filled a big hole in the Spark ecosystem.

Having just been added — along with other goodies — to the latest SPM release, SPM for Spark monitors all Spark metrics.  It includes alerting, anomaly detection, log correlation, custom dashboards, events graphing, custom metrics, and a ton more.  SPM can be installed On Premises or one can use the Cloud version run by Sematext, in which case the setup takes less than 5 minutes before graphs with performance metrics start appearing in real-time.

Enough with the words – Show me what Spark Monitoring looks like!

Have a look at a few screenshots to see how we graph Spark metrics in SPM.  While we don’t use Spark at Sematext at this time and thus don’t have a live demo to show you, you can check out SPM’s live demo and see some other types of apps we monitor, such as Hadoop, HBase, Cassandra, Kafka, Storm, ZooKeeper, Elasticsearch, Solr, NGINX and NGINX Plus, Apache, MySQL, Redis, Java webapps and generic Java applications, as well as custom metrics.

Screenshot – Spark Executor metrics [click to enlarge]

Spark_screenshot_Executor_3

Screenshot – Spark Worker metrics  [click to enlarge]

Spark_screenshot_Worker_2

And One More Thing…

SPM now works hand-in-hand with Logsene Log Management and Analytics.  This makes the integration of performance metrics, logs, events and anomalies more robust for those of you looking to combine performance monitoring and centralized log management in one place — not only knowing that SOMETHING affected performance of your Spark cluster when you look at your performance metrics graphs or get an alert, but also exactly WHAT happened with the cluster by having immediate access to all relevant Spark event logs right there!

Take a Test Drive — It’s Easy and Free to Get Started

Like what you see here?  Sound like something that could benefit your organization?  Then try SPM and/or Logsene for Free for 30 days by registering here.  There’s no commitment and no credit card required.

Correlating Metrics and Logs — Use Case: Elasticsearch Indexing

Here’s one way users can benefit from the SPM Performance Monitoring, Alerting and Anomaly Detection and Logsene Log Management and Analytics integration we just announced in the latest release. Problem – CPU Utilization hits 95%!

  • You get an alarm about a CPU usage jump to 95% (note: using classic threshold-based alerts for CPU usage is a little crazy.  SPM’s anomaly detection feature would be a much better thing to use for CPU usage metrics).
  • You wonder, naturally, why this is happening and investigate immediately.
  • Without access to log graphs — like you would have with an SPM and Logsene combination — you would not be able to tell right away that the indexing rate increased.  It could be anything.  So you would need to connect, via ssh or VPN, to a server (or servers) where the CPU jumped and start looking around and see which process has been using the most CPU.  You’d run tools like top, vmstat, etc., but of course they’d have no historical data.
  • Even knowing which process uses the most CPU is not detailed enough.  You need to start looking at logs — either in another vendor’s log management tool which does not work seamlessly with your monitoring tool or manually “grepping” through one or more potentially very large log files on one or more servers — and try to determine what this application is doing more of now than it did before.  Not surprisingly, this is error-prone, time-consuming, and needlessly manual.  Most people have better things to do and want better tools.

Solution: Use SPM and Logsene Together to Triage With a dashboard like the one you see here you can quickly tell what happened — i.e., why CPU usage went up.   In this particular case it is because the Elasticsearch indexing rate increased.  Now that the problem has been identified you can move on to taking action to fix it if a fix is needed.  Note:  You can even access the actual logs via Logsene so you can really be sure that there is no increase in some errors that are related to higher CPU usage. test_dashboard_SPM_Logsene We hope you found this use case helpful.  Got other performance monitoring, centralized log management or search-related use case ideas you’d like to see?  Drop us a line!

JOB: Devops Evangelist – Monitoring, Logging, Analytics

DEVELOPER / DEVOPS EVANGELIST

Sematext is looking for someone with a business and marketing bent and enough technical background to be able to put together bits of code and demos of SPM, Logsene, and other products we are working on.  A good fit for this role is a person who likes to teach and share, knows how to connect with people and their needs, is passionate and is considered (or wants to become) a thought leader in at least one area — Monitoring, Logging, Data Analytics and/or Business Intelligence.  Our ideal evangelist also enjoys the agility and challenge of a startup.  For a good description of the type of person we are looking for watch this video.  Sematext is a young, fast growing, highly distributed and agile team and our developer evangelist will work in many different capacities and contribute to the company’s success in a variety of ways.

RESPONSIBILITIES:

  • Create technical content and demos for publication on our blog and other channels to show developers, devops, and others how to implement specific solutions or use new technologies
  • Prepare and deliver presentations and webinars, speak at industry conferences, local meetups and other events
  • Build relationships with tech bloggers, open source contributors and product community leaders, journalists and analysts
  • Educate and empower developers, giving technical workshops and brown bags
  • Build partnerships with individuals, companies and organizations that serve the same communities we do (Elasticsearch, Solr, Kafka, Hadoop, Storm, Spark, etc.)
  • Gather and socialize product feedback that informs engineering, sales, and marketing decision making

REQUIREMENTS:

  • BS or higher in Computer Science or professional experience as a developer, sys admin, sales engineer or other technical role
  • Strong verbal and written communications skills with ability to write for engineers or high-level management
  • Entrepreneurial thinking and the ability to act effectively with only high-level direction

BONUS:

  • Participation in open-source community
  • Experience with other commercial and open source monitoring, logging, or analytics technologies
  • Experience working in a startup

You can check out our products, our services, our clients, and our team to get a better sense of what Sematext is all about.  Also worth a look are the 19 things you may like about Sematext.  Interested? Please send your resume to jobs@sematext.com.  For other job openings please see Jobs @ Sematext or even our previous job listings.

Logsene Log Management and Analytics Grows Up!

There are exciting changes on the immediate horizon for Sematext’s comprehensive logging solution: Logsene Log Management and Analytics.  We just announced the seamless integration of Logsene with SPM Performance Monitoring, Alerting and Anomaly Detection (more on that below) and we have a new release of Logsene just weeks away from production.  Here’s a glimpse of the new Logsene UI.  Watch for more log analytics and management goodies on our blog soon.

New Logsene UI sneak peek

logsene1366x768_blog_post

Of course, the new Logsene will keep the option to use the Kibana UI directly from Logsene.

New Logsene Functionality in Words

  1. We support multiple queries in a single view; each query’s data get added to the graph (hence 2 lines in this screenshot).
  2. Queries can be saved, converted to scheduled queries (get email with log graphs every day/week/month type of functionality), or to alert queries (i.e., “email me when we see log messages with XYZ in them”). Those little gray icons next to search fields are for that.
  3. Clicking on the icon to the left of the top search field will show more functionality.
  4. Filtering by various log attributes.
  5. Raw log events in what we internally call Logs Table (or LT). Multiple tabs on top correspond to multiple queries one can enter.
  6. On the left is a list of available fields that are shown in LT. Checking them adds them to LT. They can be dragged and reordered. Reordering them controls the order of columns in LT.
  7. Number behind field names shows the number of distinct values for that field.
  8. Logs can be downloaded as CSV or published to Github Gist or Pastebin services.
  9. Arrows in top-right of LT expand the LT into a “Kiosk mode.”
  10. Little icon in each row in LT can be clicked. It expands on click and lets you see context around the given log.
  11. Clicking on the two gray buttons in top right with down arrows will expose metrics from SPM and Events.

If you currently use Splunk or another log management tool then there is a good chance that you will find Logsene to be an easy and useful way to index, search and analyze your logs.

But Why Use Logsene?

In short: Logsene and SPM provide a single pane of glass for performance monitoring, centralized log management, alerts, anomalies, custom events, and custom KPIs.  Unlike competing products, SPM and Logsene together not only tell users that SOMETHING happened, it now tells them exactly WHAT happened.  No need for a mish-mash of individual open-source or commercial tools for monitoring, for alerting, for logging, for custom dashboards, etc., each with its own configuration, its own UI, etc.

Not only that, but Logsene offers a unique pricing plan that, unlike those of other log management products, does NOT charge for the amount of data and retention.  You only pay for the number of logs in the index – you don’t pay for data transfer or data retention.

We also offer Plan Auto-Upgrade, a unique feature that can automatically switch you to the next higher plan if you exceed your log threshold — preventing you from losing logs which could contain critical information, without forcing you to keep this higher plan.

Moreover, because Logsene usage is “by day”, when auto-upgrade happens the extra cost is really minimal — at any time after the auto-upgrade you can adjust retention and/or plan and go back to the old plan

Check out a Live Demo

See SPM and Logsene (note: old UI and Kibana UI, the new UI will be in the next release) for yourself by viewing a live demo.  You’ll also be able to poke around and see Storm, Kafka, Solr, Elasticsearch, Hadoop, HBase, MySQL, and other types of apps being monitored.

Try Logsene and/or SPM Performance Monitoring for Free for 30 days by registering here.  There’s no commitment and no credit card required.

We’re Hiring!

If you enjoy performance monitoring, log analytics, or search analytics, working with projects like Elasticsearch, Solr, HBase, Hadoop, Kafka, and Storm, then drop us a line.  We’re hiring planet-wide!  Front end and JavaScript Developers, Developer Evangelists, Full-stack Engineers, Mobile App Developers…get in touch!

Monitoring Kafka, Storm and Cassandra Together with SPM

Kafka, Storm and Cassandra — Big Data’s Three Amigos?  Not quite.  And while much less humorous than the movie, this often-used-together trio of tools work closely together to make in-stream processing as smooth, immediate and efficient as possible.  Needless to say, it makes a lot of sense to monitor them together.  And since you’re reading the Sematext blog you shouldn’t be surprised to hear that we offer an all-in-one solution that can be used for Kafka, Storm and Cassandra performance monitoring, alerts and anomaly detectionSPM Performance Monitoring.  Moreover, if you ship logs from any of these three systems to Logsene, you can correlate not only metrics from these three systems, but also their logs and really any other type of event!

Enough with all the words — here is an illustration of how these three tools typically work together:

Kafka-Storm-Cassandra

Of course, you could also be storing data into some other type of data store, like Elasticsearch or HBase or MySQL or Solr or Redis.  SPM monitors all of them, too.

So what do you get if you monitor Kafka, Storm, and Cassandra with SPM?

You get a single pane pane of glass, a single access point through which you can see visualizations of well over 100 metrics you can slice and dice by a number applications-specific dimensions.  For example, various Kafka performance metrics can be filtered by one or more topics, while some Storm performance metrics can be filtered by topology or worker.  Of course, you can set alerts on any of the metrics and you can even make use of SPM’s anomaly detection capabilities.

Kafka, Storm + Cassandra screenshot

Consolidate Your App Monitoring, Alerting, and Centralize Logging — It’s Easy!

Many organizations tackle performance monitoring with a mish-mash of different monitoring and alerting tools cobbled together in an uneasy coexistence that is often far from seamless.  SPM takes all that hassle away and makes it easy and comprehensive in one step.

Live Demo — See SPM for Yourself

Check out SPM’s live demo to see this monitoring for yourself.  You won’t find any demo apps showing Cassandra metrics because we don’t use it at Sematext yet, but you’ll be able to poke around and see Kafka, HBase, Elasticsearch, MySQL, and other types of apps being monitored.

Love the Idea of Monitoring Kafka, Storm & Cassandra Together?
Take a Test Drive — It’s Easy to Get Started.

Try SPM Performance Monitoring for Free for 30 days by registering here.  There’s no commitment and no credit card required.

We’re Hiring!

If you enjoy performance monitoring, log analytics, or search analytics, working with projects like Elasticsearch, Solr, HBase, Hadoop, Kafka, and Storm, then drop us a line.  We’re hiring planet-wide!  Front end and JavaScript Developers, Developer Evangelists, Full-stack Engineers, Mobile App Developers…get in touch!

Announcement: What’s New in SPM Performance Monitoring

A new SPM Performance Monitoring release was just pushed to production and it’s chock full of great new stuff to complement its proactive performance monitoring, alerting, anomaly detection, etc., available in the Cloud or On Premise.  Here is a run-down of the juicier additions. The slightly longer version can be found in the SPM Changelog.

Integration with Logsene Log Management and Analytics

SPM performance monitoring now gives users access to even more metrics by seamlessly integrating with event data and logs via Logsene Log Management and Analytics.  This enables correlation across performance metrics, alerts, anomaliesevents, logs, and provides a single pane of glass across any organization’s IT infrastructure.

Monitoring Support for More Applications

We’ve added native monitoring support for the following applications to complement monitoring for Solr, Elasticsearch, Hadoop, HBase, Storm, Redis, Kafka, ZooKeeper and many others.

Screenshots

Eager to see pictures instead of reading content?  Then jump below to see screenshots of these apps being monitored.

UI/UX Improvements

UI/UX improvements include: zooming and panning, client-side caching, wider and simpler metric charts, new filter slide-out panels with search capabilities, quick access to all dashboards and easier dashboard creation, and more.

Event Graphs

Events and event graphs are now integrated into SPM Performance Monitoring.  You can now correlate various types of events, such as alerts, anomalies, application deployments, restarts, releases, server reboots, etc., with performance metrics graphs, as well as with logs and log graphs.  Many of you will also be happy to hear that SPM can now turn Alerts into Events, and graph them as well.  Check out Event Integration if you want to publish your own Events.

More Powerful Storm Monitoring

SPM Storm monitoring now serves up more metrics, more graphs and provides more granular details.  This includes the addition of metric filters and the ability to monitor not just Spouts and Bolts, but also monitor Storm Workers.

Dashboard Enhancements

Creating and working with dashboards just got a lot more intuitive and flexible.  This includes:

  • creating new dashboards via an intuitive “build your own dashboard” tool
  • easier navigation via Miller Columns (think column-oriented view in OSX Finder)
  • adding whatever graphs you want to an existing or brand new dashboard from within that dashboard
  • a pull down menu to select specific dashboards for much quicker access to a specific dashboard

Screenshot – SPM Dashboard (one of many possible views; click to enlarge)

Dashboard_test

Screenshot – Cassandra Overview  (click to enlarge)

cassandra_overview

Screenshot – MySQL Overview  (click to enlarge)

MySQL Overview

Screenshot – Memcached Overview  (click to enlarge)

memcached-overview

Screenshot – Apache Monitoring Overview  (click to enlarge)

Apache Overview

Screenshot – AWS CloudWatch EBS Read/Write Bandwidth  (click to enlarge)

AWS_EBS Read:Write Bandwidth

Live Demo

Check out SPM’s live demo to see it for yourself.  You won’t find any demo apps showing Cassandra or Memcached metrics because we don’t use them at Sematext yet, but you’ll be able to poke around and see other types of apps being monitored — like Solr, Kafka, Hadoop and HBase, for example — along with MySQL, AWS, and Apache.

Consolidate Your App Monitoring — It’s Easy!

Many organizations tackle performance monitoring with a mish-mash of different monitoring and alerting tools cobbled together in an uneasy coexistence that is often far from seamless. SPM takes all that hassle away and makes it easy and comprehensive in one step.

Try SPM for Free for 30 Days

Try SPM Performance Monitoring for Free for 30 days by registering here.  There’s no commitment and no credit card required.

We’re Hiring!

If you enjoy performance monitoring, log analytics, or search analytics, working with projects like Elasticsearch, Solr, HBase, Hadoop, Kafka, and Storm, then drop us a line.  We’re hiring planet-wide!  Front end and JavaScript Developers, Developer Evangelists, Full-stack Engineers, Mobile App Developers…get in touch!