Monitoring CoreOS Clusters

UPDATE: Related to monitoring CoreOS clusters, we have recently optimized the SPM setup on CoreOS and integrated a logging gateway to Logsene into the SPM Agent for Docker.  You can read about it in Centralized Log Management and Monitoring for CoreOS Clusters

——-

[ Note: Click here for the Docker Monitoring webinar video recording and slides. And click here for the Docker Logging webinar video recording and slides. ]

In this post you’ll learn how to get operational insights (i.e. performance metrics, container events, etc.) from CoreOS and make that super simple with etcd, fleet, and SPM.

We’ll use:

  • SPM for Docker to run the monitoring agent as a Docker container and collect all Docker metrics and events for all other containers on the same host + metrics for hosts
  • fleet to seamlessly distribute this container to all hosts in the CoreOS cluster by simply providing it with a fleet unit file shown below
  • etcd to set a property to hold the SPM App token for the whole cluster

The Big Picture

Before we get started, let’s take a step back and look at our end goal.  What do we want?  We want charts with Performance Metrics, we want Event Collection, we’d love integrated Anomaly Detection and Alerting, and we want that not only for containers, but also for hosts running containers.  CoreOS has no package manager and deploys services in containers, so we want to run the SPM agent in a Docker container, as shown in the following figure:

SPM_for_Docker

By the end of this post each of your Docker hosts could look like the above figure, with one or more of your own containers running your own apps, and a single SPM Docker Agent container that monitors all your containers and the underlying hosts.

Continue reading “Monitoring CoreOS Clusters”

Get CoreOS Logs into ELK in 5 Minutes

Update: We have recently optimized the SPM setup on CoreOS and integrated a logging gateway to Logsene into the SPM Agent for Docker.  Please follow the setup instructions in Centralized Log Management and Monitoring for CoreOS Clusters


[ Note: Click here for the Docker Monitoring webinar video recording and slides. And click here for the Docker Logging webinar video recording and slides. ]

CoreOS Linux is the operating system for “Super Massive Deployments”.  We wanted to see how easily we can get CoreOS logs into Elasticsearch / ELK-powered centralized logging service. Here’s how to get your CoreOS logs into ELK in about 5 minutes, give or take.  If you’re familiar with CoreOS and Logsene, you can grab CoreOS/Logsene config files from Github. Here’s an example Kibana Dashboard you can get in the end:

CoreOS Kibana Dashboard

CoreOS is based on the following:

  • Docker and rkt for containers
  • systemd for startup scripts, and restarting services automatically
  • etcd as centralized configuration key/value store
  • fleetd to distribute services over all machines in the cluster. Yum.
  • journald to manage logs. Another yum.

Amazingly, with CoreOS managing a cluster feels a lot like managing a single machine!  We’ve come a long way since ENIAC!

There’s one thing people notice when working with CoreOS – the repetitive inspection of local or remote logs using “journalctl -M machine-N -f | grep something“.  It’s great to have easy access to logs from all machines in the cluster, but … grep? Really? Could this be done better?  Of course, it’s 2015!

Here is a quick example that shows how to centralize logging with CoreOS with just a few commands. The idea is to forward the output of “journalctl -o short” to Logsene‘s Syslog Receiver and take advantage of all its functionality – log searching, alerting, anomaly detection, integrated Kibana, even correlation of logs with Docker performance metrics — hey, why not, it’s all available right there, so we may as well make use of it all!  Let’s get started!

Preparation:

1) Get a list of IP addresses of your CoreOS machines

fleetctl list-machines

2) Create a new Logsene App (here)
3) Change the Logsene App Settings, and authorize the CoreOS host IP Addresses from step 1) (here’s how/where)

Congratulations – you just made it possible for your CoreOS machines to ship their logs to your new Logsene app!
Test it by running the following on any of your CoreOS machines:

journalctl -o short -f | ncat --ssl logsene-receiver-syslog.sematext.com 10514

…and check if the logs arrive in Logsene (here).  If they don’t, yell at us @sematext – there’s nothing better than public shaming on Twitter to get us to fix things. 🙂

Create a fleet unit file called logsene.service

[Unit]
Description=Logsene Log Forwarder

[Service]
Restart=always
RestartSec=10s
ExecStartPre=/bin/sh -c "if [ -n \"$(etcdctl get /sematext.com/logsene/`hostname`/lastlog)\" ]; then  echo \"Value Exists: /sematext.com/logsene/`hostname`/lastlog $(etcdctl get /sematext.com/logsene/`hostname`/lastlog)\"; else etcdctl set /sematext.com/logsene/`hostname`/lastlog\"`date +\"%Y-%%m-%d %%H:%M:%S\"`\"; true; fi"
ExecStart=/bin/sh -c "journalctl --since \"$(etcdctl get /sematext.com/logsene/`hostname`/lastlog)\" -o short -f | ncat --ssl logsene-receiver-syslog.sematext.com  10514"
ExecStopPost=/bin/sh -c "export D=\"`date +\"%Y-%%m-%%d %%H:%M:%S\"`\"; /bin/etcdctl set /sematext.com/logsene/$(hostname)/lastlog \"$D\""

[Install]
WantedBy=multi-user.target

[X-Fleet]
Global=true

Activate cluster-wide logging to Logsene with fleet

To start logging to Logsene from all machines activate logsene.service:

fleetctl load logsene.service
fleetctl start logsene.service

There.  That’s all there is to it!  Hope this worked for you!

At this point all your CoreOS logs should be going to Logsene.  Now you have a central place to see all your CoreOS logs.  If you want to send your app logs to Logsene, you can do that, too — anything that can send logs via Syslog or to Elasticsearch can also ship logs to Logsene. If you want some Docker containers & host monitoring to go with your CoreOS logs, just pull spm-agent-docker from Docker Registry.  Enjoy!

Monitoring Kibana 4’s Node.js App

The release of Kibana 4.x has had an impact on monitoring and other related activities.  In this post we’re going to get specific and show you how to add Node.js monitoring to the Kibana 4 server app.  Why Node.js?  Because Kibana 4 now comes with a little Node.js server app that sits between the Kibana UI and the Elasticsearch backend.  Conveniently, you can monitor Node.js apps with SPM, which means SPM can monitor Kibana in addition to monitoring Elasticsearch.  Futhermore, Logstash can also be monitored with SPM, which means you can use SPM to monitor your whole ELK Stack!  But, I digress…

A few important things to note first:

  • the Kibana 4 project moved from Ruby to pure browser app to Node.js on the server side, as mentioned above
  • it now uses the popular Express Web Framework
  • the server component has a built-in proxy to Elasticsearch, just like it did with the Ruby app
  • when monitoring Kibana 4, the proxy requests to Elasticsearch are monitored at the same time

OK, here’s how to add Node.js monitoring to the Kibana 4 server-side app.

1) Preparation

Get an App Token for SPM by creating a new Node.js SPM App in SPM.

Kibana 4 currently ships with Node.js version 0.10.35 in a subdirectory – so please make sure your Node.js is on 0.10 while installing SPM Agent for Node.js (it compiles native modules, which need to fit to Kibana’s 0.10 runtime).

  npm-install n -g
  n 0.10.35

After finishing the described installation below you can easily switch back to 0.12 or io.js 2.0 by using “n 0.12” or “n io 2.0” – because Kibana will use its own node.js sub-folder.

2) Install SPM Agent for Node.js

Switch over to your Kibana 4 installation directory.  It has a “src” folder where the Node.js modules are installed.

  cd src
  npm install spm-agent-nodejs

Add the following line to ./src/app.js

  var spmAgent = require ('spm-agent-nodejs')

Add the following line to bin/kibana shell script at the beginning

export spmagent_tokens__spm=YOUR-SPM-APP-TOKEN

3) Run Kibana

bin/kibana

4) Check results in SPM

After a minute you should see the performance metrics such as EventLoop Latencies, Memory Usage, Garbage Collection details and HTTP statistics of your Kibana 4 Server app in SPM.

Kibana 4 - monitored with SPM for Node.js
Kibana 4 – monitored with SPM for Node.js

SPM for Node.js Monitoring – Details, Screenshots and more

For more specific details about SPM’s Node.js monitoring integration, check out this blog post.

That’s all there is to it!  If you’ve got questions or feedback to this post, please let us know!

Custom Metrics from Node.js Apps

We recently added support for Node.js and io.js monitoring to SPM and have received great feedback.  While SPM for Node.js monitors all key Node.js metrics, most applications have additional metrics one often wants to track — things like: the number of concurrent users, the number of items placed in a shopping cart, or any other kind of IT metric, business transaction or KPI.  SPM already provides a Custom Metrics API and libraries that make shipping custom metrics from Java and from Ruby applications a snap.  But why leave Node.js behind?  Meet spm-metrics-js (it’s on Github) – the npm module for sending custom metrics from Node.js apps to SPM.  

This JavaScript module supports measurements using counters, meters, timers, and histograms. These helpers calculate values of metrics objects and ship them to SPM, where they are then turned into charts and inputs to alert rules and anomaly detection algorithms.

Here’s an example for counting users on login and logout:

// app.js generates login/logout events
var app = require('./app.js')
var os = require('os')
// create SPM client
var SPM = require('spm-metrics-js')
var spmClient = new SPM(process.env.SPM_TOKEN, 20000)
// Create a metrics object to count users
var userCounterMetric = spmClient.getCustomMetric({
// name of the metric
name: 'concurrentUser',
// aggregation type
aggregation: 'avg',
// filter value in SPM User Interface, e.g. hostname
filter1: os.hostname(),
// auto-save metrics in the given interval
interval: 30000})
// use metric as 'counter' object
var counter = userCounterMetric.counter()
// Hook the counter to your business logic
app.on('login', function (user, password) {counter.inc()})
app.on('logout', function (user) {counter.dec()})
view raw counter.js hosted with ❤ by GitHub

Sending custom metrics is really that easy!

Now, let’s have a look at the options used when creating a custom metric object:

  • name – the name of the metric you can find in SPM’s user interface
  • aggregation – the aggregation type: ‘avg’, ‘sum’, ‘min’ or ‘max’ used in SPM’s aggregations server
  • filter1 – the SPM user interface provides two filter criteria; the value will be available in the UI as the first filter
  • filter2 – the filter value for the second filter field in SPM’s UI
  • interval – time in ms to call save() periodically. Defaults to no automatic call to save(). The save() function captures the metric and resets meters, histograms, counters or timers.
  • valueFilter – array of property names for calculated values. Only specified fields are sent to SPM (e.g. [‘count’, ‘min’, ‘max’].

Additional measurement functions are available to extend the custom metric object automatically with additional calculated properties:

  • Meter – measure rates and provide the following calculated properties:
    • mean: the average rate since the meter was started
    • count: the total of all values added to the meter
    • currentRate: the rate of the meter since the meter was started
    • 1MinuteRate: the rate of the meter biased toward the last 1 minute
    • 5MinuteRate: the rate of the meter biased toward the last 5 minutes
    • 15MinuteRate: the rate of the meter biased toward the last 15 minutes
  • Histogram – build percentile, min, max, & sum aggregations over time
    • min: the lowest observed value
    • max: the highest observed value
    • sum: the sum of all observed values
    • variance: the variance of all observed values
    • mean: the average of all observed values
    • stddev: the stddev of all observed values
    • count: the number of observed values
    • median: 50% of all values in the reservoir are at or below this value.
    • p75: see median, 75% percentile
    • p95: see median, 95% percentile
    • p99: see median, 99% percentile
    • p999: see median, 99.9% percentile
  • Timer – measures time and captures rates in an internal meter and histogram

If this is more than you actually need, we recommend selecting only the relevant properties (using the ‘valueFilter’ option). Please note that Custom Metrics are aggregated by the specified aggregation type (‘avg’, ‘sum’, ‘min’, ‘max’).  Moreover, the aggregation type for each property can be defined – for further details please check the package documentation.

Adding instrumentation always raises the question of performance; in spm-metrics-js all metrics are buffered and efficiently ship metrics to SPM in bulk using asynchronous functions. We recommend using a transmit time of 60 seconds.

Once you send custom metrics to SPM you can create alerts on them, have SPM detect and alert you about anomalies, put charts with those metrics on dashboards, share charts with those metrics publicly or just with your team or organization, etc.

custom-metric-alert
Actions for Metrics – e.g. define alerts using anomaly detection
custom-metric-dashboard
Dashboard with Custom Metric and other Metrics

Please note the free plan has no limits on the number of monitored Applications, Processes, Dashboards or Users and you can share Accounts with your whole DevOps team and integrate SPM with Slack, HipChat, PagerDuty, Webhooks, etc. If you don’t use SPM yet, grab a free account to start monitoring your Node.js and io.js applications and benefit from all standard SPM features such as alerting, anomaly detection, event and log correlation, unlimited dashboards, secure information sharing, etc. Check out spm-metrics-js (or on Github) and drop us a line (or tweet 140 characters to @sematext) — we’d love to hear from you!

Node.js and io.js Monitoring Support

Node.js and io.js are increasingly being used to run JavaScript on the server side for many types of applications, such as websites, real-time messaging and controllers for small devices with limited resources. For DevOps it is crucial to monitor the whole application stack and Node.js is rapidly becoming an important part of the stack in many organizations. Sematext has historically had a strong support for monitoring big data applications such as Elastic (aka Elasticsearch), Cassandra, Solr, Spark, Hadoop, and HBase, as well as more traditional databases, web servers like Nginx, Nginx Plus and Apache, Java applications, cache servers like Redis and Memcached, messaging middleware like everyone’s darling Kafka, etc.  With such rapid adoption of Node.js and now io.js, we’d be remiss not to add performance monitoring, alerting, and anomaly detection for them in SPM!

spm-node-io

SPM for Node.js

We’re happy to announce we’ve just added Node.js monitoring to this growing list of SPM integrations.  SPM for Node.js covers key Node.js metrics such as Event Loop, Garbage Collection, CPU, Memory and web services metrics.  All metrics are organized in out-of-the-box charts, which can be put on additional dashboards and placed next to performance charts for other parts of the application stack.

Overview for top node.js and io.js metrics

Of course, you can view your Node.js metrics in a larger context.  For example, here is a dashboard that shows Node.js metrics together with Elasticsearch metrics, making it easier to correlate performance across multiple tiers of the application stack.  You could also get your event and log charts on the same dashboard for an even more thorough correlation.

nodejs-elasticsearch-dashboard
Dashboard with node.js HTTP response time and Elasticsearch query latency

Needless to say, we made sure everything works for the latest versions of Node.js (0.12) and io.js (1.6). Installation is as easy as integration of any other module using npm.  If you are not using SPM yet, you can sign up with no commitment or credit card.  You have 30-days free on any new app you create.  If you are already using SPM, you can simply add a new SPM App for Node.js and see all your Node.js metrics in just a few minutes.  Don’t see something in SPM for Node.js?  Please let us know (@sematext) or comment below, we are looking for feedback!

Kafka 0.8.2 Monitoring Support

SPM Performance Monitoring is the first Apache Kafka monitoring tool to support Kafka 0.8.2.  Here are all the details:

Shiny, New Kafka Metrics

Kafka 0.8.2 has a pile of new metrics for all three main Kafka components: Producers, Brokers, and Consumers.  Not only does it have a lot of new metrics, the whole metrics part of Kafka has been redone — we worked closely with Kafka developers for several weeks to bring order and structure to all Kafka metrics and make them easy to collect, parse and interpret.

We could list all the Kafka metrics you can get via SPM, but in short — SPM monitors all Kafka metrics and, as with all things SPM monitors, all these metrics are nicely graphed and are filterable by server name, topic, partition, and everything else that makes sense in Kafka deployments.

103 Kafka metrics:

  • Broker: 43 metrics
  • Producer: 9 metrics
  • New Producer: 38 metrics
  • Consumer: 13 metrics

You will be hard-pressed to find another solution that can monitor that many Kafka metrics out of the box! And if you want to do something with your Kafka logs, Logsene will gladly make them searchable for you!

Needless to say, SPM shows the most sought after Kafka metric – the Consumer Lag (see the screenshot below).

Screenshot – Kafka Metrics Overview  (click to enlarge)

kafka-overview_annotated_1

Screenshot – Consumer Lag  (click to enlarge)

Kafa_Consumer_Lag_annotated

Monitoring Kafka in Context

Running Kafka alone is pointless. On one side you process or collect data and push it into Kafka.  On the other side you consume that data (maybe processing it some more) and in the end this data typically ends up landing in some data store. Kafka is often used with data processing frameworks like Spark, Storm and Hadoop, or data stores like Cassandra and HBase, search engines like Elasticsearch and Solr, and so on.  Wouldn’t it be nice to have a single place to monitor all of these systems?  With alerts and anomaly detection?  And letting you collect and search all their logs?  Guess what?  SPM and Logsene do exactly that — they can monitor all of these technologies and make all their logs searchable!

Take a Test Drive — It’s Easy and Free to Get Started

Like what you see here?  Sound like something that could benefit your organization?  Then try SPM for Free for 30 days by registering here.  There’s no commitment and no credit card required.

HAProxy Monitoring Support

New functionality is rolling out in SPM Performance Monitoring!  Watch this space for future posts on Transaction Tracing, Global and App-specific Server Views, Kafka 0.8.2 monitoring and other cool stuff.  For this post, those of you who use HAProxy are in luck as we just added monitoring support for this popular TCP/HTTP load balancer.

See also: Apache monitoring, and Nginx & Nginx Plus monitoring.

Screenshot – HAProxy Session Rate  (click to enlarge)

haproxy-session-rate copy 2

HAProxy Metrics

SPM collects key metrics from the HAProxy load balancer of the underlying proxies/servers, as you can see in the chart below.

Metric Name Description
status 1 (UP/OPEN) 0 (DOWN)
downtime total downtime (in seconds)
rate number of sessions per second over last elapsed second
rate_max max number of new sessions per second
rate_lim limit on new sessions per second
scur current sessions
smax max sessions
slimit sessions limit
stot total sessions
lbtot total number of times a server was selected
bin bytes in
bout bytes out
dreq denied requests
dresp denied responses
ereq error requests
eresp response errors
econ connection errors
wretr retries (warning)
wredis redispatches (warning)
weight server weight (server), total weight (backend)
act server is active (server), number of active servers (backend)
bck server is backup (server), number of backup servers (backend)

You can create threshold-based or machine learning-based anomaly detection on any of these metrics, of course, and you can also rely on heartbeat alerts to detect any HAProxy daemon going down.  Any alerts can be emailed or you can use any of the SPM Alerts Integrations such as PagerDuty, HipChat, Slack, Nagios, or any other WebHook.

See for Yourself

You can check out SPM’s live demo and see some more of SPM’s monitoring, alerting and anomaly detection functionality.  In addition to native monitoring for apps like Solr, Elasticsearch, Hadoop, HBase, Spark, Cassandra, Kafka, Storm, and many more, SPM also integrates with with Logsene Log Management and Analytics to add centralized logging functionality and correlation of metrics, logs, alerts, anomalies, and events.

Take a Test Drive — It’s Easy and Free to Get Started

Like what you see here?  Sound like something that could benefit your organization?  Then try SPM (and Logsene, too) for Free for 30 days by registering here.  There’s no commitment and no credit card required.

Cassandra Case Study – including Performance Monitoring

If you use Cassandra you will find some interesting insights in this Planet Cassandra case study by Sematext client Recruiting.com.  Hitendra Pratap Singh, a Cassandra Software Engineer, talks about why they decided to deploy Cassandra, other NoSQL solutions they looked at, advice for new Cassandra users, and more.

Here’s an excerpt:

Monitoring Apache Cassandra with SPM

“We started using SPM Performance Monitoring and Reporting from Sematext for Apache Solr and were impressed with the amount of real-time stats we could analyze using SPM. We expected the same amount of details for Cassandra as well and decided to go with SPM.  Some of the benefits we’ve seen from SPM include the alert notification system, graphical interface [i.e. easy to analyze], detailed stats related to JVM, and creation of our own custom metrics.

We also utilize SPM for monitoring our deployments of Apache Solr and Memcached servers.”

On the “Overview” screen found below, you can check out some Cassandra metrics, as well as various OS metrics. Specific Cassandra metrics can be drilled down by clicking on one of the tabs along the left side; these metrics include: Compactions, Bloom Filter (space used, false positives ratio), Write Requests (rate, count, latency), Pending Read Operations (read requests, read repair tasks, compactions), and more.

SPM for Cassandra Overview  (click to enlarge)

cassandra_overview_2

You can read the full version of “Recruiting.com Powers Real-Time High Throughput Application with Apache Cassandra” at Planet Cassandra.

And if you’d like to monitor Cassandra yourself (or any number of applications like Hadoop, HBase, Spark, Kafka, Elasticsearch, Solr, etc.), check out a Free 30-day trial by registering here.  There’s no commitment and no credit card required.  You can also see our Cassandra monitoring blog post for more details and screenshots.

Use Case: Spark Performance Monitoring

Guest blog post by Nick Pentreath, Co-founder of Graphflow

Democratizing Recommendation Technology

At Graphflow, our mission is to empower online stores of all sizes to grow their businesses by providing them access to the same machine learning and Big Data tools used by the largest and most sophisticated tech players in the market.

To deliver on this mission, we decided from the very beginning to go ‘all in’ on Spark for our scalable analytics and machine learning applications. When Graphflow started using Spark, it was on version 0.7.0, and it was relatively immature. A lot has changed over the past year and a half: Spark has become a top-level Apache project, version 1.2.0 was released, and Spark has matured significantly in terms of functionality, deployment, stability, and operations.

Spark Monitoring

There are, however, still a few “missing pieces.”  Among these are robust and easy-to-use monitoring systems. With the version 1.0.0 release, Spark added a metrics system to allow reporting and monitoring of various internal and custom Spark application metrics. Built on top of Coda Hale’s Metrics, the metrics system supports various methods of reporting to external monitoring systems.

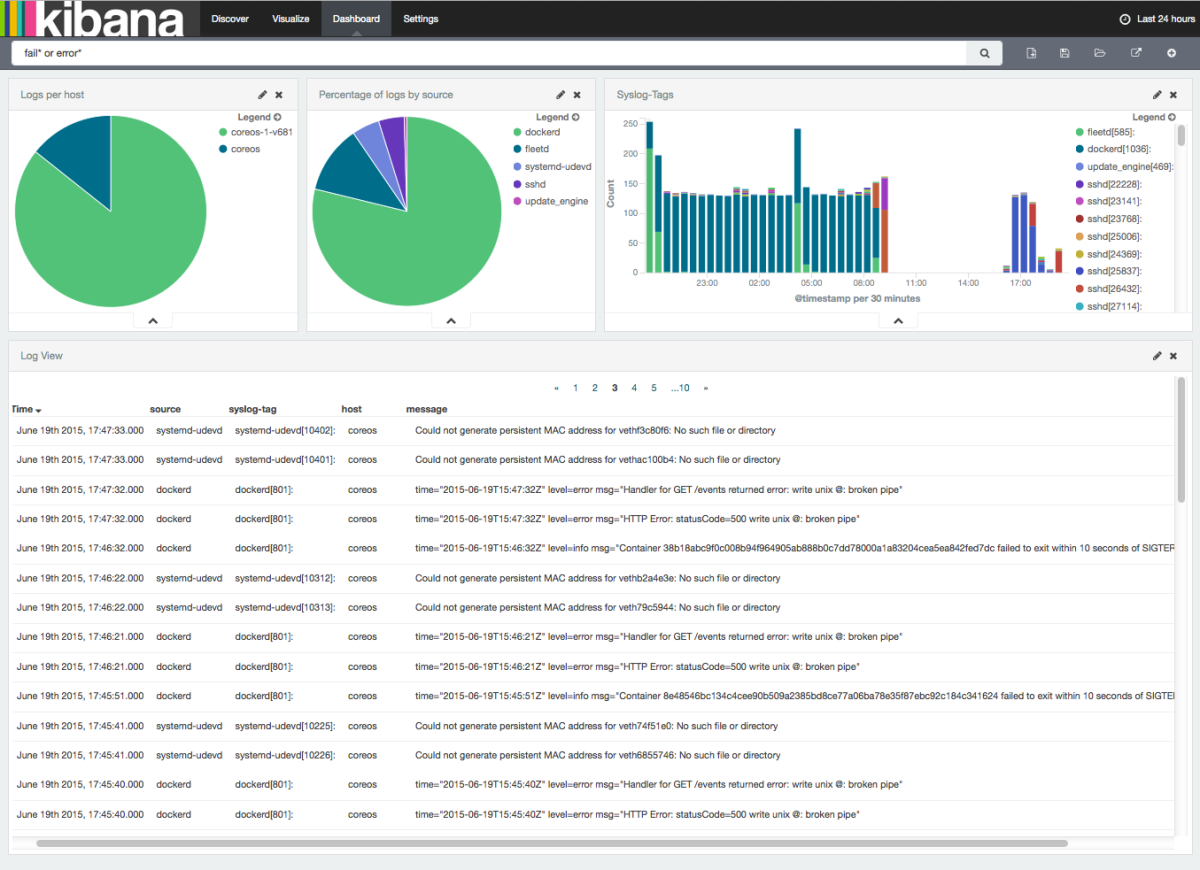
This is all very well, but being a very small team, we tend to rely on managed services wherever it makes sense — we just don’t have the resources to manage a dedicated monitoring infrastructure. We recently started using SPM (for monitoring, alerting, and anomaly detection) and Logsene (for our logs) — both from Sematext — across most of our systems, including EC2 metrics, Elasticsearch, and web application log collection and monitoring.

With the recent release of SPM for Spark monitoring, we definitely wanted to take it for a spin!

Getting up and Running

The installation process is straightforward:

  1. Install the SPM monitor on each node in the Spark cluster using the standard package manager.
  2. Amend `SPARK_MASTER_OPTS`, `SPARK_WORKER_OPTS`, and `SPARK_SUBMIT_OPTS` in `spark-env.sh` and `spark.executor.extraJavaOptions` in `spark-defaults.conf` on each node, with the appropriate config properties, including an SPM access key (don’t forget to propagate these config changes to each worker – we do this using *spark-ec2’s* `copy-dirs` command).
  3. Create or amend the metrics properties file `metrics.properties` to point to the JMX sink (by setting `*.sink.jmx.class=org.apache.spark.metrics.sink.JmxSink`).

Once all nodes are restarted, you should start seeing metrics appearing in the SPM dashboard within a few minutes.

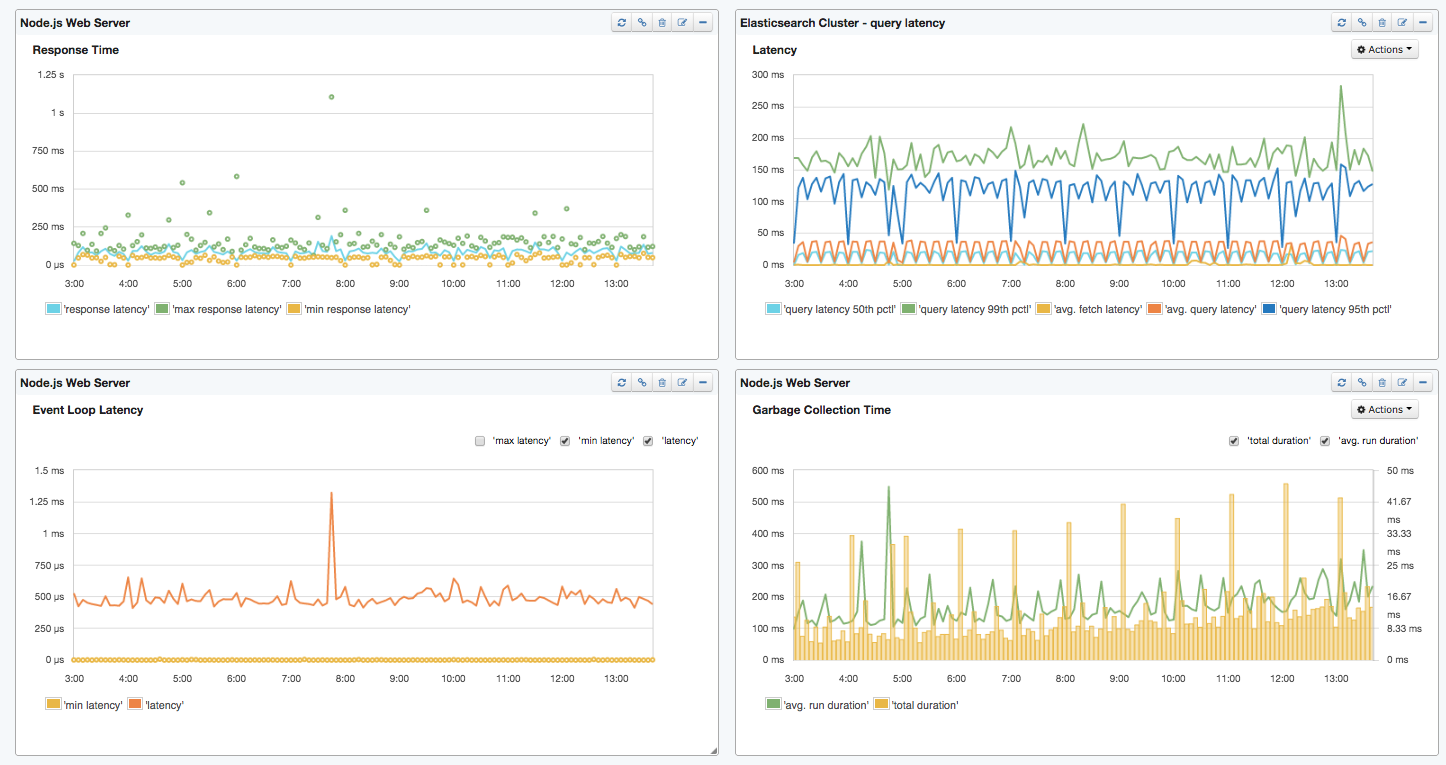
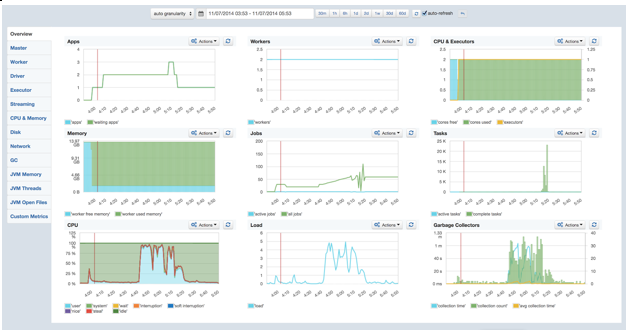
The main dashboard provides a useful overview of what’s going on in the cluster. The detail tabs on the side allow you to drill down into more detailed metrics for the Master / Driver, and Workers / Executors, and, of course, all key JVM and server metrics.  We can also feed any custom metrics we want to chart into SPM, but we are not making use of that yet.

Spark_monitoring_1

Spark Troubleshooting with SPM

Spark, being a complex distributed system, sometimes has issues. While these have become rarer with the past few releases — which have improved efficiency and stability significantly — they still happen. Probably the most common causes of failure (either of a Job, a Worker, or the Master) are related to memory pressure or misconfiguration.

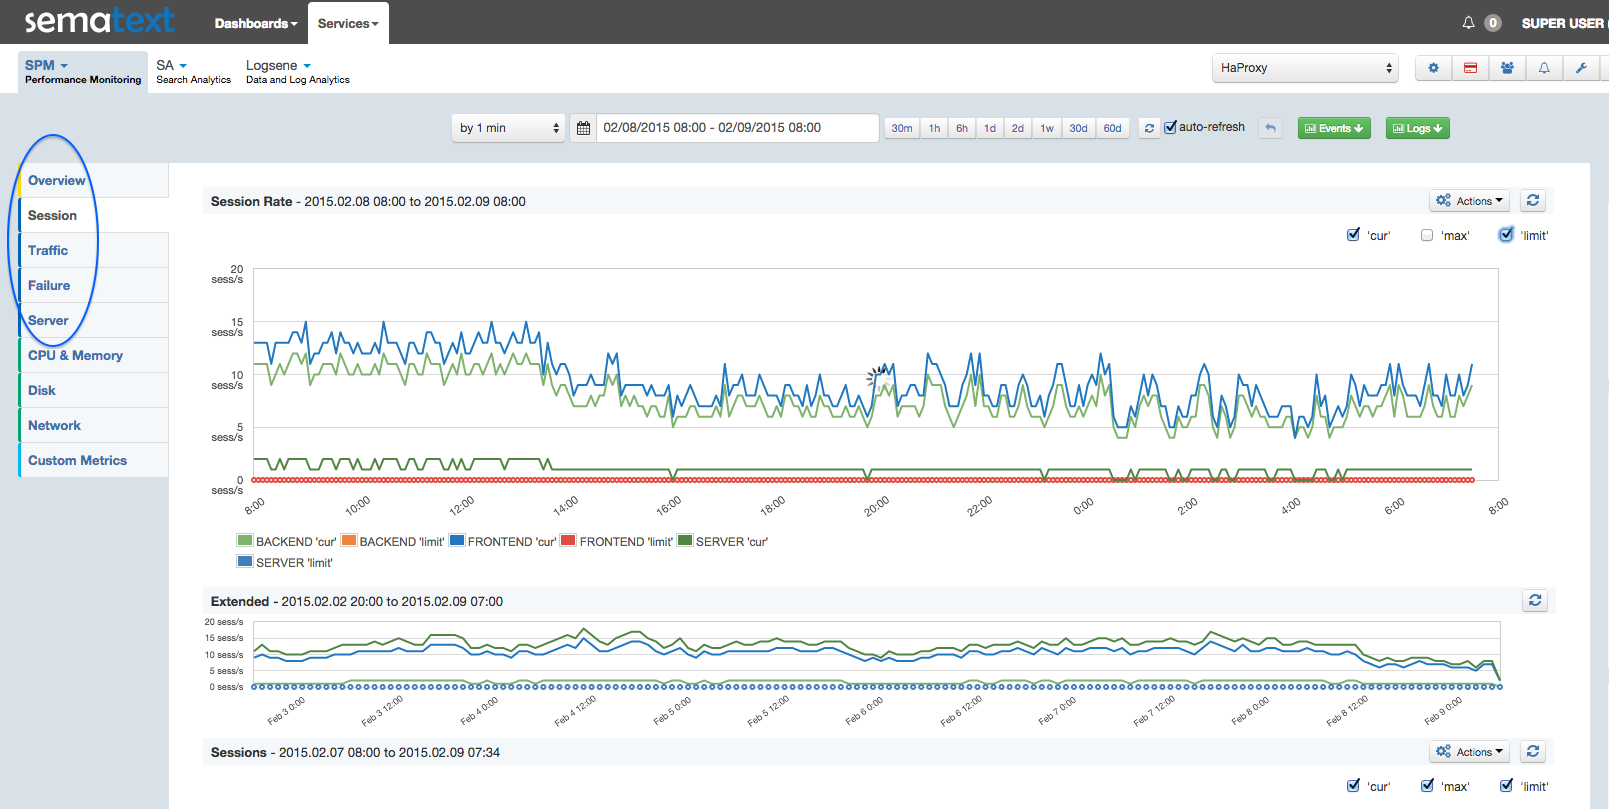
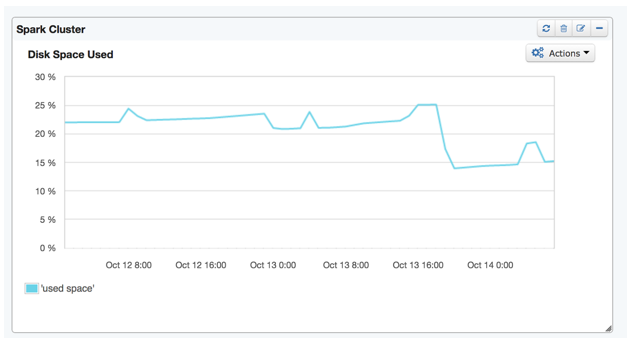
As a case in point: on a number of days we were experiencing periodic job failures due to Workers going down. However, we were not seeing a precise cause in the logs. Since we had installed SPM for Spark, we took a look through a few of the metrics dashboards. At first, it was still not clear what might be causing the issue. However, we noticed that at the time of the failure, there was a big spike in CPU usage and, directly afterwards, the overall disk usage dropped off noticeably.

Spark_monitoring_2a

Spark_monitoring_2b

Once we drilled down from the aggregated metrics view (above) to the individual disk view, the root cause became clear – running out of disk space on the root device!

Spark_monitoring_3a

Spark_monitoring_3b

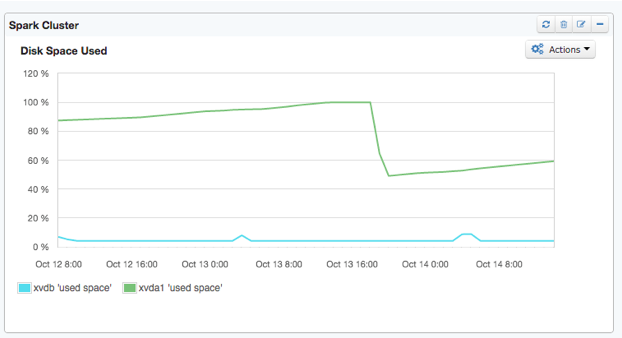
Sure enough, once we knew what to look for, we found that the Spark working directory on each Worker node had gotten clogged up with job logs and JARs.  We run a fairly large number of jobs on regular schedules (every 15 minutes, every hour, daily and so on), and each job caused more build up of these files in the working directory.

We had correctly set `spark.local.dir` to the large disk volume, but the default working directory is set to `$SPARK_HOME/work`. This setting can be changed with the environment variable `SPARK_WORKER_DIR` in `spark-env.sh`. We also turned on the ‘worker cleanup’ functionality by setting `spark.worker.cleanup.enabled true` in `spark-defaults.conf`. The Spark Standalone guide has more detail on these settings.

Everything in One Place

Using SPM, together with the Spark Web UI and its ability to keep history on previously run Spark applications, we’ve found that troubleshooting Spark performance issues has gotten much easier. On top of that, the ability to manage metrics, monitoring and logging across our entire stack in one place, as well as integrate log search and analytics for Spark, is a huge win for our team.

To learn more about us and our eCommerce and Recommendation Analytics solutions, visit the Graphflow web site.  And to learn more about SPM for Spark monitoring, check out Sematext.

Got some feedback or suggestions?  Drop Sematext a line — they’d love to hear from you!

Integrating SPM Performance Monitoring with Slack

Many distributed DevOps teams rely on Slack,  a platform for team communication providing everything in one place, instantly searchable and available wherever you go.  SPM Performance Monitoring‘s new integration via WebHooks provides the capability to forward alerts to many services, including Slack.

The integration of both services can be achieved by using the WebHook URL from Slack and then configuring this WebHook in SPM.  The SPM Wiki explains how to get this information from Slack and build the WebHook in SPM: Alerts – Slack integration

spm-slack-alert-logo

This whole process only takes a minute or two.  Slack is a tool that is becoming more popular among the DevOps crowd, and here at Sematext we pride ourselves on staying on top of what our users need and expect.

Need some extra help with this setup or another app you might want to integrate?  Have ideas for other integrations we should explore? Please drop us a line, we’re here to help and listen.