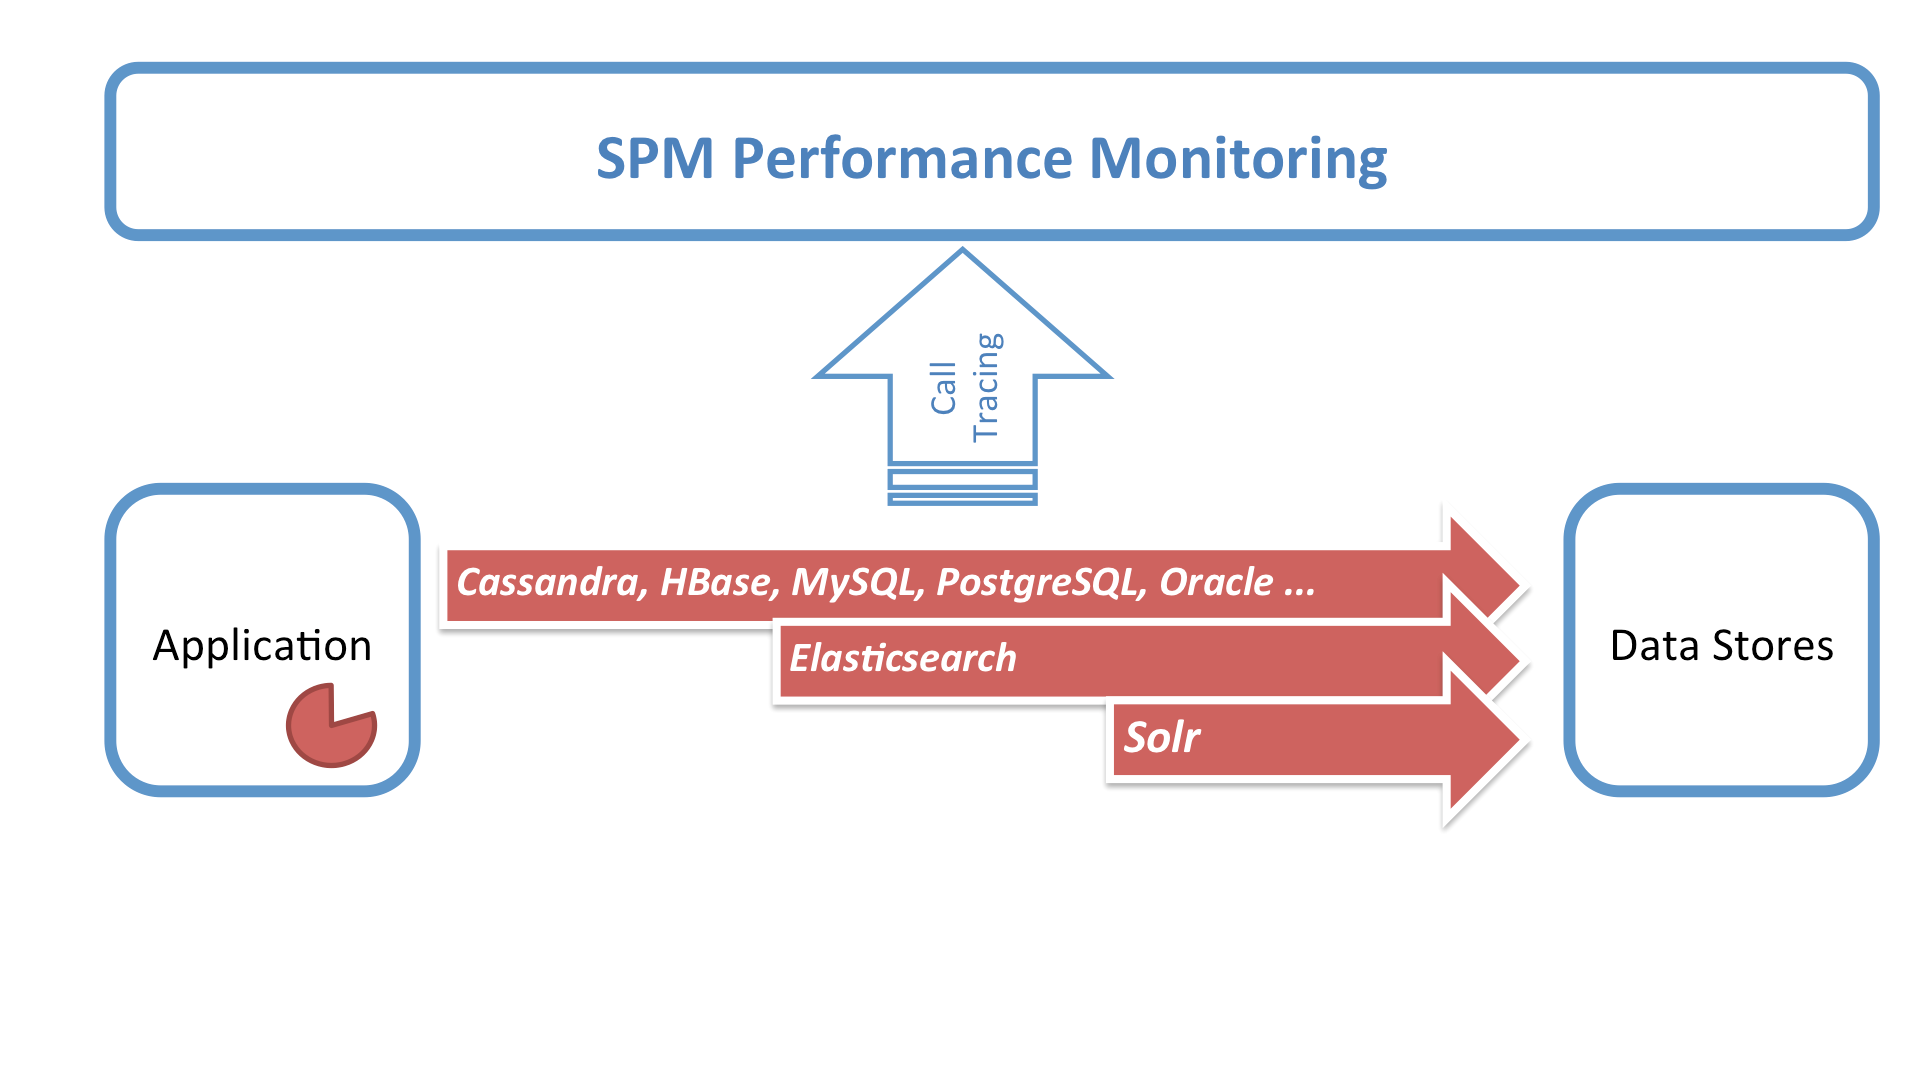
Akka is a toolkit and runtime for building highly concurrent, distributed and resilient message-driven applications on the JVM. It’s a part of Scala’s standard distribution for the implementation of the “actor model”.
How Akka Works
Messages between Actors are exchanged in Mailbox queues and Dispatcher provides various concurrency models, while Routers manage the message flow between Actors. That’s quite a lot Akka is doing for developers!
But how does one find bottlenecks in distributed Akka applications? Well, many Akka users already use the great Kamon Open-Source Monitoring Tool, which makes it easy to collect Akka metrics. However — and this is important! — predefined visualizations, dashboards, anomaly detection, alerts and role-based access controls for the DevOps team are out of scope for Kamon, which is focused on metrics collection only. To overcome this challenge, Kamon’s design makes it possible to integrate Kamon with other monitoring tools.
Needless to say, Sematext has embraced this philosophy and contributed the Kamon backend to SPM. This gives Akka users the option to use detailed Metrics from Kamon along with the visualization, alerting, anomaly detection, and team collaboration functionalities offered by SPM.
The latest release of Kamon 0.5.x includes kamon-spm module and was announced on August 17th, 2015 on the Kamon blog. Here’s an excerpt:
“Pavel Zalunin from Sematext contributed the new kamon-spm module, which as you might guess allows you to push metrics data to the Sematext Performance Monitor platform. This contribution is particularly special to us, given the fact that this is the first time that a commercial entity in the performance monitoring sector takes the first step to integrate with Kamon, and they did it so cleanly that we didn’t even have to ask any changes to the PR, it was just perfect. We sincerely hope that more companies follow the steps of Sematext in this matter.”
Now let’s take a look at the result of this integration work:
- Metrics pushed to SPM are displayed in predefined reports, including:
- An overview of all key Akka metrics
- Metrics for Actors, Dispatchers and Routers
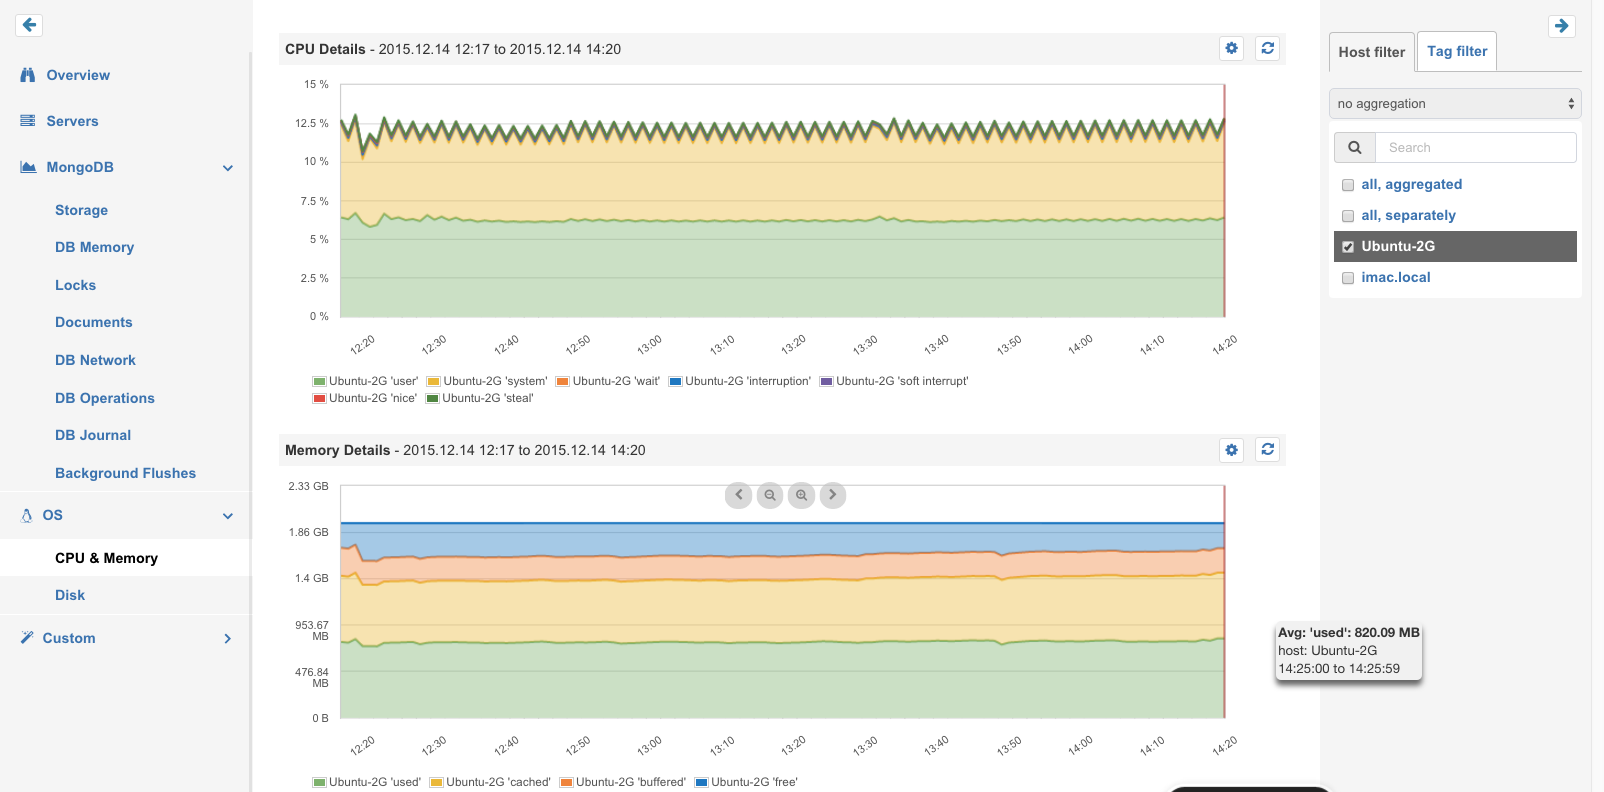
- Common metrics for CPU, Memory, Network, I/O, JVM and Garbage Collection
- Each chart has the “Action” menu to:
- Define criteria for anomaly detection and alerts
- Create scheduled email reports
- Securely share charts with read-only links
- Embed charts into custom dashboards
- A single SPM App can take metrics from multiple hosts to monitor a whole cluster; filters by Host, Actor, Dispatcher, and Router make it easy to drill down to the relevant piece of information.
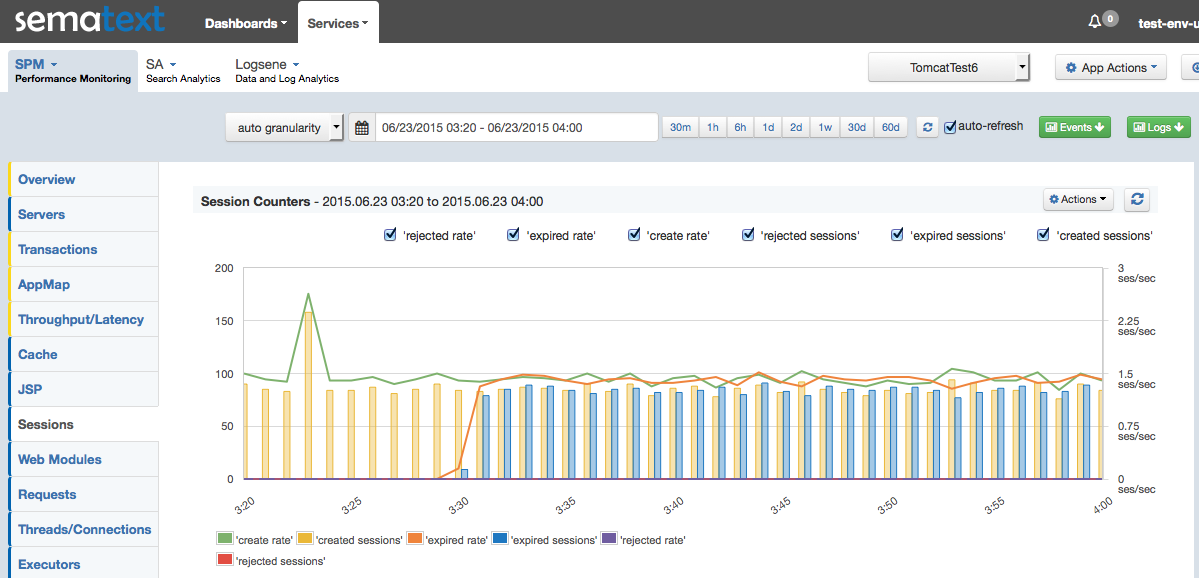
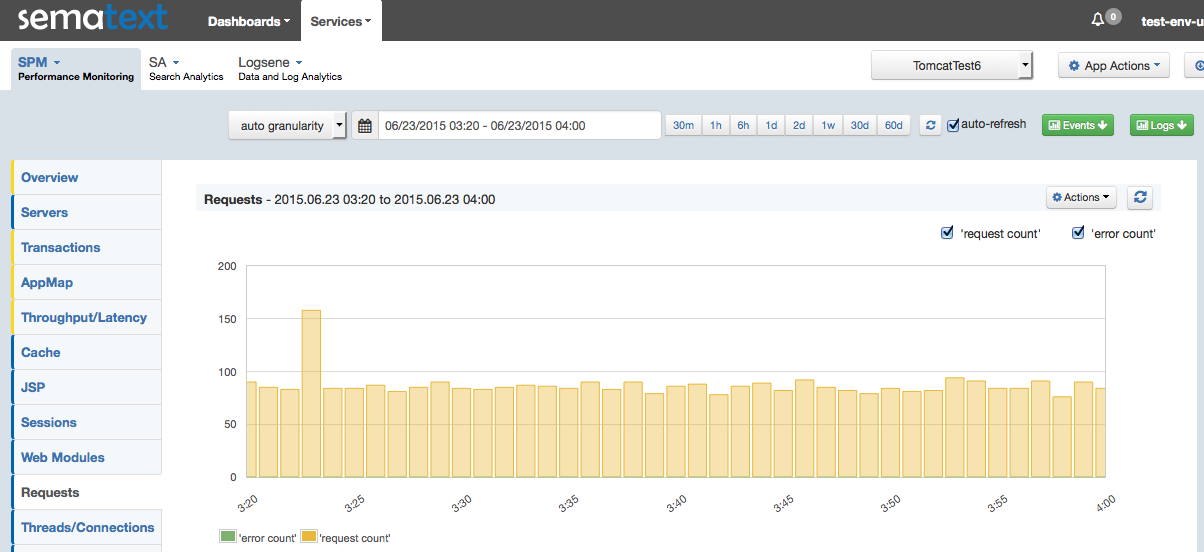
- All other SPM features, are available for Akka users, too. For example:

Akka Metrics Overview
Actor Metrics
Actors send and receive messages, therefore the key metrics for Actors are:
- Time in Mailbox
Messages are waiting to be processed in the Mailbox – high Time in Mailbox values indicate potential delays in processing.
- Processing Time
This is the time Actors need to process the received messages – use this to discover slow Actors
- Mailbox Size
Large Mailbox Size could indicate pending operations, e.g. when it is constantly growing.
Each of the above metrics is presented in aggregate for all Actors, but one can also use SPM filtering feature to view all Actors’ metrics separately or select one or more specific Actors and visualize only their metrics. Filtering by Host is also possible, as show below.

Akka Actors
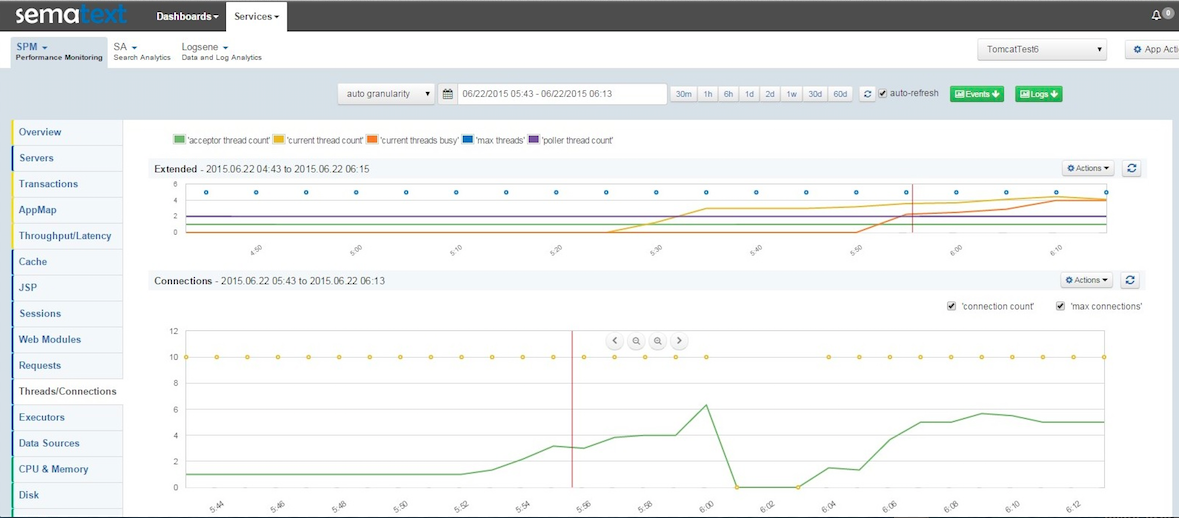
Dispatcher Metrics
In Akka a Dispatcher is what makes Actors ‘tick’. Each Actor is associated with a particular Dispatcher (default one is used if no explicit Dispatcher is set). Each Dispatcher is associated with a particular Executor – Thread Pool or Fork Join Pool. The SPM Dispatcher report shows information about Executors:
- Fork Join Pool
- Thread Pool Executor
All metrics can be filtered by Host and Dispatcher.

Akka Dispatchers
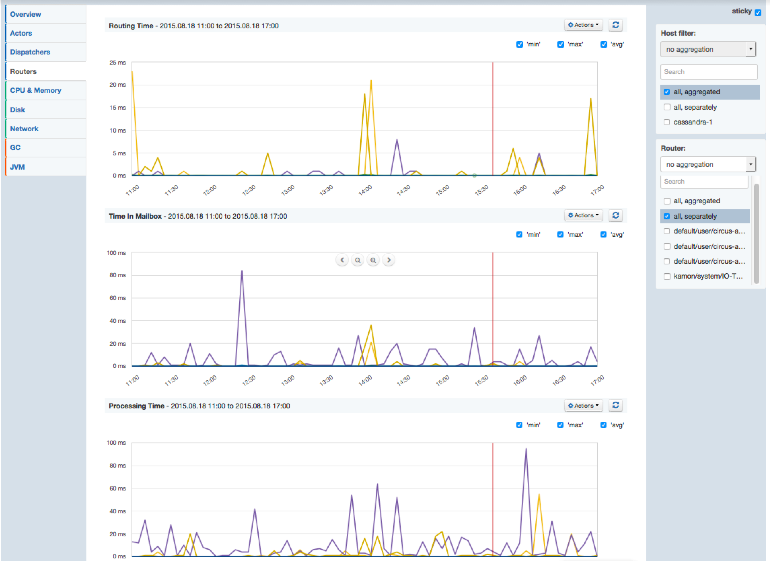
Router Metrics
Routers can be used to efficiently route messages to destination Actors, called Routees.
- Routing Time – Time to route message to selected destination
- Time In Mailbox – Time spent in routees mailbox.
- Processing Time – Time spent by routee actor to process routed messages
- Errors Count – Errors count during processing messages by routee
For all these metrics, lower values are better, of course.

Akka Routers
You can set Alerts and enable Anomaly Detection for any Akka or OS metrics you see in SPM and you can create custom Dashboards with any combination of charts, whether from your Akka apps or other apps monitored by SPM.
We hope you like this new addition to SPM. Got ideas how we could make it more useful for you? Let us know via comments, email, or @sematext.
Not using SPM yet? Check out the free 30-day SPM trial by registering here (ping us if you’re a startup, a non-profit, or education institution – we’ve got special pricing for you!). There’s no commitment and no credit card required. SPM monitors a ton of applications, like Elasticsearch, Solr, Cassandra, Hadoop, Spark, Node.js (open-source), Docker (get open-source Docker image), CoreOS, RancherOS and more.