While many SPM Performance Monitoring users quickly see the benefits of SPM and adopt it in their organizations for monitoring — not just for Elasticsearch, but for their complete application stack — some Elasticsearch users evaluate SPM and compare it to Marvel from Elasticsearch. We’ve been asked about SPM vs. Marvel enough times that we decided to put together this focused comparison to show some of the key differences and help individuals and organizations pick the right tool for their needs.
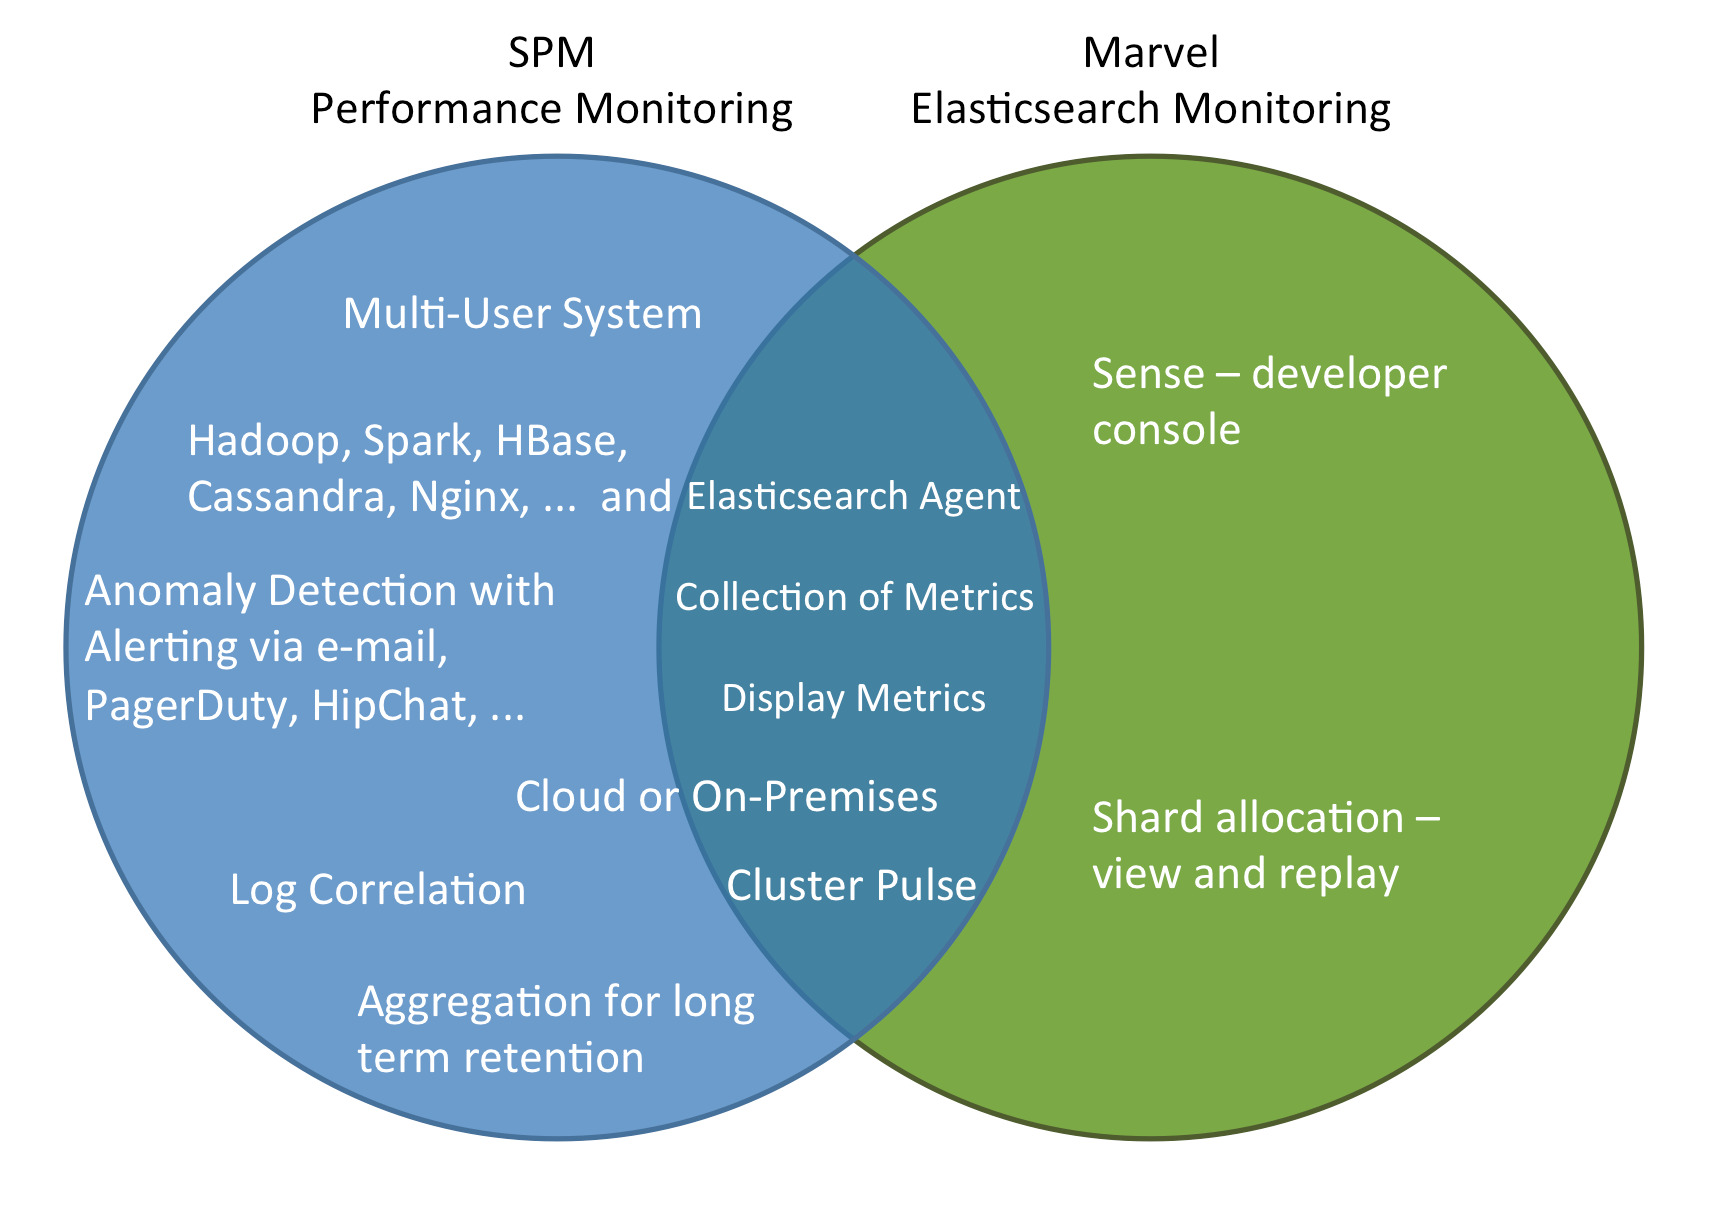
Marvel is a relatively young product that provides a detailed visualization of Elasticsearch metrics in a Kibana-based UI. It installs as an Elasticsearch plug-in and includes ‘Sense’ (a developer console), plus a replay functionality for shard allocation history.
SPM, on the other hand, offers multiple agent deployment modes, has both Cloud and On Premises versions, includes alerts and anomaly detection, is not limited to Elasticsearch monitoring, integrates with third party services, etc. The following Venn diagram shows key areas that SPM and Marvel have in common and also the areas where they differ.
Looking into the details surfaces many notable differences. For example:
- The SPM agent can run independently from the Elasticsearch process and an upgrade of the agent does not require a restart of Elasticsearch
- Dashboards are defined with different philosophies: Marvel exposes each Metric in a separate chart, while SPM groups related metrics together in a single chart or in adjacent charts (thus making it easy for people to have more information in a single place without needing to jump between multiple views)
- Both have the ability to show metrics from multiple nodes in a single chart: Marvel draws a separate line for each node, while in SPM you can choose to aggregate values or display them separately.
The following “SPM vs. Marvel Comparison Table” is a starting point to evaluate monitoring products for organization’s individual needs.
SPM vs. Marvel Comparison Table
| Feature | SPM by Sematext | Marvel by Elasticsearch |
| Supported Applications | Elasticsearch, Hadoop, Spark, Kafka, Storm, Cassandra, HBase, Redis, Memcached, NGINX(+), Apache, MySQL, Solr, AWS CloudWatch, JVM, … | Elasticsearch |
| Agent deployment mode | in- and out-of-process (out-of-process allows for seamless updates without requiring Elasticsearch restarts) |
in-process (as Elasticsearch plug-in; updates require Elasticsearch restarts) |
| Predefined dashboard graphs organized in groups | YES | YES |
| Saving Individual Dashboards | Each user can store multiple dashboards, mixing charts from all applications, including both metrics and logs. | Current view can be saved, reset to defaults possible. These changes are global. |
| API for Custom Metrics and Business KPIs | YES | NO |
| Extra Elasticsearch Metrics | NO
|
YES
|
| OS and JVM Metrics | YES (+)
|
YES |
| Correlation of Metrics with Logs, Events, Alerts, and Anomalies | YES
|
NO
|
| Deployment model | SaaS or On Premises | On Premises |
| Security/User Roles & Permissions |
YES | NO |
| Easy & Secure Sharing of Reports with internal and external organizations | YES
|
NO |
| Machine Learning-based Anomaly Detection | YES | NO |
| Threshold based Alerts | YES | NO |
| Heartbeat Alerts | YES | NO |
| Forwarding Alerts to 3rd parties | YES
|
NO |
| Metrics Aggregation | YES
|
YES
|
As an aside, most of the features in this comparison table would also apply if we compared SPM to BigDesk, ElasticHQ, Statsd, Graphite, Ganglia, Nagios, Riemann, and other application-specific monitoring or alerting tools out there.
If you have any questions about this comparison or have any feedback, please let us know!
