There are a lot of sources of logs these days. Some may come from mobile devices, some from your Linux servers used to host data, while other can be related to your Docker containers. They are all supported by Logsene. What’s more, you can also ship logs from your Microsoft Windows based hosts and visualize them using Logsene. In this blog post we’ll show how to send your Windows Event Logs to Logsene in a way that will let you build great visualizations and really see what is happening on your Windows-based systems.
Continue reading “Sending your Windows Event Logs to Logsene using NxLog and Logstash”
Tag: logstash
Recipe: rsyslog + Kafka + Logstash
This recipe is similar to the previous rsyslog + Redis + Logstash one, except that we’ll use Kafka as a central buffer and connecting point instead of Redis. You’ll have more of the same advantages:
- rsyslog is light and crazy-fast, including when you want it to tail files and parse unstructured data (see the Apache logs + rsyslog + Elasticsearch recipe)
- Kafka is awesome at buffering things
- Logstash can transform your logs and connect them to N destinations with unmatched ease
There are a couple of differences to the Redis recipe, though:
- rsyslog already has Kafka output packages, so it’s easier to set up
- Kafka has a different set of features than Redis (trying to avoid flame wars here) when it comes to queues and scaling
As with the other recipes, I’ll show you how to install and configure the needed components. The end result would be that local syslog (and tailed files, if you want to tail them) will end up in Elasticsearch, or a logging SaaS like Logsene (which exposes the Elasticsearch API for both indexing and searching). Of course you can choose to change your rsyslog configuration to parse logs as well (as we’ve shown before), and change Logstash to do other things (like adding GeoIP info).
Getting the ingredients
First of all, you’ll probably need to update rsyslog. Most distros come with ancient versions and don’t have the plugins you need. From the official packages you can install:
- rsyslog. This will update the base package, including the file-tailing module
- rsyslog-kafka. This will get you the Kafka output module
If you don’t have Kafka already, you can set it up by downloading the binary tar. And then you can follow the quickstart guide. Basically you’ll have to start Zookeeper first (assuming you don’t have one already that you’d want to re-use):
bin/zookeeper-server-start.sh config/zookeeper.properties
And then start Kafka itself and create a simple 1-partition topic that we’ll use for pushing logs from rsyslog to Logstash. Let’s call it rsyslog_logstash:
bin/kafka-server-start.sh config/server.properties
bin/kafka-topics.sh --create --zookeeper localhost:2181 --replication-factor 1 --partitions 1 --topic rsyslog_logstash
Finally, you’ll have Logstash. At the time of writing this, we have a beta of 2.0, which comes with lots of improvements (including huge performance gains of the GeoIP filter I touched on earlier). After downloading and unpacking, you can start it via:
bin/logstash -f logstash.conf
Though you also have packages, in which case you’d put the configuration file in /etc/logstash/conf.d/ and start it with the init script.
Configuring rsyslog
With rsyslog, you’d need to load the needed modules first:
module(load="imuxsock")  # will listen to your local syslog
module(load="imfile")    # if you want to tail files
module(load="omkafka")   # lets you send to Kafka
If you want to tail files, you’d have to add definitions for each group of files like this:
input(type="imfile"
  File="/opt/logs/example*.log"
  Tag="examplelogs"
)
Then you’d need a template that will build JSON documents out of your logs. You would publish these JSON’s to Kafka and consume them with Logstash. Here’s one that works well for plain syslog and tailed files that aren’t parsed via mmnormalize:
template(name="json_lines" type="list" option.json="on") {
  constant(value="{")
  constant(value="\"timestamp\":\"")
  property(name="timereported" dateFormat="rfc3339")
  constant(value="\",\"message\":\"")
  property(name="msg")
  constant(value="\",\"host\":\"")
  property(name="hostname")
  constant(value="\",\"severity\":\"")
  property(name="syslogseverity-text")
  constant(value="\",\"facility\":\"")
  property(name="syslogfacility-text")
  constant(value="\",\"syslog-tag\":\"")
  property(name="syslogtag")
  constant(value="\"}")
}
By default, rsyslog has a memory queue of 10K messages and has a single thread that works with batches of up to 16 messages (you can find all queue parameters here). You may want to change:
– the batch size, which also controls the maximum number of messages to be sent to Kafka at once
– the number of threads, which would parallelize sending to Kafka as well
– the size of the queue and its nature: in-memory(default), disk or disk-assisted
In a rsyslog->Kafka->Logstash setup I assume you want to keep rsyslog light, so these numbers would be small, like:
main_queue(
  queue.workerthreads="1"      # threads to work on the queue
  queue.dequeueBatchSize="100" # max number of messages to process at once
  queue.size="10000"           # max queue size
)
Finally, to publish to Kafka you’d mainly specify the brokers to connect to (in this example we have one listening to localhost:9092) and the name of the topic we just created:
action(
  broker=["localhost:9092"]
  type="omkafka"
  topic="rsyslog_logstash"
  template="json"
)
Assuming Kafka is started, rsyslog will keep pushing to it.
Configuring Logstash
This is the part where we pick the JSON logs (as defined in the earlier template) and forward them to the preferred destinations. First, we have the input, which will use to the Kafka topic we created. To connect, we’ll point Logstash to Zookeeper, and it will fetch all the info about Kafka from there:
input {
  kafka {
    zk_connect => "localhost:2181"
    topic_id => "rsyslog_logstash"
  }
}
At this point, you may want to use various filters to change your logs before pushing to Logsene or Elasticsearch. For this last step, you’d use the Elasticsearch output:
output {
  elasticsearch {
    hosts => "logsene-receiver.sematext.com:443" # it used to be "host" and "port" pre-2.0
    ssl => "true"
    index => "your Logsene app token goes here"
    manage_template => false
    #protocol => "http" # removed in 2.0
    #port => "443" # removed in 2.0
  }
}
And that’s it! Now you can use Kibana (or, in the case of Logsene, either Kibana or Logsene’s own UI) to search your logs!
Recipe: rsyslog + Redis + Logstash
OK, so you want to hook up rsyslog with Logstash. If you don’t remember why you want that, let me give you a few hints:
- Logstash can do lots of things, it’s easy to set up but tends to be too heavy to put on every server
- you have Redis already installed so you can use it as a centralized queue. If you don’t have it yet, it’s worth a try because it’s very light for this kind of workload.
- you have rsyslog on pretty much all your Linux boxes. It’s light and surprisingly capable, so why not make it push to Redis in order to hook it up with Logstash?
In this post, you’ll see how to install and configure the needed components so you can send your local syslog (or tail files with rsyslog) to be buffered in Redis so you can use Logstash to ship them to Elasticsearch, a logging SaaS like Logsene (which exposes the Elasticsearch API for both indexing and searching) so you can search and analyze them with Kibana:
Replaying Elasticsearch Slowlogs with Logstash and JMeter
Sometimes we just need to replay production queries – whether it’s because we want a realistic load test for the new version of a product or because we want to reproduce, in a test environment, a bug that only occurs in production (isn’t it lovely when that happens? Everything is fine in tests but when you deploy, tons of exceptions in your logs, tons of alerts from the monitoring system…).
With Elasticsearch, you can enable slowlogs to make it log queries taking longer (per shard) than a certain threshold. You can change settings on demand. For example, the following request will record all queries for test-index:
curl -XPUT localhost:9200/test-index/_settings -d '{
  "index.search.slowlog.threshold.query.warn" : "1ms"
}'
You can run those queries from the slowlog in a test environment via a tool like JMeter. In this post, we’ll cover how to parse slowlogs with Logstash to write only the queries to a file, and how to configure JMeter to run queries from that file on an Elasticsearch cluster.
Continue reading “Replaying Elasticsearch Slowlogs with Logstash and JMeter”
Handling Stack Traces with Logstash
Here at Sematext we use Java (8!) and rely on centralized logging a lot. We like them so much that we regularly share our logging experience with everyone and help others with logging, especially, ELK stack. Centralized logging plays nice with Java (and anything else that can write pretty logs). However, there is one tricky thing that can be hard to get right: properly capturing exception stack traces. Unlike your typical single-line log events, stack traces have multiple lines and they aren’t always perfectly uniform. As such, most log shipper don’t handle them properly out of the box and typically treat each stack trace line as a separate event – clearly the wrong thing to do (n.b., if you are sending logs to Logsene this way, you are going to hit your plan limits faster, so make sure you send stack traces properly!). Thus, in most cases, a special configuration is needed in order to get stack traces right. Let’s see how one needs to configure Logstash for this task. We’ll be using Logstash 1.5.
Prerequisites
We start from the following assumptions:
- you have a working Logstash setup
- local logs are written to a file named: /var/log/test.log
- the conversion pattern for log4j/logback/log4j2 is: “%d %p %m%n”
Based on the above pattern, logs should look like this, for example:
2015-03-23 11:11:50,778 INFO Initializing Systems Cache
2015-03-23 11:11:58,666 ERROR Processing request failed
kafka.common.FailedToSendMessageException: Failed to send messages after 3 tries.
	at kafka.producer.async.DefaultEventHandler.handle(DefaultEventHandler.scala:90)
	at kafka.producer.Producer.send(Producer.scala:77)
	at kafka.javaapi.producer.Producer.send(Producer.scala:42)
	...
Extracting Exception Stack Traces Correctly
Stack traces are multiline messages or events. Logstash has the ability to parse a log file and merge multiple log lines into a single event. You can do this using either the multiline codec or the multiline filter, depending on the desired effect. A codec is attached to an input and a filter can process events from multiple inputs.
The most popular example that allows matching log lines that are a part of an exception uses a not so simple regexp:
input {
  file {
    path => "/var/log/test.log"
    start_position => "beginning"
    codec => multiline {
      pattern => "(^\d+\serror)|(^.+Exception: .+)|(^\s+at .+)|(^\s+... \d+ more)|(^\s*Caused by:.+)"
      what => "previous"
    }
  }
}
If the log line is part of an exception, it is appended to the last received log line. Once a new log line is received, the complete exception is sent to be processed. The downside of this approach is that it might not match all exceptions correctly. Sure, you could keep fine-tuning and expanding the regexp and attempt to capture all possible variants of stack trace format, but … there is a better (way.
input {
  file {
    path => "/var/log/test.log"
    start_position => "beginning"
    codec => multiline {
      pattern => "^%{TIMESTAMP_ISO8601}"
      negate => true
      what => "previous"
    }
  }
}
The pattern looks for log lines starting with a timestamp and, until a new match is found, all lines are considered part of the event. This is done by setting the negate parameter to true.
Structuring Logs with Grok
To structure the information before storing the event, a filter section should be used for parsing the logs.
filter {
  mutate {
    gsub => [ "message", "\r", "" ]
  }
  grok {
    match => [ "message", "(?m)%{TIMESTAMP_ISO8601:timestamp} %{LOGLEVEL:severity} %{GREEDYDATA:message}" ]
    overwrite => [ "message" ]
  }
  date {
    match => [ "timestamp" , "yyyy-MM-dd HH:mm:ss,SSS" ]
  }
}

output {
  stdout { codec => rubydebug }
}
The output section, in this case, is only used for debugging. In the next section we show how to actually ship your logs.
First, the mutate filter removes any “\r” characters from the event. Usually, this is something you want to do, to prevent later issues when storing and visualizing the logs where “\r” could be interpreted as a “\n”.
The grok filter splits the event content into 3 parts: timestamp, severity and message (which overwrites original message). The (?m) in the beginning of the regexp is used for multiline matching and, without it, only the first line would be read. The patterns used in the regexp are provided with Logstash and should be used when possible to simplify regexps.
By default, the timestamp of the log line is considered the moment when the log line is read from the file. The date filter fixes the timestamp, by changing it to the one matched earlier with the grok filter.
Shipping the Logs
Finally, now that you’ve got all your logs extracted, even those with multiple lines like exception stack traces, it’s time to ship them to wherever you keep your logs. Here’s how you’d ship them to Logsene:
output {
  elasticsearch {
    host => "logsene-receiver.sematext.com"
    ssl => true
    port => 443
    index => "YOUR LOGSENE APP TOKEN GOES HERE"
    protocol => http
    manage_template => false
  }
}
Final Words
If you are looking for a way to ship logs containing stack traces or other complicated multi line events, Logstash is the simplest way to do it at the moment.
It is written JRuby, which makes it possible for many people to contribute to the project. The downside of this ease of use and maintainability is that it is not the fastest tool for the job and it is also quite resource hungry (both CPU and memory). Though, depending on the log volume that needs to be shipped, this might not be a problem.
For those looking for tips on how to ship multiline logs with rsyslog or syslog-ng, subscribe to this blog or follow @sematext – tips for handling stack traces with rsyslog and syslog-ng are coming.
If your organization need help with logging (ELK stack, but also rsyslog, Fluentd, Flume…), let us know. If you like to build tools and products around logs and logging, join us – we’re always looking for good toolmakers world-wide.
Presentation: Tuning Elasticsearch Indexing Pipeline for Logs
Fresh from GeeCON in Krakow…we have another Elasticsearch and Logging manifesto from Sematext engineers — and book authors — Rafal Kuc and Radu Gheorghe. As with many of their previous presentations, Radu and Rafal go into detail on Elasticsearch, Logstash and Rsyslog topics like:
- How Elasticsearch, Logstash and Rsyslog work
- Tuning Elasticsearch
- Using, scaling, and tuning Logstash
- Using and tuning Rsyslog
- Rsyslog with JSON parsing
- Hardware and data tests
- …and lots more along these lines
[Note: Video of the talk coming soon to this post!]
If you find this stuff interesting and have similar challenges, then drop us a line to chat about our Elasticsearch and Logging consulting services and Elasticsearch (and Solr, too) production support. Oh yeah, and we’re hiring worldwide if you are into Logging, Monitoring, Search, or Big Data Analytics as much as Radu and Rafal!
Recipe: Reindexing Elasticsearch Documents with Logstash
If you’re working with Elasticsearch, it’s very likely that you’ll need to reindex data at some point. The most popular reason is because you need a mapping change that is incompatible with your current mapping. New fields can be added by default, but many changes are not allowed, for example:
- Want to switch to doc values because field data is taking too much heap? Reindex!
- Want to change the analyzer of a given field? Reindex!
- Want to break one great big index into time-based indices? Reindex!
Enter Logstash
A while ago I was using stream2es for reindexing, but if you look at the GitHub page it recommends using Logstash instead. Why? In general, Logstash can do more stuff, here are my top three reasons:
- On the input side, you can filter only a subset of documents to reindex
- You can add filters to transform documents on their way to the new index (or indices)
- It should perform better, as you can add more filter threads (using the -w parameter) and multiple output worker threads (using the workers configuration option)
Show Me the Configuration!
In short, you’ll use the elasticsearch input to read existing data and the elasticsearch output to write it. In between, you can use various filters to change how documents look like.
Input
To read documents, you’ll use the elasticsearch input. You’ll probably want to specify the host(s) to connect to and the index (check the documentation for more options like query):
input {
  elasticsearch {
   hosts => ["localhost"]
   index => "old-index"
  }
}
By default, this will run a match_all query that does a scan through all the documents of the index, fetch pages of 1000, and times out in a minute (i.e. after a minute it won’t know where it left off). All this is configurable, but the defaults are sensible. Scan is good for deep paging (as normally when you fetch a page from 1000000 to 1000020, Elasticsearch fetches 1000020, sorts them, and gives back the last 20) and also works with a “snapshot” of the index (updates after the scan started won’t be taken into account).
Filter
Next, you might want to change documents in their way to the new index. For example, if the data you’re reindexing wasn’t originally indexed with Logstash, you probably want to remove the @version and/or @timestamp fields that are automatically added. To do that, you’ll use the mutate filter:
filter {
 mutate {
  remove_field => [ "@version" ]
 }
}
Output
Finally, you’ll use the elasticsearch output to send data to a new index. The defaults are once again geared towards the logging use-case. If this is not your setup, you might want to disable the default Logstash template (manage_template=false) and use yours:
output {
 elasticsearch {
   host => "localhost"
   protocol => "http"
   manage_template => false
   index => "new-index"
   index_type => "new-type"
   workers => 5
 }
}
Final Remarks
If you want to use time-based indices, you can change index to something like “logstash-%{+YYYY.MM.dd}” (this is the default), and the date would be taken from the @timestamp field. This is by default populated with the time Logstash processes the document, but you can use the date filter to replace it with a timestamp from the document itself:
filter {
 date {
   "match" => [ "custom_timestamp", "MM/dd/YYYY HH:mm:ss" ]
   target => "@timestamp"
 }
}
If your Logstash configuration contains only these snippets, it will nicely shut down when it’s done reindexing.
That’s it! We are happy answer questions or receive feedback – please drop us a line or get us @sematext. And, yes, we’re hiring!
Using Elasticsearch Mapping Types to Handle Different JSON Logs
By default, Elasticsearch does a good job of figuring the type of data in each field of your logs. But if you like your logs structured like we do, you probably want more control over how they’re indexed: is time_elapsed an integer or a float? Do you want your tags analyzed so you can search for big in big data? Or do you need it not_analyzed, so you can show top tags via the terms aggregation? Or maybe both?
In this post, we’ll look at how to use index templates to manage multiple types of logs across multiple indices. Also, we’ll explain how to use logging tools (such as Logstash and rsyslog) to handle JSON logging and specify types.
Elasticsearch Mapping and Logs
As you may already know, to control these things in Elasticsearch you’ll need to define a mapping. This works similarly in Logsene, our log analytics SaaS, because it uses Elasticsearch and exposes its API.
With logs you’ll probably use time-based indices, because they scale better (in Logsene, for instance, you get daily indices). That said, to make sure the mapping you define today applies to the index you create tomorrow, you need to define it in an index template.
Managing Multiple Types
Mappings provide a nice abstraction when you have to deal with multiple types of structured data. Let’s say you have two apps generating logs of different structures: both have a timestamp field, but one recording logins has a user field, and another one recording purchases has an amount field.
To deal with this, you can define the timestamp field in the _default_ mapping which applies to all types. Then, in each type’s own mapping we’ll define fields unique to that mapping. The following snippet is an example that works with Logsene, provided that aaaaaaaa-bbbb-cccc-dddd-eeeeeeeeeeee is your Logsene app token. If you roll your own Elasticsearch, you can use whichever name you want, and make sure the template applies to your index pattern.
curl -XPUT 'logsene-receiver.sematext.com/_template/aaaaaaaa-bbbb-cccc-dddd-eeeeeeeeeeee_MyTemplate' -d '{
 "template" : "aaaaaaaa-bbbb-cccc-dddd-eeeeeeeeeeee*",
 "order" : 21,
 "mappings" : {
  "_default_" : {
   "properties" : {
    "timestamp" : { "type" : "date" }
   }
  },
  "firstapp" : {
   "properties" : {
    "user" : { "type" : "string" }
   }
  },
  "secondapp" : {
   "properties" : {
    "amount" : { "type" : "long" }
   }
  }
 }
}'
Sending JSON Logs to Specific Types
When you send a document to Elasticsearch by using the API, you have to provide an index and a type. You can use an Elasticsearch client for your preferred language to log directly to Elasticsearch or Logsene this way. But I wouldn’t recommend this, because then you’d have to manage things like buffering if the destination is unreachable.
Instead, I’d keep my logging simple and use a specialized logging tool, such as Logstash or rsyslog to do the hard work for me. Logging to a file is usually the easiest option. It’s local, and you can have your logging tool tail the file and send contents over the network. I usually prefer sockets (like syslog) because they let me configure Logstash/rsyslog to:
– write events in a human format to a local file I can tail if I need to (usually in development)
– forward logs without hitting disk if I need to (usually in production)
Whatever you prefer, I think writing to local files or sockets is better than sending logs over the network from your application. Unless you’re willing to do a reliability trade-off and use UDP, which gets rid of most complexities.
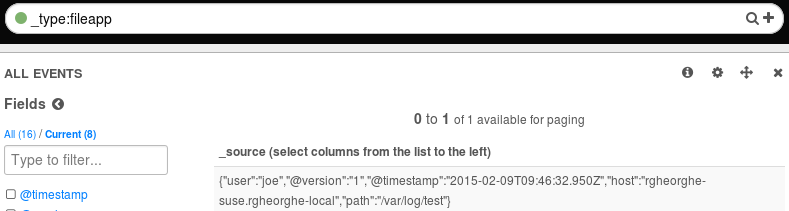
Opinions aside, here’s a Logstash configuration for tailing a file with JSON logs separated by a newline. Here’s how you’d send those documents to Logsene via the Elasticsearch API:
input {
 file {
 path => "/var/log/test"
 codec => "json"
 }
}

output {
 elasticsearch {
 host => "logsene-receiver.sematext.com"
 port => 80
 index => "LOGSENE-APP-TOKEN-GOES-HERE"
 index_type => "fileapp"
 protocol => "http"
 manage_template => false
 }
}
Note how the JSON codec does the parsing here, instead of the more expensive and maintenance-heavy approach with grok that we’ve shown in an earlier post on getting started with Logstash. Some applications let you configure the log format, so you can make them write JSON (Apache httpd, for example).
If you want to send JSON over syslog, there’s the JSON-over-syslog (CEE) format that we detailed in a previous post. You can use rsyslog’s JSON parser module to take your structured logs and forward them to Logsene:
module(load="imuxsock")        # can listen to local syslog socket
module(load="omelasticsearch") # can forward to Elasticsearch
module(load="mmjsonparse")     # can parse JSON

action(type="mmjsonparse")  # parse CEE-formatted messages

template(name="syslog-cee" type="list") {  # Elasticsearch documents will contain
  property(name="$!all-json")              # all JSON fields that were parsed
}

action(
  type="omelasticsearch"
  template="syslog-cee"                     # use the template defined earlier
  server="logsene-receiver.sematext.com"
  serverport="80"
  searchType="syslogapp"
  searchIndex="LOGSENE-APP-TOKEN-GOES-HERE"
  bulkmode="on"                                # send logs in batches
  queue.dequeuebatchsize="1000"                # of up to 1000
  action.resumeretrycount="-1"    # retry indefinitely (buffer) if destination is unreachable
)
To send a CEE-formatted syslog, you can run logger ‘@cee: {“amount”: 50}’ for example. Rsyslog would forward this JSON to Elasticsearch or Logsene via HTTP. Note that Logsene also supports CEE-formatted JSON over syslog out of the box if you want to use a syslog protocol instead of the Elasticsearch API.
Filtering by Type
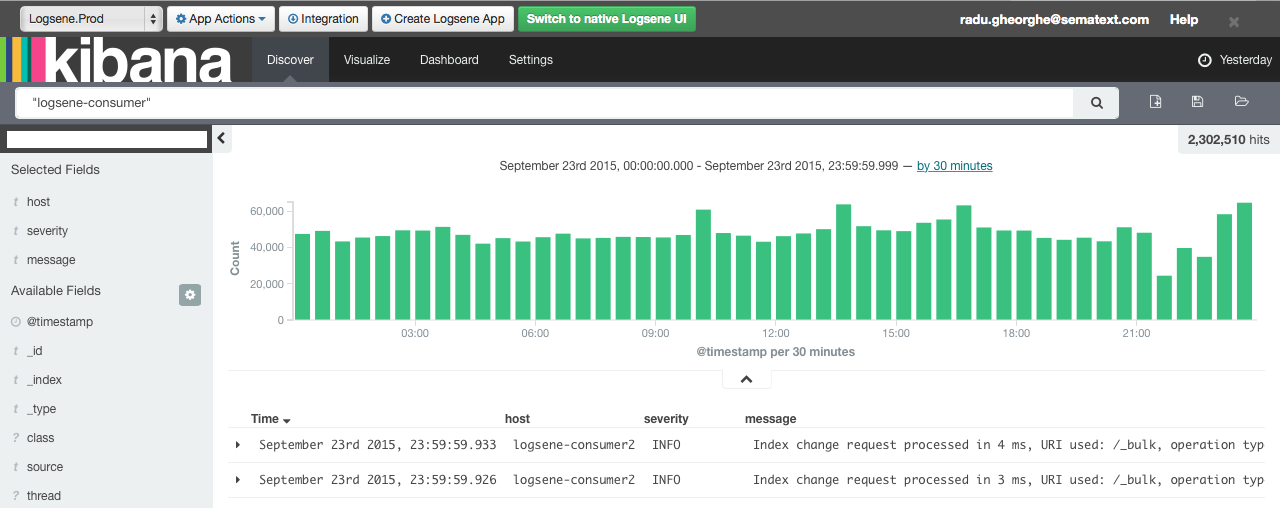
Once your logs are in, you can filter them by type (via the _type field) in Kibana:
However, if you want more refined filtering by source, we suggest using a separate field for storing the application name. This can be useful when you have different applications using the same logging format. For example, both crond and postfix use plain syslog.
If you’re looking for a place to send your logs to, check out Logsene!
Parsing and Centralizing Elasticsearch Logs with Logstash
No, it’s not an endless loop waiting to happen, the plan here is to use Logstash to parse Elasticsearch logs and send them to another Elasticsearch cluster or to a log analytics service like Logsene (which conveniently exposes the Elasticsearch API, so you can use it without having to run and manage your own Elasticsearch cluster).
If you’re looking for some ELK stack intro and you think you’re in the wrong place, try our 5-minute Logstash tutorial. Still, if you have non-trivial amounts of data, you might end up here again. Because you’ll probably need to centralize Elasticsearch logs for the same reasons you centralize other logs:
- to avoid SSH-ing into each server to figure out why something went wrong
- to better understand issues such as slow indexing or searching (via slowlogs, for instance)
- to search quickly in big logs
In this post, we’ll describe how to use Logstash’s file input to tail the main Elasticsearch log and the slowlogs. We’ll use grok and other filters to parse different parts of those logs into their own fields and we’ll send the resulting structured events to Logsene/Elasticsearch via the elasticsearch output. In the end, you’ll be able to do things like slowlog slicing and dicing with Kibana:

TL;DR note: scroll down to the FAQ section for the whole config with comments.
Continue reading “Parsing and Centralizing Elasticsearch Logs with Logstash”
Video and Slides: Centralized Logging with Logstash and Elasticsearch
Sematext engineer and Elasticsearch / Logstash expert Rafal Kuc gave a well-received talk at the recent DevOps Days Warsaw event. The talk was titled “From Zero to Hero – Centralized Logging with Logstash & Elasticsearch” and you can watch the video here:
And check out the slides here:
Brief Summary
Rafal talked about the common problem of digging through logs to find one particular event — or group of them. And going even further into this pain point — what if you have lots of servers and you don’t have a single place to look for logs? Do you really want to ssh to one or more servers and grep log files? Of course not! It’s 2014 and there are tools and services that help you spend less time hunting around for problems and more time actually fixing them.
To help solve this problem Rafal guided the audience through the basics of using Logstash and Elasticsearch together as the perfect combination for handling logs from multiple applications. Attendees also learned how to set up Logstash, how to configure it to parse logs and, finally, how to send them to an Elasticsearch cluster.
Rafal also discussed tuning Elasticsearch for log management and centralized logging purposes, and showed how to easily switch between shipping logs to a self-hosted solution like Elasticsearch / Logstash / Kibana (aka ELK) and instead ship logs to Logsene Log Management and Analytics by changing a single line in Logstash configuration.
See also:
- Getting Starting with Logstash in 5-minutes: Parsing and Sending a Log File
- Recipe: Rsyslog Elasticsearch Kibana
Enjoy! And thanks to everyone who attended Rafal’s talk in person and stopped by the Sematext booth.
