Logsene: Upgrade to Elasticsearch 2.2 and Kibana 4.3.1

Last week, we upgraded Logsene to Elasticsearch v2.2.0 including the required upgrade to Kibana 4.3.1.  This means you can benefit from Elasticsearch 2.2.0, Kibana 4.3.1 and the updated Logsene UI using Elasticsearch 2.x features. In addition, we migrated all existing data from Elasticsearch 1.7 to Elasticsearch 2.2, that’s why you might have noticed a slight delay in processing of logs recently.

There is a long list of “breaking changes” in Elasticsearch 2.x.  However, you won’t notice most of these changes – this is why it pays to use a managed service like Logsene 🙂  That said, a few of them, such as breaking changes in Elasticsearch Mapping (the “database schema”) will have an impact oh how logs should be structured before you ship them to Logsene:

  1. Elasticsearch 2.x does not accept documents containing Elasticsearch metadata field names. Field names starting with underscore (“_”) are reserved for Elasticsearch metadata and should not be used in indexed documents (e.g. _type, _id, _ttl, …). This means existing log shipper configurations, which generated such fields should be changed.
  2. Field names may not contain dots, e.g. “memory.free” is not a valid field name anymore. This must be changed to a JSON structure {“memory”: { “free”: 110234}}  or the field name needs a different separator e.g. “memory_free” instead of “memory.free”.

The good news:  Both cases are transparently handled for you in the current Logsene Receiver.  While Logsene handles this for you automatically, we strongly suggest you make the required changes.  Logsene detects malformed field names and renames them to valid field names in Elasticsearch. The automatic field renaming follows a simple method:
1) Remove leading underscores
2) Replace dots with underscores

Please check if your log data is affected by this change. Please change your log shipper configuration to avoid this time consuming pre-processing of your logs and take full control over the field names in your configuration.

If you use Sematext Docker Agent to ship logs, please use the latest version available on Docker Hub – it makes sure that the generated field names are compliant with Elasticsearch 2.x for all your containers logs.

Goodbye Kibana 3 and update to Kibana 4.3.1:

  • Kibana 3 is not supported anymore by Elastic and does not work with Elasticsearch 2.x. As a consequence we had to remove Kibana 3 from Logsene. We know that we have big fans of Kibana 3 out there, but maybe it’s time to move to Kibana 4 … or Grafana might be an alternative for you – check out  how to use Grafana with Logsene.
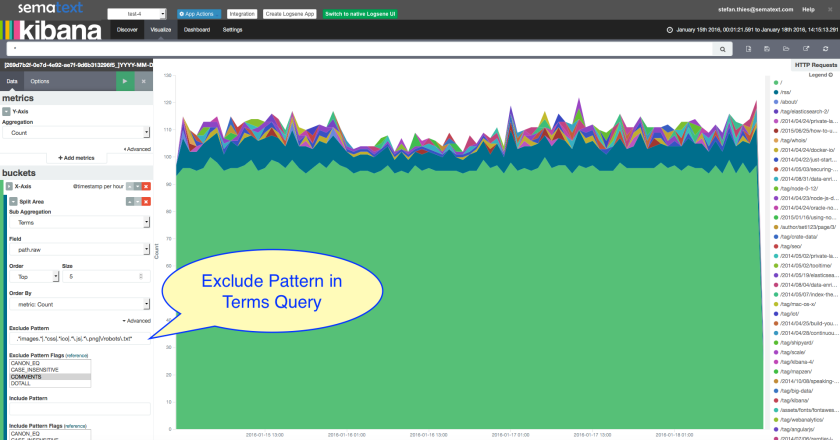
  • Kibana 4.3.1 is now the default Kibana application behind the “Kibana” button. Please note that we automatically changed all index patterns to match your Logsene applications. The new index-pattern are not based on date formats anymore (i.e. not TOKEN_YYYY-MM-DD any more), the new index-pattern is simply TOKEN_*. This works without timeouts because Kibana 4.3.1 improved time range queries.
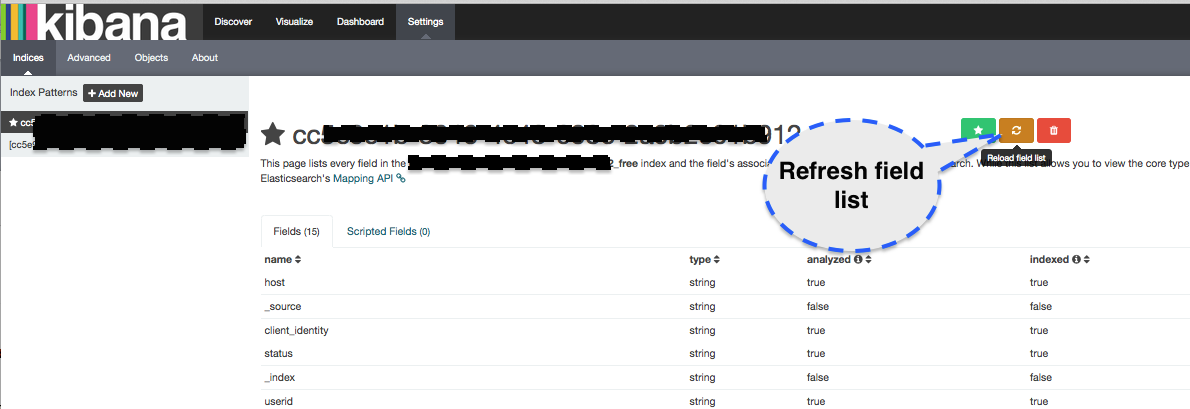
  • Having issues with the new Kibana? Most of the warning or error messages in Kibana are caused by outdated mapping information. Please check this first before you get in touch with support@sematext.com. To  refresh the mapping information open Kibana / Settings / Indices and press the orange “refresh” button:

refresh_fields_kibana4   

Questions or Feedback?

If you have any questions or feedback for us, please contact us by email or using live chat in Logsene.

How to Ship Heroku Logs to Logsene / Managed ELK Stack

Heroku is a cloud platform based on a managed container system, with integrated data services and a powerful ecosystem for deploying and running modern apps.  In this post we’ll show how you can ship logs from Heroku to Logsene, where you can then search your logs, get alerts based on log data, share log dashboards with your team, etc.

Watching Heroku logs in real-time in the terminal is easy using the “heroku logs” command, which is fine for ad-hoc log checks, but not for a serious production system.  For production, you want to collect, parse, and ship logs to a log management system, where rich reporting and troubleshooting can be done.  To do that the Heroku Log Drain setup is a must. What is a Heroku Log Drain and what does it do? In short, a Heroku Log Drain streams logs of your applications deployed on Heroku, either to a syslog or an HTTPS server.

When you have to deal with a large log volume a scalable log storage is required.  This is where Logsene comes into play. Logsene provides a hosted ELK Stack and is available On Premises and in the Cloud. Logagent-js is a smart log parser written in node.js, taking advantage of async I/O to receive, parse and ship logs – including routing different application logs to different full text indices. We made the Logagent-js deployment on Heroku very easy and scaling out for a very high log volume is just one “heroku scale web=N” command away.

Let’s have a look at the architecture of this setup:

  1. Heroku Apps configured with a Heroku Log Drain
  2. logagent-js to receive, parse and ship logs
  3. Logsene as backend to store all your logs


Step 1 – Create your Logsene App

If you don’t have a Logsene account already simply get a free account and create a Logsene App. This will get you a Logsene Application Token, which we’ll use in Step 3.

Step 2 – Deploy Logagent-js to Heroku

heroku-button.png

We’ve prepared a  “Deploy to Heroku” button – just click on it and enter a name for the deployed log agent in the Heroku UI:

heroku-screenshot

Remember this name because we’ll need it later as the URL for the Log Drain.
Logagent-js can handle multiple Logsene tokens, which means it could be used for more than 1 Logsene app, simply addressed by /LOGSENE_TOKEN in the URL.

To run a short test without deploying logagent-js feel free to use the one we deployed for demos with the name “logsene-test”, reachable via https://logsene-test.herokuapp.com.

Step 3 – Configure Log Drain for your App

To configure the Heroku Log Drain we need the following information:

  1. The Logsene App Token
  2. The URL for the deployed logagent-js (e.g. logsene-app1.herokuapp.com)
  3. The Heroku App ID or name of your Application on Heroku (e.g. web-app-1 in the example below)

Then we can use the Heroku command line tool, for example like this:

heroku drains:add –app web-app-1 https://logsene-app1.herokuapp.com/25560d7b-ef59-4345-xxx-xxx

Or we could use the Heroku API to activate the Log Drain:

curl -n -X POST https://api.heroku.com/apps/web-app-1/log-drains \
-d '{"url": "https://logsene-app1.herokuapp.com/25560d7b-ef59-4345-xxx-xxx"}' \
-H "Content-Type: application/json" \
-H "Accept: application/vnd.heroku+json; version=3"

Step 4 – Watch your Logs in Logsene

If you now access your App, Heroku should log your HTTP request and a few seconds later the logs will be visible in Logsene. And not in just any format!  You’ll see PERFECTLY STRUCTURED HEROKU LOGS:

heroku-logs-in-logsene.png

Enjoy!

Like what you saw here? To start with Logsene get a free account here or drop us an email, hit us on Twitter.  Logagent-js is open-source – if you find any bugs please create an issue on Github with suggestions, questions or comments.


Logagent-js – alternative to logstash, filebeat, fluentd, rsyslog?

What is the easiest way to parse, ship and analyze my web server logs? You should know that I’m a Node.js fan boy and not very thrilled with the idea of running a heavy process like Logstash on my low memory server, hosting my private Ghost Blog. I looked into Filebeat, a very light-weight log forwarder written in Go with an impressively low memory footprint of only a few MB, but Filebeat ships only unparsed log lines to Elasticsearch.  In other words, it sort of still needs Logstash to parse web server logs, which include many fields and numeric values!  Of course, structuring logs is essential for analytics.  The setup for rsyslog with elasticsearch and regex parsers is a bit more time consuming but very efficient compared to Logstash. Are there any better alternatives? Having a quick setup, well structured logs and a low memory footprint?

Guess what?  There is! Meet logagent-js – a log parser and shipper with log patterns for a number of popular log formats – from various Docker Images including Nginx, Apache, Linux and Mac system logs, to Elasticsearch, Redis, Solr, MongoDB and more. Logagent-js detects the log format automatically using the built-in pattern definitions (and also lets you provide your own, custom patterns).

Logagent-js includes a command line tool with default settings for Logsene as the Elasticsearch backend for storing the shipped logs.  Logsene is compatible with the Elasticsearch API, but can do much more, such as role-based access control, account sharing for DevOps teams,  ad-hoc charts in the Logsene UI, alerts on logs, and finally it integrates Kibana to ease the life of everybody dealing with log data!

Now let’s see what I run on my private blog site: logagent-js as single command to tail, parse and ship logs, all with less than 40 MB of RAM. Compare that to Logstash, which would not even start with just 40 MB of JVM heap.  Logagent-js can be installed as a command line tool with npm, which is included in Node.js (>0.12):

npm i logagent-js -g

Logagent-js needs only the Logsene Token as a parameter to ship logs to Logsene. When running it as a background process or daemon, it makes sense to limit the Node.js memory with  –max-old-space-size=60 to 100 MB, just in case.  Without such setting Node.js could consume more memory to improve performance in a long running process:

node --max-old-space-size=60 /usr/local/bin/logagent -s -t your-logsene-token-here logs/access_log &

You can also run logagent-js as upstart or systemd service, of course.

A few seconds after you start it you’ll see all your logs, parsed and structured into fields, with correct timestamps, numeric fields, etc., all without any additional configuration! A real gift and a huge time time saver for busy ops people!

Logsene-create-chart

Charting Logs

Next, let’s create some fancy charts with data from our logs. Logsene has ad-hoc charting functions (look for the little blue chart icons in the above screenshot) that let you draw Pie, Area, Line, Spline, Bar, and other types of charts. Logsene is smart and automatically provides chooses Pie charts to display distinct values and bar/line charts for numeric values over time.

Bildschirmfoto 2016-01-20 um 10.11.37

In the above screenshot we see the top viewed pages and the distribution of HTTP status codes.  We were able to generate these charts literally with just a few mouse clicks. The charts use the current query, so we could search for specific URLs and exclude e.g. images, stylesheets or traffic from robots using Logsene’s query language e.g. ‘NOT css AND NOT jpg AND NOT png AND NOT seoscanners’ or, more simply: -css -jpg -png -seoscanners).

Kibana Dashboards

If you prefer Kibana dashboards then you’ll need more complex Elasticsearch queries to remove Stylesheets, JavaScripts or other URLs from the top list. Open Kibana 4 in the Logsene UI and create a visualistaion to filter specific URLs – a ‘Terms Query’ can use regular expressions to Exclude and Include Filters.

Bildschirmfoto 2016-01-20 um 10.21.29

This visualization could be saved and added to a Kibana dashboard. If you know Kibana this takes a few minutes per visualization.  The result is a stored dashboard that could be shared with colleagues, which might not know how to create such dashboards.

Alert Me

The final thing I usually do is define alert queries e.g. to get notified about a growing number of HTTP error messages. For my private blog I use e-mail notifications, but Logsene integrates well with PagerDuty, HipChat, Slack or arbitrary WebHooks.

There are even more options like using Grafana with Logsene, or shipping logs automatically when using Docker.

Finally, a few more words about  logagent-js, which I consider a ‘swiss army knife’ for logs.  It integrates seamlessly with Logsene, while at the same time it can also work with other log destinations. It provides what I believe is a good compromise in terms of performance and setup time – I’d say it’s somewhere between rsyslog and logstash.

All tools for log processing require memory for this processing, but looking at the initial memory usage after starting the tools gives you an impression of the minimum resource usage.  Here are some numbers taking from my server:

Contributions to the pattern library for even more log formats are welcome – we are happy to help with additional log formats or input sources beside the existing inputs (standard input, file, Heroku, CloudFoundry and syslog UDP). Feel free to contact me @seti321 or @sematext to get up and running with your special setup!

If you don’t want to run and manage your own Elasticsearch cluster but would like to use Kibana for log and data analysis, then give Logsene a quick try by registering here – we do all the backend heavy lifting so you can focus on what you want to get out of your data and not on infrastructure.  There’s no commitment and no credit card required.  

We are happy to answer questions or receive feedback – please drop us a line or get us @sematext.

Slack Analytics & Search with Elasticsearch, Node.js and React

Sematext team is highly distributed. We are ex-Skype users who recently switched to Slack for team collaboration. We’ve been happy with Slack features and especially integrations for watching our Github repositories, Jenkins, or receiving SPM or Logsene Alerts from our production servers through their ChatOps support. The ability to add custom integrations is really awesome! Being search experts it is hard for us to accept any limitation in search functionality in tools we use. For example, I personally miss the ability to search over all teams and all channels and I really miss having no analytics on user activity or channel usage. Elasticsearch has become a popular data store for analytical queries.  What if we could take all Slack messages and index them into Elasticsearch? This would make it possible to perform advanced analytics with Kibana or Grafana, such as getting like top terms used, most active users or channels. Finally, a simple mobile web page to access only the indexed data from various Teams and Channels might be handy to have, too.

In this post we’re going to see how to build what we just described.  We’ll use the Slack API, Node.js, React and Elasticsearch in 3 steps:

  • Index Data from Slack
  • Analyse Data from Slack
  • Create a custom Web-App for searchslack-indexing-logsene.png

Index Data from Slack

The Slack API provides several ways to access data. For example, outgoing webhook. This looks useful at first, however, this needs a setup per channel or keywords as trigger. Then I discovered a better way – the Node.js Slack Client.  Simply log in with your Slack account and get all Slack messages! I wrote a little Node.js app to dump the relevant information as JSON to the console or to a file.  Having the JSON output, it can be piped to Logagent-js a smart log shipper written in Node.js. I packaged this as “slack-elasticsearch-indexer” so it’s super easy to run:

npm install slack-elasticsearch-indexer
# Set Elasticsearch Server, btw. the Logsene Receiver is the default
export LOGSENE_URL=https://logsene-receiver.sematext.com/_bulk
# 1 - Slack API Token from https://api.slack.com/web
# 2 - Index name or Logsene Token from https://apps.sematext.com
npm start SLACK_WEB_API_TOKEN LOGSENE_TOKEN

The LOGSENE_TOKEN is what you can get from Logsene – the “ELK log management service”.  Using Logsene means you don’t have to bother running your own Elasticsearch, plus the volume of most team’s Slack data is probably so small that it fits in Logsene’s free plan! 🙂

Once you run the above you should see new Slack Messages on the console.  At the same time the messages will also be sent to Logsene and you will see them in the Logsene UI (or your local Elasticsearch server or cluster) right away.

Analyze Slack Messages in Logsene

Now that our Slack messages are in Logsene we can build our Kibana Dashboards to visualize channel utilization, top terms, the chattiest people, and so on.  But … did you know, that Logsene comes with a nice ad-hoc charting function? Simply open one of the Slack messages in Logsene, and click on the little chart symbol in the field userName and channel (see below).

logsene-slack-search.png

This will very quickly render top users and channels for you:

slack-pie-charts.png

Slack Alerting

Imagine a support chat channel – wouldn’t it be nice to be notified when people start mentioning “Error”, “Problems” and “Broken” things increasingly frequently? This is where we can make use of Logsene Alerts and its ability to do anomaly detection. Any triggered alerts can be delivered via email, PagerDuty, Slack, HipChat or WebHooks:

logsene-alert-definition.png
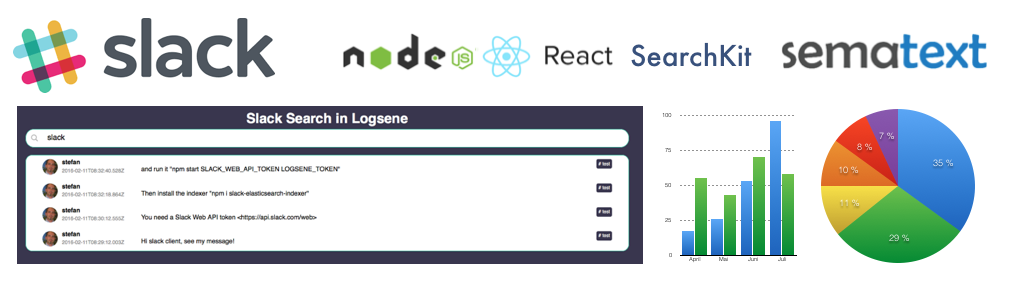
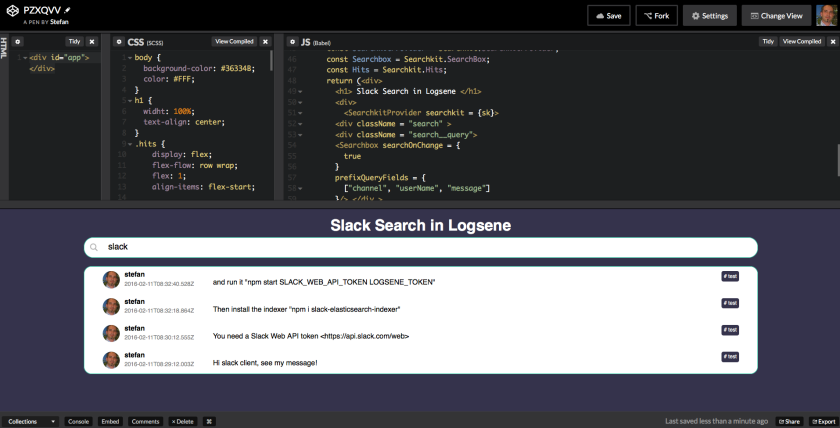
While Logsene is great for alerts, analytics and Slack message search, as a general ‘data viewer’ the message rendering in Logsene does not show application-specific things like users’ profile pictures, which would allow much faster recognition of user messages. Thus, as our next step, we’ll create a simple Web Client with nice rendering of indexed Slack messages. Let’s see how this can be done very quickly using some cutting edge Web technology together with Logsene.

Create a Custom Web-App for Search

We recently started using Facebook’s React.js for rendering of various UI parts like the views for Top Database Operations and we came across a new set of React UI Components for Elasticsearch called SearchKit. Thanks to Logsene’s Elasticsearch API SearchKit works out of the box with Logsene!
After a few lines of CSS and some JavaScript a simple Slack Search UI is born. Check it out!

searchkit-react.png

Edit the source code codepen.io

You just need to use your Logsene token as the Elasticsearch index name to run this app on your own data. For production we recommend adding a proxy to Elasticsearch (or Logsene) on the server side as described in the SearchKit UI documentation to hide connection details from the client application.

While this post shows how to index your Slack messages in Logsene for the purpose of archiving, searching, and analytics, we hope it also serves as an inspiration to build your own custom Search application with SearckKit, React, Node.js and Logsene?

If you haven’t used Logsene before, give it try – you can get a free account and have your logs and other event data in Logsene in no time. Drop us an email or hit us on Twitter with suggestions, questions or comments.


Sending your Windows Event Logs to Logsene using NxLog and Logstash

There are a lot of sources of logs these days. Some may come from mobile devices, some from your Linux servers used to host data, while other can be related to your Docker containers. They are all supported by Logsene. What’s more, you can also ship logs from your Microsoft Windows based hosts and visualize them using Logsene. In this blog post we’ll show how to send your Windows Event Logs to Logsene in a way that will let you build great visualizations and really see what is happening on your Windows-based systems.
Continue reading “Sending your Windows Event Logs to Logsene using NxLog and Logstash”

Using Filebeat to Send Elasticsearch Logs to Logsene

One of the nice things about our log management and analytics solution Logsene is that you can talk to it using various log shippers.  You can use Logstash, or you can use syslog protocol capable tools like rsyslog, or you can just push your logs using the Elasticsearch API just like you would to send data to a local Elasticsearch cluster. And like any good DevOps team, we like to play with all the tools ourselves.  So we thought the timing was right to make Logsene work as a final destination for data sent using Filebeat.

With that in mind, let’s see how to use Filebeat to send log files to Logsene.  In this post we’ll ship Elasticsearch logs, but Filebeat can tail and ship logs from any log file, of course.

Continue reading “Using Filebeat to Send Elasticsearch Logs to Logsene”

PagerDuty and Logsene Integration

Great news for for those of us who use PagerDuty and manage — or are considering managing — logs with Logsene: PagerDuty and Logsene are now integrated!

This integration is a huge time- and aggravation-saver for DevOps professionals who wouldn’t mind dramatically reducing the frequent “noise” from log-generated monitoring alarms.

In case you’re not familiar, Logsene is an enterprise-class log management solution. Logsene can receive logs from a wide array of logs shippers, such as Fluentd, Logstash, and Syslog, and supports many logging frameworks for programming languages such as: Java, Scala, Go, Node.js, Ruby, Python, .Net, Perl, and more.  Among other capabilities, Logsene exposes the Elasticsearch API, works with Kibana and with Grafana (video), and has built-in alerts and anomaly detection.  It is available both in the Cloud (SaaS) and On Premises.

Logsene also integrates with SPM Performance Monitoring to correlate metrics, events, and logs in a single UI (check out Integrate PagerDuty with SPM Performance Monitoring for those instructions, which are very similar to what you will see here).

In PagerDuty:

Create a new service:

1) In your account, go to Services click +Add New Service

2) Enter in a name for your new service

3) Start typing “Sematext” for the Integration Type, which will narrow your filtering

PagerDuty_image

4) Select an escalation policy. Then, adjust the incident settings to your liking, then click Add Service.

5) Once the service is created, you’ll be taken to the service page. On this page, you’ll see the Service Integration Key​, which you will need when you configure Sematext products to send events to PagerDuty. Copy the Service Integration Key to the clipboard.

PagerDuty_2

In Logsene

1) Navigate to App Actions of your Logsene App by clicking the App Settings menu item.

PagerDuty_3

2) Navigate to Alerts / PagerDuty

3) Enter the API key from PagerDuty in the field Service API key.

4) Press Save

PagerDuty_4

5) To enable PagerDuty Notifications, navigate to Alerts /Notification Transports

6) Select PagerDuty

PagerDuty_5

Done. Every alert from your Logsene app will be forwarded to PagerDuty, where you can manage escalation policies and configure notifications to other services like HipChat, Slack, Zapier, Flowdock, and more.

Like what you saw here? To integrate PagerDuty with Logsene just get a free account here!  And drop us an email or hit us on Twitter with suggestions, questions or comments.

How to forward CloudTrail (or other logs from AWS S3) to Logsene

This recipe shows how to send CloudTrail logs (which are .gz logs that AWS puts in a certain S3 bucket) to a Logsene application, but should apply to any kinds of logs that you put into S3. We’ll use AWS Lambda for this, but you don’t have to write the code. We’ve got that covered.

The main steps are:
0. Have some logs in an AWS S3 bucket 🙂
1. Create a new AWS Lambda function
2. Paste the code from this repository and fill in your Logsene Application Token
3. Point the function to your S3 bucket and give it permissions
4. Decide on the maximum memory to allocate for the function and the timeout for its execution
5. Explore your logs in Logsene 🙂

Continue reading “How to forward CloudTrail (or other logs from AWS S3) to Logsene”

Sematext Joins Docker’s ETP Program for Logging

Docker_ETP_Program_logo_squareSematext has just been recognized by Docker as an Ecosystem Technology Partner (ETP) for logging.  This designation indicates that Logsene has contributed to the logging driver and is available to users and organizations that seek solutions to capture logging data for monitoring their Dockerized distributed applications.

Log Management for Docker

“Sematext brings years of logging and monitoring expertise to the Docker community,” said Nick Stinemates, Head of Business Development and Technical Alliances at Docker.  “As an active participant in the Docker community, Sematext has provided logging solutions like Logsene and SPM for Docker, and contributed valuable user education and resources through informative webinars and blogs.”

Logsene & Docker

Logsene is a centralized logging, alerting and anomaly detection solution, available in the Cloud and On Premises.  Logsene delivers critical operational and business insights from data generated by Docker containers, applications and servers, and other devices.  Some DevOps engineers even think of Logsene as “ELK Stack on steroids.”  Logsene also integrates seamlessly with SPM, a performance monitoring, alerting and anomaly detection tool for Docker and many other platforms used by DevOps teams.

The following screenshot shows expanded views for Docker Events and Alerts (top), Container Logs (middle) and Container Metrics (bottom):

Docker_ETP_Container_CPU_annotation

Sematext SPM, showing Docker Events, Logs and Metrics

If you need more functionality to slice and dice logs then move to the Logsene UI shown below. The screenshot shows Container Log search (top) and detailed log messages tagged with container information and parsed fields (middle). Both the detail view in the middle and the Fields & Filters on the right side contain buttons to drill down into logs – e.g., to filter for the logs of a specific Docker Image or Docker Container.

Docker_ETP_Logsene_copy

Logsene User Interface – showing Docker log search, filtering options, log messages, & log events sorted by format

1-Minute Deployment in Tutum

One of the benefits of using SPM and Logsene for Docker monitoring, logging, and events is how easily they can be launched on Tutum.  It’s basically one minute: click-click-done!  For Docker users this means a single solution, a single container that captures not just logs or just metrics, but both container metrics and logs, plus Docker events, plus Docker host metrics and its logs.

Docker_ETP_Agent_Tutum_button

Sematext Docker Agent on Docker Hub

Sematext Docker Agent image is available on Docker Hub, and we shared the Tutum Stackfile for Sematext Docker Agent on Stackfiles.io – but the easiest way is to go via Sematext UI, which generates the stackfiles for you, including Application Tokens, as demonstrated in the video.

Docker_ETP_Tutum_create_stack

Sematext Docker Agent Stackfile in Tutum Cloud, ready to deploy

Docker’s ETP Program

Docker’s ETP program recognizes ecosystem partners like Sematext that have demonstrated integration with the Docker platform. As part of the program, Docker will highlight a capability area within the application lifecycle, validate integration and communicate the availability of the partner’s solution to the community and the market. The goal of the program is to ensure that logging tools like Logsene have been working with Docker to ensure the highest degree of availability and performance of distributed applications. Like the other partners in this program, Sematext has proven integration with the Docker platform and has demonstrated that Logsene is able to record logging data for dockerized applications.

“Sematext has been on the forefront of Docker monitoring, along with Docker event collection, charting and correlation with metrics,” said Otis Gospodnetić, Sematext’s Founder and CEO.  “So it was a natural next step to incorporate Docker logging via our Logsene log management solution.  The combination of SPM and Logsene not only allows for correlation of Docker metrics and logs, but also metrics and logs of applications running inside containers, along with anomaly detection and alerting. All this makes it much easier to troubleshoot performance and other issues much faster and with a lot less hassle than using more traditional or siloed solutions.”

Not using Logsene yet? Check out the free 30-day trial by registering here (ping us if you’re a startup, a non-profit, or educational institution – we’ve got special pricing for you!).  There’s no commitment and no credit card required.

Using Grafana with Elasticsearch for Log Analytics

Grafana is an open-source alternative to Kibana.  Grafana is best known as a visualization / dashboarding tool focused on graphing metrics from various data sources, such as InfluxDB. Even though Grafana started its life as a Kibana fork, it didn’t originally support using Elasticsearch as a Data Source.  Starting with version 2.5 Grafana added support for Elasticsearch as a Data Source — good news that we at Sematext got very excited about. Elasticsearch is typically not used to store pure metrics.  It is used more often for storing time series data like logs and other types of events (think IoT).  Grafana 2.5 was limited to the display of numerical values, but as of version 2.6 Grafana supports tabular display of textual data as well. Of course, most logs include numerical data, too, which means we can now use Grafana to render both logs and metrics from those logs stored in Logsene – perfect!

The Logsene API is compatible with Elasticsearch, which means you can use Grafana (from v2.6 and up) with your data in Logsene simply by using Grafana’s Elasticsearch Data Source and pointing it to Logsene. You only need to do two things:

  1. Create a Data Source
  2. Add a Table Panel to a Dashboard

Watch this short video to see Grafana and Logsene together in action:

We hope you like this new, alternative way to derive insight from your data in Logsene.  Got ideas how we could make it more useful for you?  Let us know via comments, email or @sematext.

Not using Logsene yet? Check out the free 30-day trial by registering here (ping us if you’re a startup, a non-profit, or educational institution – we’ve got special pricing for you!).  There’s no commitment and no credit card required.  Even better — combine Logsene with SPM to make the integration of performance metrics, logs, events and anomalies more robust for those looking for a single pane of glass.