Poll Results: Log Shipping Formats

The results for the log shipping formats poll are in.  Thanks to everyone who took the time to vote!

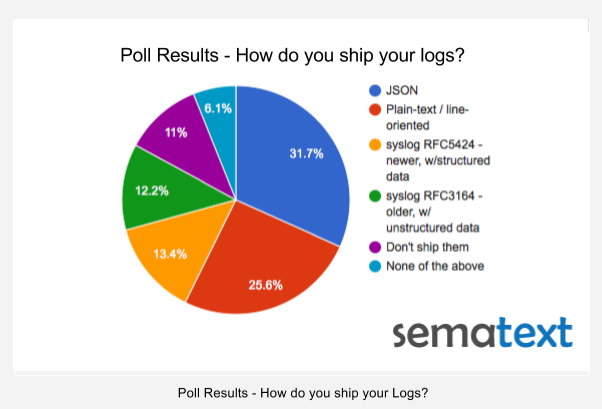
The distribution pie chart is below, but we can summarize it for you here:

  • JSON won pretty handily with 31.7% of votes, which was not totally unexpected. If anything, we expected to see more people shipping logs in JSON.  One person pointed out GELF, but GELF is really just specific JSON structure over Syslog/HTTP, so GELF falls in this JSON bucket, too.
  • Plain-text / line-oriented log shipping is still popular, clocking in with 25.6% of votes.  It would be interesting to see how that will change in the next year or two.  Any guesses?  For those who are using Logstash for shipping line-oriented logs, but have to deal with occasional multi-line log events, such as exception stack traces, we’ve blogged about how to ship multi-line logs with Logstash.
  • Syslog RFC5424 (the newer one, with structured data in it) barely edged out its older brother, RFC3164 (unstructured data).  Did this surprise anyone?  Maybe people don’t care for structured logs as much as one might think?  Well, structure is important, as we’ll show later today in our Docker Logging webinar because without it you’re limited to mostly “supergrepping” your logs, not really getting insight based on more analytical type of queries on your logs.  That said, the two syslog formats together add up to 25%!  Talk about ancient specs holding their ground against newcomers!
  • There are still some of people out there who aren’t shipping logs! That’s a bit scary! 🙂 Fortunately, there are lot of options available today, from the expensive On Premises Splunk or DIY ELK Stack, to the awesome Logsene, which is sort of like ELK Stack on steroids.  Look at log shipping info to see just how easy it is to get your logs off of your local disks, so you can stop grepping them.  If you can’t live without the console, you can always use logsene-cli!

Log_shipper_poll_4

Similarly, if your organization falls in the “Don’t ship them” camp (and maybe even “None of the above” as well, depending on what you are or are not doing) then — if you haven’t done so already — you should give some thought to trying a centralized logging service, whether running within your organization or a logging SaaS like Logsene, or at least DIY ELK.

Recipe: rsyslog + Redis + Logstash

OK, so you want to hook up rsyslog with Logstash. If you don’t remember why you want that, let me give you a few hints:

  • Logstash can do lots of things, it’s easy to set up but tends to be too heavy to put on every server
  • you have Redis already installed so you can use it as a centralized queue. If you don’t have it yet, it’s worth a try because it’s very light for this kind of workload.
  • you have rsyslog on pretty much all your Linux boxes. It’s light and surprisingly capable, so why not make it push to Redis in order to hook it up with Logstash?

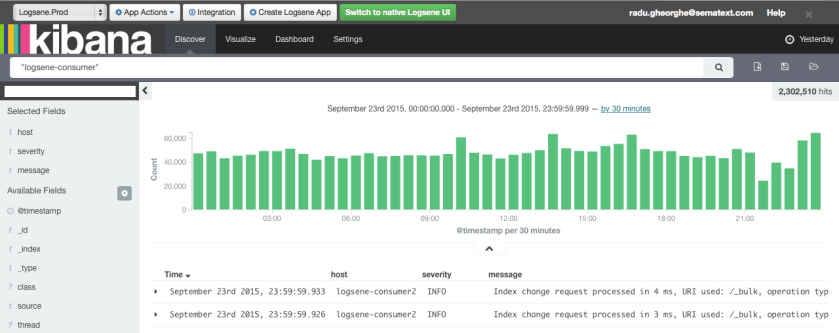
In this post, you’ll see how to install and configure the needed components so you can send your local syslog (or tail files with rsyslog) to be buffered in Redis so you can use Logstash to ship them to Elasticsearch, a logging SaaS like Logsene (which exposes the Elasticsearch API for both indexing and searching) so you can search and analyze them with Kibana:

Kibana_search

Continue reading “Recipe: rsyslog + Redis + Logstash”

Growing a Beard (or “How I wrote my first useful Node project”)

[Note: this post was written by Sematext engineer Marko Bonaći]

Stage setting: Camera is positioned above the treetop of one of three tall poplars. It looks down on the terrace of a pub. It’s evening, but there’s still enough light to see that the terrace is sparsely populated.

Camera slowly moves down towards a specific table in the corner…  

As the camera moves down, an old, crummy typewriter font appears on the screen, typing with distinct sound. It spells:

May 2015, somewhere in Germany…

The frame shows four adult males seating at the table. They sip their beers slowly, except for one of them. The camera focuses on him, as he hits a large German 1 liter pint in just two takes. On the table there’s a visible difference in the number of empty beer mugs in front of him and others. After a short silence, the heavy drinker says: (quickly, like he’s afraid that someone’s going to interrupt him, with facial expression like he’s in a confession):

“I still use grep to search through logs”.

As the sentence hit the eardrums of his buddies, a loud sound of overwhelming surprise involuntarily leaves their mouths. They notice that it made every guest turn to their table and the terrace fell into complete silence. The oldest one amongst them reacts quickly, like he wants no one to hear what he just heard, he turns towards the rest of the terrace and makes the hand waving motion, signaling that everything is fine. The sound of small talk and “excellent” German jokes once again permeates the terrace.

He, in fact, very well knew that it isn’t all fine. A burning desire to right this wrong grew somewhere deep within his chest. Camera focuses on this gentleman and starts to come increasingly closer to his chest.  When it hits the chest, {FX start} the camera enters inside, beneath the ribs. We see his heart pumping wildly. Camera goes even deeper, and enters the heart’s atrium, where we see buckets of blood leaving to quickly replenish the rest of the body in this moment of great need {FX end}.

The camera frame closes to a single point in the center the screen.

A couple of weeks later, we see a middle aged Croatian in his kitchen, whistling some unrecognized song while making Nescafe Creme and a secret Croatian vitamin drink called Cedevita.

Now camera shows him sitting at his desk and focuses on his face, “en face”.

He begins to tell his story…

“It was a warm Thursday, sometime in May 2015. My first week at Sematext was coming to end. I still remember, I was doing some local, on-ramping work, nothing remotely critical, when my boss asked me to leave everything aside. He had a new and exciting project for me. He allegedly found out that even the biggest proponent of centralized log management, Sematext, hides a person who still uses SSH+grep in its ranks.

The task was to design and implement an application that would let Logsene users access their logs from the command line (L-CLI from now on). I mentioned in my Sematext job interview that, besides Apache Spark (which was to be my main responsibility), I’d like to work with Node.js, if the opportunity presented itself. And here it was…”

What is Logsene?

Good thing you asked. Let me give you a bit of context, in case you don’t know what Logsene is. Logsene is a web application that’s used to find your way through piles of log messages. Our customers send us huge amounts of log messages, which are then collected into one of our Elasticsearch clusters (hereinafter ES). The system (built entirely out of open source components) is basically processing logs in near-real-time, so after the logs are safely stored and indexed in ES, they are immediately visible in Logsene. Here’s what the Logsene UI looks like:

Logsene_3

See those two large fields in the figure above? One for search query and the other for time range? Yes? Well, that was basically what my application needed to provide, only instead of web UI, users would use command-line interface.

Continue reading “Growing a Beard (or “How I wrote my first useful Node project”)”

Introducing Logsene CLI

[Note: this post was written by Sematext engineer Marko Bonaći]

In vino veritas, right?  During a recent team gathering in Kraków, Poland, and after several yummy bottles of țuică, vișinată, żubrówka, diluted with some beer, the truth came out – even though we run Logsene, a log management service that you can think of as hosted ELK Stack, some of us still ssh into machines and grep logs!  Whaaaaat!?  What happened to eating our own dog food!?  It turns out it’s still nice to be able to grep through logs, pipe to awk, sed, and friends.  But that’s broken or at least inefficient — what do you do when you run multiple machines in a cluster of have several clusters?  Kind of hard to grep all them logs, isn’t it?  In the new world of containers this is considered an anti-pattern!  We can do better!  We can fix that!

Introducing Logsene CLI

Meet Logsene CLI, a command line tool used to search through all your logs from all your apps and servers in Logsene — from the console! Logsene CLI gives you the best of both worlds:

  • have your logs off-site, in Logsene, where they will always be accessible and shareable with the team; and where you can visualize them, graph them, dashboard them, do anomaly detection on them, and get alerts on them
  • have a powerful command-line log search tool you can combine with your favorite Linux tools: awk, grep, cut, sed, sort, head, tail, less, etc.

Logsene CLI is a Node.js app written by a self-proclaimed Node fanboy who, through coding Logsene CLI, became a real Node man and in the process grew a beard.  The source code can be found on GitHub.

Logsene CLI in Action

Here is what Logsene’s Web UI looks like:

Logsene_3

See those two large input fields in the figure above — one for search query and the other for time range? Well, information that you’d normally enter via those fields is what Logsene CLI lets you enter, but from our beloved console.  Let’s have a look.

Initial Authentication

In order to use Logsene CLI, the only thing you need are your Sematext account credentials. When you run your first search, you’ll be prompted to authenticate and then you’ll choose the Logsene application you want to work with, as show below:

CLI_1

Usage Examples

Let’s start with a basic example using Web server logs.

Say we want to retrieve all log entries from the last two hours (limited to first 200 events, which can be controlled with the -s parameter):

$ logsene search -t 2h

CLI_2

Now let’s combine Logsene CLI and awk.  Say you want to find out the average response size during the last two hours.  Before we do that, let’s also tell Logsene CLI to give us all matching events, not just first 200 by using the –default-size configuration setting without parameter:

$ logsene config set --default-size

Note that the default size limit is always in effect, unless explicitly changed in the configuration, like we just did. When set like this, in the configuration, the –default-size setting applies to the remainder of the current Logsene CLI session (times out after 30 minutes of inactivity). The other option is to use the  -s parameter on a per-command basis, which works the same way, you either specify the maximum number of returned results or you just use -s without a quantifier to disable the limit altogether.

So back to average response time in the last two hours. You could do it like this:

$ logsene search -t 2h | awk 'BEGIN{sum=0;cnt=0}{sum+=$53;cnt++}END{print sum/cnt}'

CLI_3

There – with this one-liner you can see the average response size across all your web servers is 5557.1 bytes.

Next, let’s see how you’d combine log search/filtering with sort and head to get Top N reports, say five largest responses in the last two hours:

$ logsene search -t 2h | sort -nrk53 | head -n5

CLI_4

A little bit more realistic example — if your site were under a DoS attack, you might be interested in quickly seeing the top offenders.  Here’s a one-liner that shows how to use the -f switch to specify which field(s) to return – field host, in this example:

$ logsene search -t 10m -f host | sort | uniq -c | sort -r | head -n20

CLI_5

All examples so far were basically filtering by time.  Let’s actually search out logs!  Say you needed to get all versions of Chrome in the last 5 days:

$ logsene search Chrome -t 5d -f user_agent | \
sed 's/.*"user_agent": "\([^"]\+\).*/\1/g' | \
sed 's/.*Chrome[^0-9]\+\([0-9.]\+\).*/\1/' | sort | uniq

CLI_6

If you wanted to see the most popular versions of Chrome you’d just add count and sort.  Let’s also add line numbers:

$ logsene search Chrome -t 5d -f user_agent | \
sed 's/.*"user_agent": "\([^"]\+\).*/\1/g' | \
sed 's/.*Chrome[^0-9]\+\([0-9.]\+\).*/\1/' | sort | uniq -c | sort -nr | nl

CLI-7

We’ve used Web access log for examples so far, but you can certainly send any logs/events to Logsene and search them.

In the next example we search for logs that contain either or both phrases we specified and that were created between last Sunday morning and now.  Note that the “morning” part of the -t switch below translates to 06:00 (using whichever timezone your Logsene CLI is running in).  Let’s also return up to 300 results, instead of the default 200.

$ logsene search "signature that validated" "signature is valid" -t "last Sunday morning" -s 300

CLI_8

Note how this does an OR query by default.  Alternatively, you can use the -op AND switch to match only those logs that contain all given keywords or phrases.

Time Range Expressions

When searching through logs, it’s important to have a fine-grained time filtering capability.  Here’s a quick rundown through a few ways to specify time filters.

To retrieve last hour of logs, use search command without parameters:

logsene search

Remember, if you have more than 200 logs in the last hour this will show only the first 200 logs, unless you explicitly ask for more of them using the -s switch. If you don’t want to limit the output and simply display all available logs, just use -s without any quantifiers, like this:

logsene search -s

Note: when you specify time without a timezone Logsene CLI uses the timezone of the computer it’s running on. If you want to use UTC, all you need to do is append Z to a timestamp (e.g. 2015-06-30T16:50:00Z).

To retrieve the last 2 hours of logs:

logsene search -t 2h

To retrieve logs since a timestamp:

logsene search -t 2015-06-30T16:48:22

The next five commands show how to specify time ranges with the -t parameter. Logsene CLI recognizes ranges by examining whether the -t parameter value contains the forward slash character (ISO-8601).

To retrieve logs between two timestamps:

logsene search -t 2015-06-30T16:48:22/2015-06-30T16:50:00

To retrieve logs in the next 10 minutes from a timestamp:

logsene search -t 2015-06-30T16:48:22/+10m

To retrieve logs in the 10 minutes up to a timestamp:

logsene search -t 2015-06-30T16:48:22/-10

Minutes are used by default, so you can just omit m.

To retrieve logs from between 5 and 6 hours ago:

logsene search -t 6h/+1h

To retrieve logs from between 6 and 7 hours ago:

logsene search -t 6h/-1h

Fork, yeah!

You can try Logsene CLI even if you don’t already have Sematext account.  Opening a free, 30-day trial account is super simple. You’ll be set in less than 15 minutes to start playing with Logsene CLI. We won’t ask you for your credit card information (it’s not needed for a trial account, so why would we?).  Try it!

Signup_graphic

The Logsene CLI source code can be found on GitHub.

Please ping us back with your impressions, comments, suggestions, … anything really.  You can also reach us on Twitter @sematext, or the old-fashioned way, using e-mail.  And we would be exceptionally happy if you filed an issue or submitted a pull request on GitHub.  Enjoy!
Replaying Elasticsearch Slowlogs with Logstash and JMeter

Sometimes we just need to replay production queries – whether it’s because we want a realistic load test for the new version of a product or because we want to reproduce, in a test environment, a bug that only occurs in production (isn’t it lovely when that happens? Everything is fine in tests but when you deploy, tons of exceptions in your logs, tons of alerts from the monitoring system…).

With Elasticsearch, you can enable slowlogs to make it log queries taking longer (per shard) than a certain threshold. You can change settings on demand. For example, the following request will record all queries for test-index:

curl -XPUT localhost:9200/test-index/_settings -d '{
  "index.search.slowlog.threshold.query.warn" : "1ms"
}'

You can run those queries from the slowlog in a test environment via a tool like JMeter. In this post, we’ll cover how to parse slowlogs with Logstash to write only the queries to a file, and how to configure JMeter to run queries from that file on an Elasticsearch cluster.

Continue reading “Replaying Elasticsearch Slowlogs with Logstash and JMeter”

Log Alerting, Anomaly Detection and Scheduled Reports

Tired of tail -F /your/log/file | egrep -i ‘error|exception|warn’?
It’s common for devops to keep an eye out for errors in logs by running tail -F or to manually look for unusual application behavior by looking at logs in their terminal. The problem is that this gets tiring, boring — and even impossible — as the infrastructure grows.  If you think about this from the business perspective: it gets expensive.  Or maybe you automate things a bit via cron jobs that cat, grep, and mail errors, or maybe SSH to N remote servers to do that, etc.?  You can do this only for so long.  It doesn’t scale well.  It’s fragile.  Not the way to manage non-trivial infrastructure.

So what do you do?

First, consider using a centralized log management solution like Logsene instead of leaving log files on your file system. Alternatively, you can choose to run & maintain your own ELK stack, but then you won’t get what we are about to show you out of the box.

Saved, Alert & Scheduled Queries
We’ve created a 3-part blog series to detail the different types of Queries that Logsene lets you create:

  1. Saved Queries: queries that you’ve saved, so that you can later just execute them instead of writing them again
  2. Alert Queries: saved queries that are continuously running and that you configured to alert you when certain conditions are matched
  3. Scheduled Queries: queries that are executed periodically and that send you their output in a form of an log chart image

Put another way, using these queries means you can have Logsene’s servers do all the tedious work we mentioned above. That’s why we created computers in the first place, isn’t it?

It’s done in a few minutes, and how much time does it saves you every day?

So, how about that tail -F /my/log/file.log | egrep -i ‘error|exception|warn’ mentioned earlier? If you’re getting tired of tailing and grepping log files, sshing to multiple servers and chasing errors in them, try Logsene by registering here. If you are a young startup, a small or non-profit organization, or an educational institution, ask us for a discount (see special pricing)!

Saved Log Searches in Logsene

When digging through logs you might find yourself running the same searches again and again.  To solve this annoyance, Logsene lets you save queries so you can re-execute them quickly without having to retype them:

1) Enter your query and press the “disk” icon next to the search-textbox. Give your query a friendly Query Name and press the “save” button.

logsene-save-query-1

2) To run a Saved Query just click on it in the Search Queries pop-out window (see screenshot below). Existing Saved Queries can be edited or deleted, too:

logsene_saved_queries

Logsene tracks the history of recently used queries, so it’s easy to try several queries and finally save the one that worked best for your use case. That’s why you’ll find three tabs in the saved queries popup:

  1. Recent Queries – queries that you’ve recently used, you can save them using the save button
  2. Saved Queries – queries that you’ve saved, so that you can later just execute them instead of writing them again
  3. Alert Queries – saved queries that are continuously running and that you configured to alert you when certain conditions are matched

3-Part Blog Series about Log Queries

Speaking of log queries…this post is part of our 3-part blog series to detail the different types of Queries that Logsene lets you create.  Check out the other posts about Alert Queries and Scheduled Queries.

Does this sound like something you could use?

If so, simply sign up here – there’s no commitment and no credit card required.  Small startups, startups with no or very little outside investment money, non-profit and educational institutions get special pricing – just get in touch with us.  If you’d like to help us make SPM and Logsene even better, we are hiring!

5-Minute Recipe: Log Alerting and Anomaly Detection

Until software becomes so sophisticated that it becomes truly self-healing without human intervention it will remain important that we humans be notified of any problems with computing systems we run. This is especially true for large or distributed systems where it quickly becomes impossible to watch logs manually. A common practice is to watch performance metrics instead, centralize logs, and dig into logs only when performance problems are detected. If you use SPM Performance Monitoring already, you are used to defining alerts on critical metrics, and if you are a Logsene user you can now use alerting on logs, too! Here is how:

  1. Run your query in Logsene to search for relevant logs and press the “Save” button (see screenshot below)
  2. Mark the checkbox “Create Alert Query” and pick whether you want threshold-based or anomaly detection-based alerting:
Threshold-based alert in Logsene
logsene-alert-quiery-algolert
Anomaly Detection using “Algolerts” in Logsene
logsene-manage-alert-queries
Manage Alert Queries in Logsene

While alert creation dialog currently shows only email as a possible destination for alert notifications, you can actually have alert notifications sent to one or more other destinations.  To configure that go to “App Settings” as shown below:

logsene-go-to-app-settings

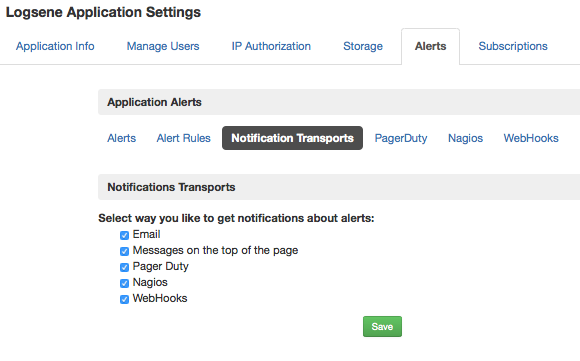
Once there, under “Notification Transport” you will see all available alert destinations:

Logsene-Application-Settings

In addition to email, PagerDuty, and Nagios, you can have alert notifications go to any WebHook you configure, including Slack and Hipchat.

How does one decide between Threshold-based and Anomaly Detection-based Alerts (aka Algolerts)?

The quick answers:

  • If you have a clear idea about how many logs should be matching a given Alert Query, then simply use threshold-based Alerts.
  • If you do not have a sense of how many matches a given Alert Query matches on a regular basis, but you want to watch out for sudden changes in volume, whether dips or spikes, use Algolerts (Anomaly Detection-based Alerts).

For more detailed explanations of Logsene alerts, see the FAQ on our Wiki.

3-Part Blog Series about Log Queries

Speaking of log queries…this post is part of our 3-part blog series to detail the different types of Queries that Logsene lets you create.  Check out the other posts about Saved Queries and Scheduled Queries.

Keep an eye on anomalies or other patterns in your logs

…by checking out Logsene. Simply sign up here – there’s no commitment and no credit card required.  Small startups, startups with no or very little outside investment money, non-profit and educational institutions get special pricing – just get in touch with us.  If you’d like to help us make SPM and Logsene even better, we are hiring

5-minute Recipe: Scheduled Queries for Log Reporting

In many cases just seeing an unexpected change in log volume is enough to make us want to check out logs to make sure everything is working correctly.  While seeing the general log volume is handy, wouldn’t it be even more useful to see the log volume of errors or exceptions being generated? Of course it would!  That’s what Alert Queries are for!  But what if you are not the DevOps person who needs to jump on problems as soon as they are discovered, but still want to keep an eye on systems for which you are responsible?  It would be nice to have all reports show up in your email every morning when you start work, wouldn’t it?  That’s why we implemented Scheduled Queries in Logsene.  Here’s how to set that up:

1) Define a query and select “Application Actions / Report Mailing”

logsene-report-mailig

2) Choose a Subscription Schedule and time range and save your settings.  You can choose to get reports delivered daily or weekly or … your choice!

logsene-report-mailing-subscription

It’s as simple as that!  For manager and anyone else who wants to keep an eye on the health and status of various systems, we think this is a welcome feature. Here’s a screenshot from one of our Scheduled Queries:

Logsene_Query_Apache_log

3-Part Blog Series about Log Queries

Speaking of log queries…this post is part of our 3-part blog series to detail the different types of Queries that Logsene lets you create.  Check out the other posts about Saved Queries and Alert Queries.

This takes just a minute to set up, and how much time does it save you every day?

If you’d like to easily schedule queries for log reporting, check out Logsene. Simply sign up here – there’s no commitment and no credit card required.  Small startups, startups with no or very little outside investment money, non-profit and educational institutions get special pricing – just get in touch with us.  If you’d like to help us make SPM and Logsene even better, we are hiring.

Get CoreOS Logs into ELK in 5 Minutes

Update: We have recently optimized the SPM setup on CoreOS and integrated a logging gateway to Logsene into the SPM Agent for Docker.  Please follow the setup instructions in Centralized Log Management and Monitoring for CoreOS Clusters


[ Note: Click here for the Docker Monitoring webinar video recording and slides. And click here for the Docker Logging webinar video recording and slides. ]

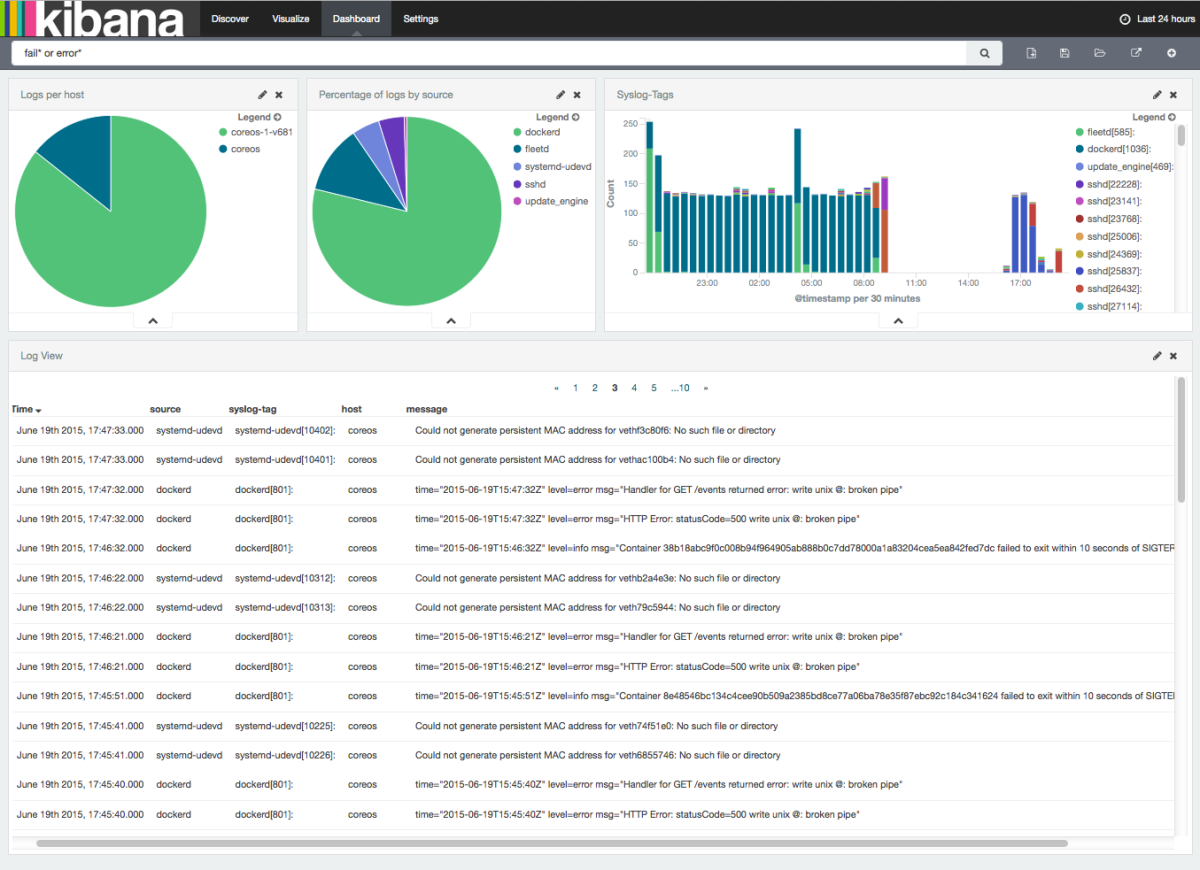
CoreOS Linux is the operating system for “Super Massive Deployments”.  We wanted to see how easily we can get CoreOS logs into Elasticsearch / ELK-powered centralized logging service. Here’s how to get your CoreOS logs into ELK in about 5 minutes, give or take.  If you’re familiar with CoreOS and Logsene, you can grab CoreOS/Logsene config files from Github. Here’s an example Kibana Dashboard you can get in the end:

CoreOS Kibana Dashboard

CoreOS is based on the following:

  • Docker and rkt for containers
  • systemd for startup scripts, and restarting services automatically
  • etcd as centralized configuration key/value store
  • fleetd to distribute services over all machines in the cluster. Yum.
  • journald to manage logs. Another yum.

Amazingly, with CoreOS managing a cluster feels a lot like managing a single machine!  We’ve come a long way since ENIAC!

There’s one thing people notice when working with CoreOS – the repetitive inspection of local or remote logs using “journalctl -M machine-N -f | grep something“.  It’s great to have easy access to logs from all machines in the cluster, but … grep? Really? Could this be done better?  Of course, it’s 2015!

Here is a quick example that shows how to centralize logging with CoreOS with just a few commands. The idea is to forward the output of “journalctl -o short” to Logsene‘s Syslog Receiver and take advantage of all its functionality – log searching, alerting, anomaly detection, integrated Kibana, even correlation of logs with Docker performance metrics — hey, why not, it’s all available right there, so we may as well make use of it all!  Let’s get started!

Preparation:

1) Get a list of IP addresses of your CoreOS machines

fleetctl list-machines

2) Create a new Logsene App (here)
3) Change the Logsene App Settings, and authorize the CoreOS host IP Addresses from step 1) (here’s how/where)

Congratulations – you just made it possible for your CoreOS machines to ship their logs to your new Logsene app!
Test it by running the following on any of your CoreOS machines:

journalctl -o short -f | ncat --ssl logsene-receiver-syslog.sematext.com 10514

…and check if the logs arrive in Logsene (here).  If they don’t, yell at us @sematext – there’s nothing better than public shaming on Twitter to get us to fix things. 🙂

Create a fleet unit file called logsene.service

[Unit]
Description=Logsene Log Forwarder

[Service]
Restart=always
RestartSec=10s
ExecStartPre=/bin/sh -c "if [ -n \"$(etcdctl get /sematext.com/logsene/`hostname`/lastlog)\" ]; then  echo \"Value Exists: /sematext.com/logsene/`hostname`/lastlog $(etcdctl get /sematext.com/logsene/`hostname`/lastlog)\"; else etcdctl set /sematext.com/logsene/`hostname`/lastlog\"`date +\"%Y-%%m-%d %%H:%M:%S\"`\"; true; fi"
ExecStart=/bin/sh -c "journalctl --since \"$(etcdctl get /sematext.com/logsene/`hostname`/lastlog)\" -o short -f | ncat --ssl logsene-receiver-syslog.sematext.com  10514"
ExecStopPost=/bin/sh -c "export D=\"`date +\"%Y-%%m-%%d %%H:%M:%S\"`\"; /bin/etcdctl set /sematext.com/logsene/$(hostname)/lastlog \"$D\""

[Install]
WantedBy=multi-user.target

[X-Fleet]
Global=true

Activate cluster-wide logging to Logsene with fleet

To start logging to Logsene from all machines activate logsene.service:

fleetctl load logsene.service
fleetctl start logsene.service

There.  That’s all there is to it!  Hope this worked for you!

At this point all your CoreOS logs should be going to Logsene.  Now you have a central place to see all your CoreOS logs.  If you want to send your app logs to Logsene, you can do that, too — anything that can send logs via Syslog or to Elasticsearch can also ship logs to Logsene. If you want some Docker containers & host monitoring to go with your CoreOS logs, just pull spm-agent-docker from Docker Registry.  Enjoy!