Using Filebeat to Send Elasticsearch Logs to Logsene

One of the nice things about our log management and analytics solution Logsene is that you can talk to it using various log shippers.  You can use Logstash, or you can use syslog protocol capable tools like rsyslog, or you can just push your logs using the Elasticsearch API just like you would to send data to a local Elasticsearch cluster. And like any good DevOps team, we like to play with all the tools ourselves.  So we thought the timing was right to make Logsene work as a final destination for data sent using Filebeat.

With that in mind, let’s see how to use Filebeat to send log files to Logsene.  In this post we’ll ship Elasticsearch logs, but Filebeat can tail and ship logs from any log file, of course.

Continue reading “Using Filebeat to Send Elasticsearch Logs to Logsene”

PagerDuty and Logsene Integration

Great news for for those of us who use PagerDuty and manage — or are considering managing — logs with Logsene: PagerDuty and Logsene are now integrated!

This integration is a huge time- and aggravation-saver for DevOps professionals who wouldn’t mind dramatically reducing the frequent “noise” from log-generated monitoring alarms.

In case you’re not familiar, Logsene is an enterprise-class log management solution. Logsene can receive logs from a wide array of logs shippers, such as Fluentd, Logstash, and Syslog, and supports many logging frameworks for programming languages such as: Java, Scala, Go, Node.js, Ruby, Python, .Net, Perl, and more.  Among other capabilities, Logsene exposes the Elasticsearch API, works with Kibana and with Grafana (video), and has built-in alerts and anomaly detection.  It is available both in the Cloud (SaaS) and On Premises.

Logsene also integrates with SPM Performance Monitoring to correlate metrics, events, and logs in a single UI (check out Integrate PagerDuty with SPM Performance Monitoring for those instructions, which are very similar to what you will see here).

In PagerDuty:

Create a new service:

1) In your account, go to Services click +Add New Service

2) Enter in a name for your new service

3) Start typing “Sematext” for the Integration Type, which will narrow your filtering

PagerDuty_image

4) Select an escalation policy. Then, adjust the incident settings to your liking, then click Add Service.

5) Once the service is created, you’ll be taken to the service page. On this page, you’ll see the Service Integration Key​, which you will need when you configure Sematext products to send events to PagerDuty. Copy the Service Integration Key to the clipboard.

PagerDuty_2

In Logsene

1) Navigate to App Actions of your Logsene App by clicking the App Settings menu item.

PagerDuty_3

2) Navigate to Alerts / PagerDuty

3) Enter the API key from PagerDuty in the field Service API key.

4) Press Save

PagerDuty_4

5) To enable PagerDuty Notifications, navigate to Alerts /Notification Transports

6) Select PagerDuty

PagerDuty_5

Done. Every alert from your Logsene app will be forwarded to PagerDuty, where you can manage escalation policies and configure notifications to other services like HipChat, Slack, Zapier, Flowdock, and more.

Like what you saw here? To integrate PagerDuty with Logsene just get a free account here!  And drop us an email or hit us on Twitter with suggestions, questions or comments.

How to forward CloudTrail (or other logs from AWS S3) to Logsene

This recipe shows how to send CloudTrail logs (which are .gz logs that AWS puts in a certain S3 bucket) to a Logsene application, but should apply to any kinds of logs that you put into S3. We’ll use AWS Lambda for this, but you don’t have to write the code. We’ve got that covered.

The main steps are:
0. Have some logs in an AWS S3 bucket 🙂
1. Create a new AWS Lambda function
2. Paste the code from this repository and fill in your Logsene Application Token
3. Point the function to your S3 bucket and give it permissions
4. Decide on the maximum memory to allocate for the function and the timeout for its execution
5. Explore your logs in Logsene 🙂

Continue reading “How to forward CloudTrail (or other logs from AWS S3) to Logsene”

Sematext Joins Docker’s ETP Program for Logging

Docker_ETP_Program_logo_squareSematext has just been recognized by Docker as an Ecosystem Technology Partner (ETP) for logging.  This designation indicates that Logsene has contributed to the logging driver and is available to users and organizations that seek solutions to capture logging data for monitoring their Dockerized distributed applications.

Log Management for Docker

“Sematext brings years of logging and monitoring expertise to the Docker community,” said Nick Stinemates, Head of Business Development and Technical Alliances at Docker.  “As an active participant in the Docker community, Sematext has provided logging solutions like Logsene and SPM for Docker, and contributed valuable user education and resources through informative webinars and blogs.”

Logsene & Docker

Logsene is a centralized logging, alerting and anomaly detection solution, available in the Cloud and On Premises.  Logsene delivers critical operational and business insights from data generated by Docker containers, applications and servers, and other devices.  Some DevOps engineers even think of Logsene as “ELK Stack on steroids.”  Logsene also integrates seamlessly with SPM, a performance monitoring, alerting and anomaly detection tool for Docker and many other platforms used by DevOps teams.

The following screenshot shows expanded views for Docker Events and Alerts (top), Container Logs (middle) and Container Metrics (bottom):

Docker_ETP_Container_CPU_annotation

Sematext SPM, showing Docker Events, Logs and Metrics

If you need more functionality to slice and dice logs then move to the Logsene UI shown below. The screenshot shows Container Log search (top) and detailed log messages tagged with container information and parsed fields (middle). Both the detail view in the middle and the Fields & Filters on the right side contain buttons to drill down into logs – e.g., to filter for the logs of a specific Docker Image or Docker Container.

Docker_ETP_Logsene_copy

Logsene User Interface – showing Docker log search, filtering options, log messages, & log events sorted by format

1-Minute Deployment in Tutum

One of the benefits of using SPM and Logsene for Docker monitoring, logging, and events is how easily they can be launched on Tutum.  It’s basically one minute: click-click-done!  For Docker users this means a single solution, a single container that captures not just logs or just metrics, but both container metrics and logs, plus Docker events, plus Docker host metrics and its logs.

Docker_ETP_Agent_Tutum_button

Sematext Docker Agent on Docker Hub

Sematext Docker Agent image is available on Docker Hub, and we shared the Tutum Stackfile for Sematext Docker Agent on Stackfiles.io – but the easiest way is to go via Sematext UI, which generates the stackfiles for you, including Application Tokens, as demonstrated in the video.

Docker_ETP_Tutum_create_stack

Sematext Docker Agent Stackfile in Tutum Cloud, ready to deploy

Docker’s ETP Program

Docker’s ETP program recognizes ecosystem partners like Sematext that have demonstrated integration with the Docker platform. As part of the program, Docker will highlight a capability area within the application lifecycle, validate integration and communicate the availability of the partner’s solution to the community and the market. The goal of the program is to ensure that logging tools like Logsene have been working with Docker to ensure the highest degree of availability and performance of distributed applications. Like the other partners in this program, Sematext has proven integration with the Docker platform and has demonstrated that Logsene is able to record logging data for dockerized applications.

“Sematext has been on the forefront of Docker monitoring, along with Docker event collection, charting and correlation with metrics,” said Otis Gospodnetić, Sematext’s Founder and CEO.  “So it was a natural next step to incorporate Docker logging via our Logsene log management solution.  The combination of SPM and Logsene not only allows for correlation of Docker metrics and logs, but also metrics and logs of applications running inside containers, along with anomaly detection and alerting. All this makes it much easier to troubleshoot performance and other issues much faster and with a lot less hassle than using more traditional or siloed solutions.”

Not using Logsene yet? Check out the free 30-day trial by registering here (ping us if you’re a startup, a non-profit, or educational institution – we’ve got special pricing for you!).  There’s no commitment and no credit card required.

Introducing Logsene Live Tail

We’ve been hard at work on our centralized logging SaaS / On-Premises solution – Logsene – and we’re confident the logging fans among us will enjoy the new Live Tail functionality.

Live Tail Benefits

Logsene Live Tail has several important benefits, including:

  • shows logs in real-time as they arrive into your Logsene app
  • lets you filter logs to only see those you’re most interested in (e.g., eliminate info logs which are high-volume, noisy and don’t contain critical information)
  • useful for deploying new software versions; see new errors right away and quickly go in and fix them

Live_Tail_4

Video

Logsene Live Tail is best seen, not told.  Check out this short video for a detailed look!

We hope you like this new addition to Logsene.  Got ideas how we could make it more useful for you?  Let us know via comments, email or @sematext.

Not using Logsene yet? Check out the free 30-day trial by registering here (ping us if you’re a startup, a non-profit, or educational institution – we’ve got special pricing for you!).  There’s no commitment and no credit card required.  Even better — combine Logsene with SPM to make the integration of performance metrics, logs, events and anomalies more robust for those looking for a single pane of glass.


Presentation: Large Scale Log Analytics with Solr

In this presentation from Lucene/Solr Revolution 2015, Sematext engineers — and Solr and centralized logging experts — Radu Gheorghe and Rafal Kuć talk about searching and analyzing time-based data at scale.

Documents ranging from blog posts and social media to application logs and metrics generated by smartwatches and other “smart” things share a similar pattern: timestamps among their fields, rarely changeable, and deletion when they become obsolete. Because this kind of data is so large it often causes scaling and performance challenges.

In this talk, Radu and Rafal focus on these challenges, including: properly designing collections architecture, indexing data fast and without documents waiting in queues for processing, being able to run queries that include time-based sorting and faceting on enormous amounts of indexed data (without killing Solr!), and many more.

Here is the video:

…and here are the slides:


Here’s a Taste of What You’ll See

How do Logstash, rsyslog, Redis, and fast-food-hating zombies (?!) relate? You’ll have to check out the presentation to find out…

LR_zombie_slide

Solr “One-stop Shop”

Sematext is your “one-stop shop” for all things Solr: Expert Consulting, Production Support, Solr Training, and Solr Monitoring with SPM.

Log Analytics – We Can Help

If your log analysis and management leave something to be desired, then we’ve got you covered there as well.  There’s our centralized logging solution, Logsene.  And we also offer Logging Consulting should you require more in-depth support.

Questions or Feedback?

If you have any questions or feedback for us, please contact us by email or hit us on Twitter.  We love talking Solr — and logs!


Presentation: Log Analysis with Elasticsearch

Fresh from the Velocity NYC conference is the latest presentation from Sematext engineers Rafal Kuć and Radu Gheorghe“From zero to production hero: Log Analysis with Elasticsearch.”

The talk goes through the basics of centralizing logs in Elasticsearch and all the strategies that make it scale with billions of documents in production. They cover:

  • Time-based indices and index templates to efficiently slice your data
  • Different node tiers to de-couple reading from writing, heavy traffic from low traffic
  • Tuning various Elasticsearch and OS settings to maximize throughput and search performance
  • Configuring tools such as logstash and rsyslog to maximize throughput and minimize overhead

Here is part 1 of the Video:

Here is part 2 of the Video:

Here are the slides:


And here are the Commands and Demo used in the presentation: https://github.com/sematext/velocity

Continue reading “Presentation: Log Analysis with Elasticsearch”

Docker Logging Webinar – Video and Slides

Docker Logging has been a very popular topic of late in our internal and external discussions.  So much so that we decided to hold webinars on the topic (and Docker Monitoring as well) and now we’re making them available to everyone.

The webinars were presented by Sematext’s DevOps Evangelist, Stefan Thies.  Stefan discussed Docker logging basics, including: the different log collection options Docker users have; the pros and cons of each option; specific and existing Docker logging solutions; log shipping to ELK Stack; and more.

Here is the video recording:

And here are the slides:

Docker Logging Resources:

Start Managing Docker Logs Now (Monitoring, too!)

Once you’ve checked out some of the Docker content sign up for a free 30-day trial (no credit card required) of Logsene or request a demo to see how easy it is to get up and running.

There’s a good chance you will also like SPM, our performance monitoring solution, that, like Logsene, offers alerting and anomaly detection on top of all the other benefits.  We’re even offering a 20% discount on SPM and Logsene to webinar viewers.  Just use these codes when creating new SPM and Logsene apps:

  • SPM: 201509WNR20S
  • Logsene: 201509WNR20L

Docker Monitoring Webinar & Slides

Speaking of metrics…for those of you with an interest in Docker Monitoring, we held a webinar on that subject as well. Click here to access the webinar video recording and slides.

Questions or Feedback?

If any questions have come up since the webinar, or if you have some feedback for us, please contact us by email or hit us on Twitter.

Recipe: rsyslog + Kafka + Logstash

This recipe is similar to the previous rsyslog + Redis + Logstash one, except that we’ll use Kafka as a central buffer and connecting point instead of Redis. You’ll have more of the same advantages:

  • rsyslog is light and crazy-fast, including when you want it to tail files and parse unstructured data (see the Apache logs + rsyslog + Elasticsearch recipe)
  • Kafka is awesome at buffering things
  • Logstash can transform your logs and connect them to N destinations with unmatched ease

There are a couple of differences to the Redis recipe, though:

  • rsyslog already has Kafka output packages, so it’s easier to set up
  • Kafka has a different set of features than Redis (trying to avoid flame wars here) when it comes to queues and scaling

As with the other recipes, I’ll show you how to install and configure the needed components. The end result would be that local syslog (and tailed files, if you want to tail them) will end up in Elasticsearch, or a logging SaaS like Logsene (which exposes the Elasticsearch API for both indexing and searching). Of course you can choose to change your rsyslog configuration to parse logs as well (as we’ve shown before), and change Logstash to do other things (like adding GeoIP info).

Getting the ingredients

First of all, you’ll probably need to update rsyslog. Most distros come with ancient versions and don’t have the plugins you need. From the official packages you can install:

If you don’t have Kafka already, you can set it up by downloading the binary tar. And then you can follow the quickstart guide. Basically you’ll have to start Zookeeper first (assuming you don’t have one already that you’d want to re-use):

bin/zookeeper-server-start.sh config/zookeeper.properties

And then start Kafka itself and create a simple 1-partition topic that we’ll use for pushing logs from rsyslog to Logstash. Let’s call it rsyslog_logstash:

bin/kafka-server-start.sh config/server.properties
bin/kafka-topics.sh --create --zookeeper localhost:2181 --replication-factor 1 --partitions 1 --topic rsyslog_logstash

Finally, you’ll have Logstash. At the time of writing this, we have a beta of 2.0, which comes with lots of improvements (including huge performance gains of the GeoIP filter I touched on earlier). After downloading and unpacking, you can start it via:

bin/logstash -f logstash.conf

Though you also have packages, in which case you’d put the configuration file in /etc/logstash/conf.d/ and start it with the init script.

Configuring rsyslog

With rsyslog, you’d need to load the needed modules first:

module(load="imuxsock")  # will listen to your local syslog
module(load="imfile")    # if you want to tail files
module(load="omkafka")   # lets you send to Kafka

If you want to tail files, you’d have to add definitions for each group of files like this:

input(type="imfile"
  File="/opt/logs/example*.log"
  Tag="examplelogs"
)

Then you’d need a template that will build JSON documents out of your logs. You would publish these JSON’s to Kafka and consume them with Logstash. Here’s one that works well for plain syslog and tailed files that aren’t parsed via mmnormalize:

template(name="json_lines" type="list" option.json="on") {
  constant(value="{")
  constant(value="\"timestamp\":\"")
  property(name="timereported" dateFormat="rfc3339")
  constant(value="\",\"message\":\"")
  property(name="msg")
  constant(value="\",\"host\":\"")
  property(name="hostname")
  constant(value="\",\"severity\":\"")
  property(name="syslogseverity-text")
  constant(value="\",\"facility\":\"")
  property(name="syslogfacility-text")
  constant(value="\",\"syslog-tag\":\"")
  property(name="syslogtag")
  constant(value="\"}")
}

By default, rsyslog has a memory queue of 10K messages and has a single thread that works with batches of up to 16 messages (you can find all queue parameters here). You may want to change:
– the batch size, which also controls the maximum number of messages to be sent to Kafka at once
– the number of threads, which would parallelize sending to Kafka as well
– the size of the queue and its nature: in-memory(default), disk or disk-assisted

In a rsyslog->Kafka->Logstash setup I assume you want to keep rsyslog light, so these numbers would be small, like:

main_queue(
  queue.workerthreads="1"      # threads to work on the queue
  queue.dequeueBatchSize="100" # max number of messages to process at once
  queue.size="10000"           # max queue size
)

Finally, to publish to Kafka you’d mainly specify the brokers to connect to (in this example we have one listening to localhost:9092) and the name of the topic we just created:

action(
  broker=["localhost:9092"]
  type="omkafka"
  topic="rsyslog_logstash"
  template="json"
)

Assuming Kafka is started, rsyslog will keep pushing to it.

Configuring Logstash

This is the part where we pick the JSON logs (as defined in the earlier template) and forward them to the preferred destinations. First, we have the input, which will use to the Kafka topic we created. To connect, we’ll point Logstash to Zookeeper, and it will fetch all the info about Kafka from there:

input {
  kafka {
    zk_connect => "localhost:2181"
    topic_id => "rsyslog_logstash"
  }
}

At this point, you may want to use various filters to change your logs before pushing to Logsene or Elasticsearch. For this last step, you’d use the Elasticsearch output:

output {
  elasticsearch {
    hosts => "logsene-receiver.sematext.com:443" # it used to be "host" and "port" pre-2.0
    ssl => "true"
    index => "your Logsene app token goes here"
    manage_template => false
    #protocol => "http" # removed in 2.0
    #port => "443" # removed in 2.0
  }
}

And that’s it! Now you can use Kibana (or, in the case of Logsene, either Kibana or Logsene’s own UI) to search your logs!

Recipe: Apache Logs + rsyslog (parsing) + Elasticsearch

More than two years ago we posted a recipe on how to centralize syslog in Elasticsearch in order to search and analyze them with Kibana, all by using only rsyslog. This works well, because rsyslog is fast and light, as we shown in later posts and recent presentations.

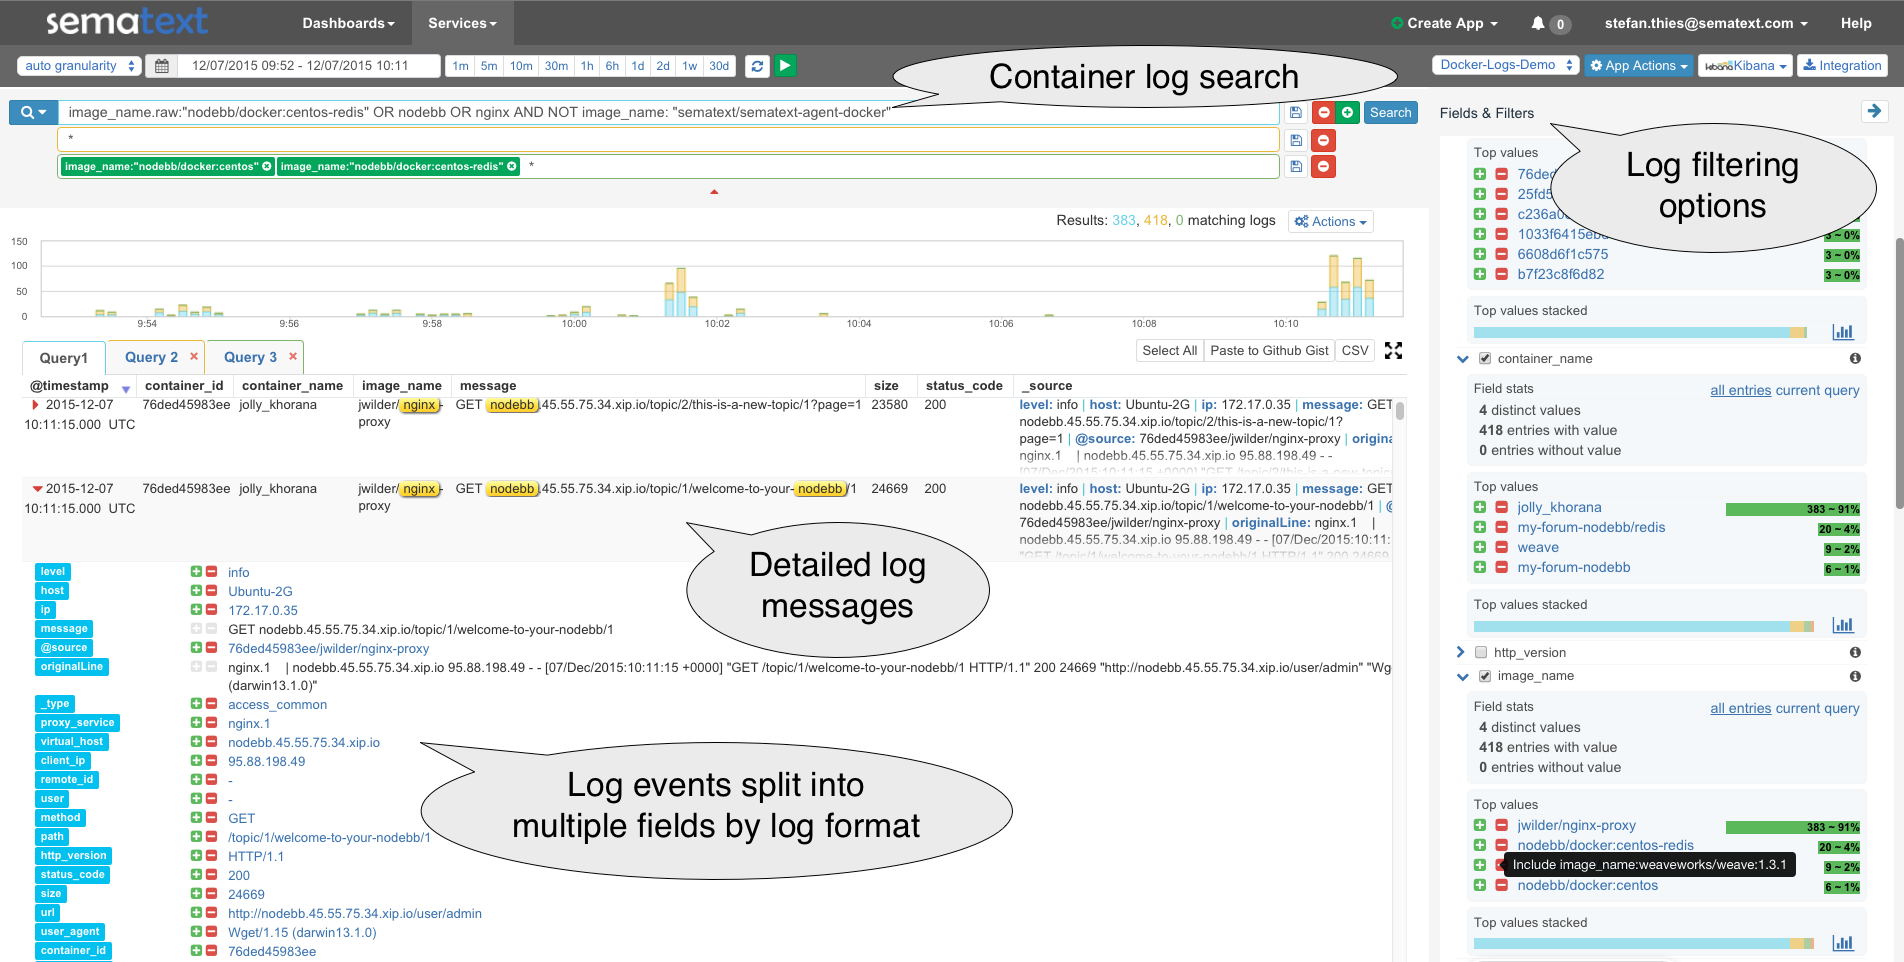
This recipe is about tailing Apache HTTPD logs with rsyslog, parsing them into structured JSON documents, and forwarding them to Elasticsearch (or our log analytics SaaS, Logsene, which exposes the Elasticsearch API). Having them indexed in a structured way will allow you to do better analytics with tools like Kibana:

Kibana_screenshot

We’ll also cover pushing system logs and how to buffer them properly, so it’s an updated, more complete recipe compared to the old one.

Getting the ingredients

Even though most distros already have rsyslog installed, it’s highly recommended to get the latest stable from the rsyslog repositories. This way you’ll benefit from the last two to five years of development (depending on how conservative your distro is). The packages you’ll need are:

With the ingredients in place, let’s start cooking a configuration. The configuration needs to do the following:

  • load the required modules
  • configure inputs: tailing Apache logs and system logs
  • configure the main queue to buffer your messages. This is also the place to define the number of worker threads and batch sizes (which will also be Elasticsearch bulk sizes)
  • parse common Apache logs into JSON
  • define a template where you’d specify how JSON messages would look like. You’d use this template to send logs to Logsene/Elasticsearch via the Elasticsearch output

Loading modules

Here, we’ll need imfile to tail files, mmnormalize to parse them, and omelasticsearch to send them. If you want to tail the system logs, you’d also need to include imuxsock and imklog (for kernel logs).

# system logs
module(load="imuxsock")
module(load="imklog")
# file
module(load="imfile")
# parser
module(load="mmnormalize")
# sender
module(load="omelasticsearch")

Configure inputs

For system logs, you typically don’t need any special configuration (unless you want to listen to a non-default Unix Socket). For Apache logs, you’d point to the file(s) you want to monitor. You can use wildcards for file names as well. You also need to specify a syslog tag for each input. You can use this tag later for filtering.

input(type="imfile"
      File="/var/log/apache*.log"
      Tag="apache:"
)

NOTE: By default, rsyslog will not poll for file changes every N seconds. Instead, it will rely on the kernel (via inotify) to poke it when files get changed. This makes the process quite realtime and scales well, especially if you have many files changing rarely. Inotify is also less prone to bugs when it comes to file rotation and other events that would otherwise happen between two “polls”. You can still use the legacy mode=”polling” by specifying it in imfile’s module parameters.

Queue and workers

By default, all incoming messages go into a main queue. You can also separate flows (e.g. files and system logs) by using different rulesets but let’s keep it simple for now.

For tailing files, this kind of queue would work well:

main_queue(
  queue.workerThreads="4"
  queue.dequeueBatchSize="1000"
  queue.size="10000"
)

This would be a small in-memory queue of 10K messages, which works well if Elasticsearch goes down, because the data is still in the file and rsyslog can stop tailing when the queue becomes full, and then resume tailing. 4 worker threads will pick batches of up to 1000 messages from the queue, parse them (see below) and send the resulting JSONs to Elasticsearch.

If you need a larger queue (e.g. if you have lots of system logs and want to make sure they’re not lost), I would recommend using a disk-assisted memory queue, that will spill to disk whenever it uses too much memory:

main_queue(
  queue.workerThreads="4"
  queue.dequeueBatchSize="1000"
  queue.highWatermark="500000"    # max no. of events to hold in memory
  queue.lowWatermark="200000"     # use memory queue again, when it's back to this level
  queue.spoolDirectory="/var/run/rsyslog/queues"  # where to write on disk
  queue.fileName="stats_ruleset"
  queue.maxDiskSpace="5g"        # it will stop at this much disk space
  queue.size="5000000"           # or this many messages
  queue.saveOnShutdown="on"      # save memory queue contents to disk when rsyslog is exiting
)

Parsing with mmnormalize

The message normalization module uses liblognorm to do the parsing. So in the configuration you’d simply point rsyslog to the liblognorm rulebase:

action(type="mmnormalize"
  rulebase="/opt/rsyslog/apache.rb"
)

where apache.rb will contain rules for parsing apache logs, that can look like this:

version=2

rule=:%clientip:word% %ident:word% %auth:word% [%timestamp:char-to:]%] "%verb:word% %request:word% HTTP/%httpversion:float%" %response:number% %bytes:number% "%referrer:char-to:"%" "%agent:char-to:"%"%blob:rest%

Where version=2 indicates that rsyslog should use liblognorm’s v2 engine (which is was introduced in rsyslog 8.13) and then you have the actual rule for parsing logs. You can find more details about configuring those rules in the liblognorm documentation.

Besides parsing Apache logs, creating new rules typically requires a lot of trial and error. To check your rules without messing with rsyslog, you can use the lognormalizer binary like:

head -1 /path/to/log.file | /usr/lib/lognorm/lognormalizer -r /path/to/rulebase.rb -e json

NOTE: If you’re used to Logstash’s grok, this kind of parsing rules will look very familiar. However, things are quite different under the hood. Grok is a nice abstraction over regular expressions, while liblognorm builds parse trees out of specialized parsers. This makes liblognorm much faster, especially as you add more rules. In fact, it scales so well, that for all practical purposes, performance depends on the length of the log lines and not on the number of rules. This post explains the theory behind this assuption, and there are already some preliminary tests to prove it as well (some of which we’ll present at Lucene Revolution). The downside is that you’ll lose some of the flexibility offered by regular expressions. You can still use regular expressions with liblognorm (you’d need to set allow_regex to on when loading mmnormalize) but then you’d lose a lot of the benefits that come with the parse tree approach.

Templates and actions

If you’re using rsyslog only for parsing Apache logs (and not system logs) and send your logs to Logsene, this bit is rather simple. Because by the time parsing ended, you already have all the relevant fields in the $!all-json variable, that you’ll use as a template:

template(name="all-json" type="list"){
  property(name="$!all-json")
}

Then you an use this template to send logs to Logsene via the Elasticsearch API and using your Logsene application token as the index name:

action(type="omelasticsearch"
  template="all-json"  # use the template defined earlier
  searchIndex="LOGSENE-APP-TOKEN-GOES-HERE"
  searchType="apache"
  server="logsene-receiver.sematext.com"
  serverport="80"
  bulkmode="on"  # use the bulk API
  action.resumeretrycount="-1"  # retry indefinitely if Logsene/Elasticsearch is unreachable
)

Putting both Apache and system logs together

Finally, if you use the same rsyslog to parse system logs, mmnormalize won’t parse them (because they don’t match Apache’s common log format). In this case, you’ll need to pick the rsyslog properties you want and build an additional JSON template:

template(name="plain-syslog"
  type="list") {
    constant(value="{")
      constant(value="\"timestamp\":\"")     property(name="timereported" dateFormat="rfc3339")
      constant(value="\",\"host\":\"")        property(name="hostname")
      constant(value="\",\"severity\":\"")    property(name="syslogseverity-text")
      constant(value="\",\"facility\":\"")    property(name="syslogfacility-text")
      constant(value="\",\"tag\":\"")   property(name="syslogtag" format="json")
      constant(value="\",\"message\":\"")    property(name="msg" format="json")
    constant(value="\"}")
}

Then you can make rsyslog decide: if a log was parsed successfully, use the all-json template. If not, use the plain-syslog one:

if $parsesuccess == "OK" then {
 action(type="omelasticsearch"
  template="all-json"
  ...
 )
} else {
 action(type="omelasticsearch"
  template="plain-syslog"
  ...
 )
}

And that’s it! Now you can restart rsyslog and get both your system and Apache logs parsed, buffered and indexed into Logsene. If you rolled your own Elasticsearch cluster, there’s one more step on the rsyslog side.

Time-based indices in your own Elasticsearch cluster

Logsene uses time-based indices out of the box, but in a local setup you’ll need to do this yourself. Such a design will give your cluster a lot more capacity due to the way Elasticsearch merges data in the background (we covered this in detail in our presentations at GeeCON and Berlin Buzzwords).

To make rsyslog use daily or other time-based indices, you need to define a template that builds an index name off the timestamp of each log. This is one that names them logstash-YYYY.MM.DD, like Logstash does by default:

template(name="logstash-index"
  type="list") {
    constant(value="logstash-")
    property(name="timereported" dateFormat="rfc3339" position.from="1" position.to="4")
    constant(value=".")
    property(name="timereported" dateFormat="rfc3339" position.from="6" position.to="7")
    constant(value=".")
    property(name="timereported" dateFormat="rfc3339" position.from="9" position.to="10")
}

And then you’d use this template in the Elasticsearch output instead of a static index name (this also requires setting dynSearchIndex to on):

action(type="omelasticsearch"
  template="all-json"
  dynSearchIndex="on"
  searchIndex="logstash-index"
  searchType="apache"
  server="MY-ELASTICSEARCH-SERVER"
  bulkmode="on"
  action.resumeretrycount="-1"
)

And now you’re really done, at least as far as rsyslog is concerned. For tuning Elasticsearch, have a look at our GeeCON and Berlin Buzzwords presentations. If you have additional questions, please let us know in the comments. And if you find this topic exciting, we’re happy to let you know that we’re hiring worldwide.