How to Ship Heroku Logs to Logsene / Managed ELK Stack

Heroku is a cloud platform based on a managed container system, with integrated data services and a powerful ecosystem for deploying and running modern apps.  In this post we’ll show how you can ship logs from Heroku to Logsene, where you can then search your logs, get alerts based on log data, share log dashboards with your team, etc.

Watching Heroku logs in real-time in the terminal is easy using the “heroku logs” command, which is fine for ad-hoc log checks, but not for a serious production system.  For production, you want to collect, parse, and ship logs to a log management system, where rich reporting and troubleshooting can be done.  To do that the Heroku Log Drain setup is a must. What is a Heroku Log Drain and what does it do? In short, a Heroku Log Drain streams logs of your applications deployed on Heroku, either to a syslog or an HTTPS server.

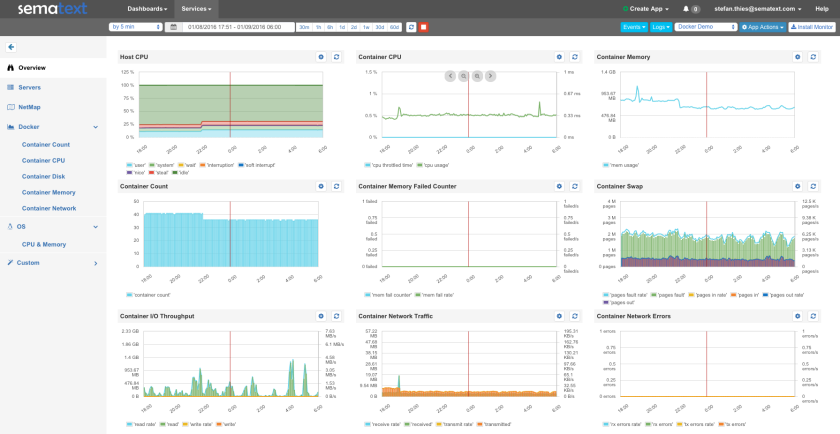
When you have to deal with a large log volume a scalable log storage is required.  This is where Logsene comes into play. Logsene provides a hosted ELK Stack and is available On Premises and in the Cloud. Logagent-js is a smart log parser written in node.js, taking advantage of async I/O to receive, parse and ship logs – including routing different application logs to different full text indices. We made the Logagent-js deployment on Heroku very easy and scaling out for a very high log volume is just one “heroku scale web=N” command away.

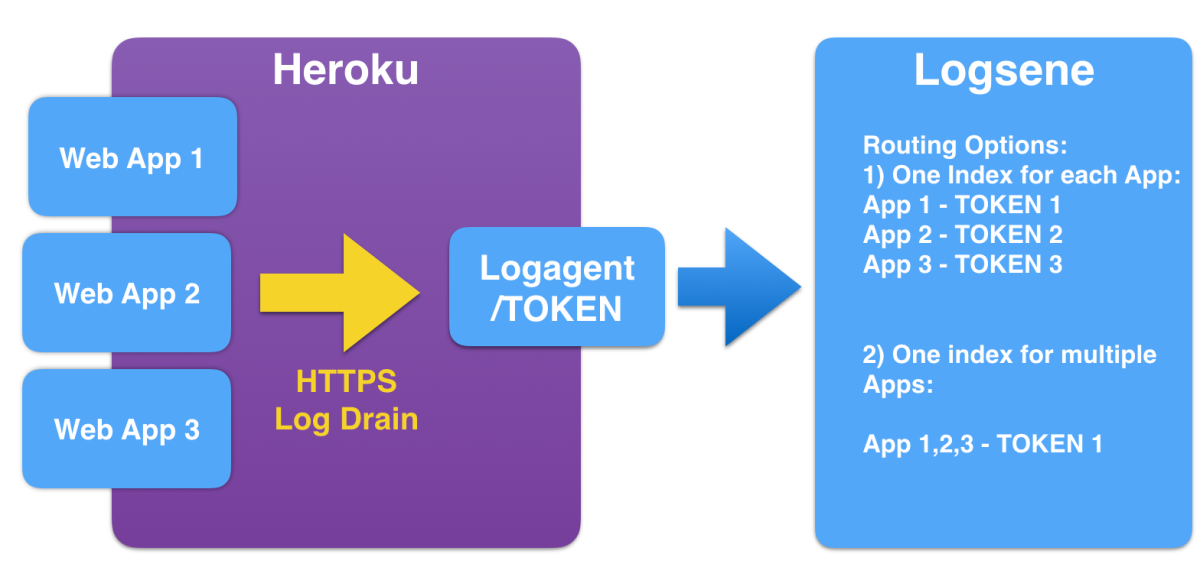
Let’s have a look at the architecture of this setup:

  1. Heroku Apps configured with a Heroku Log Drain
  2. logagent-js to receive, parse and ship logs
  3. Logsene as backend to store all your logs


Step 1 – Create your Logsene App

If you don’t have a Logsene account already simply get a free account and create a Logsene App. This will get you a Logsene Application Token, which we’ll use in Step 3.

Step 2 – Deploy Logagent-js to Heroku

heroku-button.png

We’ve prepared a  “Deploy to Heroku” button – just click on it and enter a name for the deployed log agent in the Heroku UI:

heroku-screenshot

Remember this name because we’ll need it later as the URL for the Log Drain.
Logagent-js can handle multiple Logsene tokens, which means it could be used for more than 1 Logsene app, simply addressed by /LOGSENE_TOKEN in the URL.

To run a short test without deploying logagent-js feel free to use the one we deployed for demos with the name “logsene-test”, reachable via https://logsene-test.herokuapp.com.

Step 3 – Configure Log Drain for your App

To configure the Heroku Log Drain we need the following information:

  1. The Logsene App Token
  2. The URL for the deployed logagent-js (e.g. logsene-app1.herokuapp.com)
  3. The Heroku App ID or name of your Application on Heroku (e.g. web-app-1 in the example below)

Then we can use the Heroku command line tool, for example like this:

heroku drains:add –app web-app-1 https://logsene-app1.herokuapp.com/25560d7b-ef59-4345-xxx-xxx

Or we could use the Heroku API to activate the Log Drain:

curl -n -X POST https://api.heroku.com/apps/web-app-1/log-drains \
-d '{"url": "https://logsene-app1.herokuapp.com/25560d7b-ef59-4345-xxx-xxx"}' \
-H "Content-Type: application/json" \
-H "Accept: application/vnd.heroku+json; version=3"

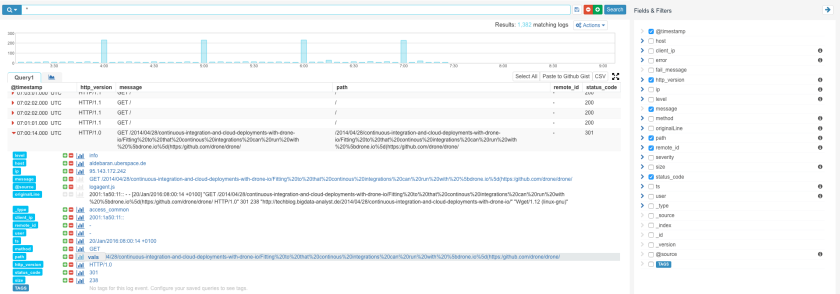
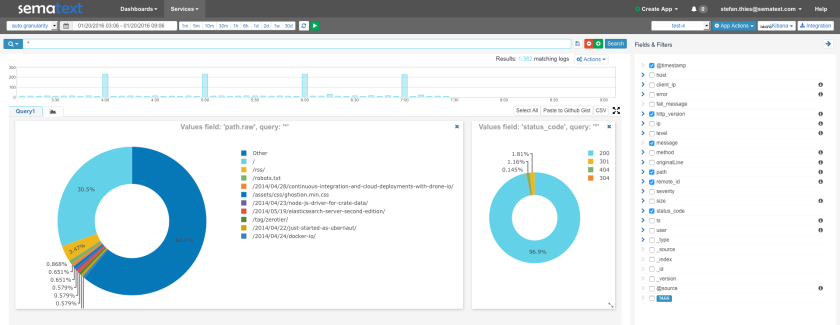
Step 4 – Watch your Logs in Logsene

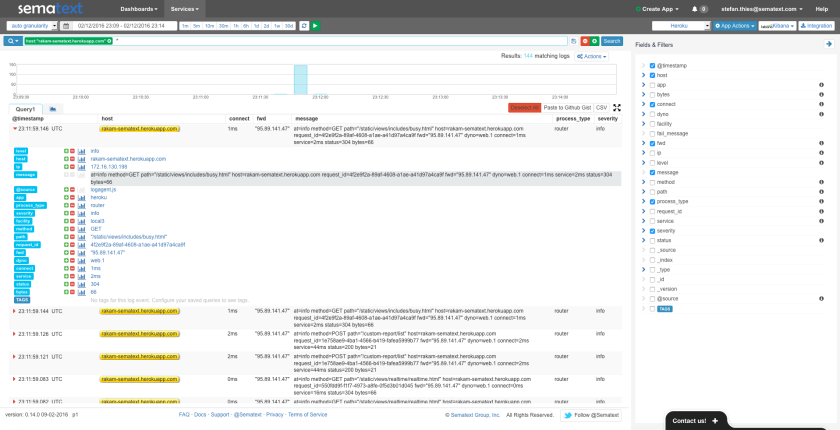
If you now access your App, Heroku should log your HTTP request and a few seconds later the logs will be visible in Logsene. And not in just any format!  You’ll see PERFECTLY STRUCTURED HEROKU LOGS:

heroku-logs-in-logsene.png

Enjoy!

Like what you saw here? To start with Logsene get a free account here or drop us an email, hit us on Twitter.  Logagent-js is open-source – if you find any bugs please create an issue on Github with suggestions, questions or comments.


Logagent-js – alternative to logstash, filebeat, fluentd, rsyslog?

What is the easiest way to parse, ship and analyze my web server logs? You should know that I’m a Node.js fan boy and not very thrilled with the idea of running a heavy process like Logstash on my low memory server, hosting my private Ghost Blog. I looked into Filebeat, a very light-weight log forwarder written in Go with an impressively low memory footprint of only a few MB, but Filebeat ships only unparsed log lines to Elasticsearch.  In other words, it sort of still needs Logstash to parse web server logs, which include many fields and numeric values!  Of course, structuring logs is essential for analytics.  The setup for rsyslog with elasticsearch and regex parsers is a bit more time consuming but very efficient compared to Logstash. Are there any better alternatives? Having a quick setup, well structured logs and a low memory footprint?

Guess what?  There is! Meet logagent-js – a log parser and shipper with log patterns for a number of popular log formats – from various Docker Images including Nginx, Apache, Linux and Mac system logs, to Elasticsearch, Redis, Solr, MongoDB and more. Logagent-js detects the log format automatically using the built-in pattern definitions (and also lets you provide your own, custom patterns).

Logagent-js includes a command line tool with default settings for Logsene as the Elasticsearch backend for storing the shipped logs.  Logsene is compatible with the Elasticsearch API, but can do much more, such as role-based access control, account sharing for DevOps teams,  ad-hoc charts in the Logsene UI, alerts on logs, and finally it integrates Kibana to ease the life of everybody dealing with log data!

Now let’s see what I run on my private blog site: logagent-js as single command to tail, parse and ship logs, all with less than 40 MB of RAM. Compare that to Logstash, which would not even start with just 40 MB of JVM heap.  Logagent-js can be installed as a command line tool with npm, which is included in Node.js (>0.12):

npm i logagent-js -g

Logagent-js needs only the Logsene Token as a parameter to ship logs to Logsene. When running it as a background process or daemon, it makes sense to limit the Node.js memory with  –max-old-space-size=60 to 100 MB, just in case.  Without such setting Node.js could consume more memory to improve performance in a long running process:

node --max-old-space-size=60 /usr/local/bin/logagent -s -t your-logsene-token-here logs/access_log &

You can also run logagent-js as upstart or systemd service, of course.

A few seconds after you start it you’ll see all your logs, parsed and structured into fields, with correct timestamps, numeric fields, etc., all without any additional configuration! A real gift and a huge time time saver for busy ops people!

Logsene-create-chart

Charting Logs

Next, let’s create some fancy charts with data from our logs. Logsene has ad-hoc charting functions (look for the little blue chart icons in the above screenshot) that let you draw Pie, Area, Line, Spline, Bar, and other types of charts. Logsene is smart and automatically provides chooses Pie charts to display distinct values and bar/line charts for numeric values over time.

Bildschirmfoto 2016-01-20 um 10.11.37

In the above screenshot we see the top viewed pages and the distribution of HTTP status codes.  We were able to generate these charts literally with just a few mouse clicks. The charts use the current query, so we could search for specific URLs and exclude e.g. images, stylesheets or traffic from robots using Logsene’s query language e.g. ‘NOT css AND NOT jpg AND NOT png AND NOT seoscanners’ or, more simply: -css -jpg -png -seoscanners).

Kibana Dashboards

If you prefer Kibana dashboards then you’ll need more complex Elasticsearch queries to remove Stylesheets, JavaScripts or other URLs from the top list. Open Kibana 4 in the Logsene UI and create a visualistaion to filter specific URLs – a ‘Terms Query’ can use regular expressions to Exclude and Include Filters.

Bildschirmfoto 2016-01-20 um 10.21.29

This visualization could be saved and added to a Kibana dashboard. If you know Kibana this takes a few minutes per visualization.  The result is a stored dashboard that could be shared with colleagues, which might not know how to create such dashboards.

Alert Me

The final thing I usually do is define alert queries e.g. to get notified about a growing number of HTTP error messages. For my private blog I use e-mail notifications, but Logsene integrates well with PagerDuty, HipChat, Slack or arbitrary WebHooks.

There are even more options like using Grafana with Logsene, or shipping logs automatically when using Docker.

Finally, a few more words about  logagent-js, which I consider a ‘swiss army knife’ for logs.  It integrates seamlessly with Logsene, while at the same time it can also work with other log destinations. It provides what I believe is a good compromise in terms of performance and setup time – I’d say it’s somewhere between rsyslog and logstash.

All tools for log processing require memory for this processing, but looking at the initial memory usage after starting the tools gives you an impression of the minimum resource usage.  Here are some numbers taking from my server:

Contributions to the pattern library for even more log formats are welcome – we are happy to help with additional log formats or input sources beside the existing inputs (standard input, file, Heroku, CloudFoundry and syslog UDP). Feel free to contact me @seti321 or @sematext to get up and running with your special setup!

If you don’t want to run and manage your own Elasticsearch cluster but would like to use Kibana for log and data analysis, then give Logsene a quick try by registering here – we do all the backend heavy lifting so you can focus on what you want to get out of your data and not on infrastructure.  There’s no commitment and no credit card required.  

We are happy to answer questions or receive feedback – please drop us a line or get us @sematext.

Elasticsearch Training in London

3 Elasticsearch Classes in London


es-training-240x187

Elasticsearch for Developers ……. April 4-5

Elasticsearch for Logging ……… April 6

Elasticsearch Operations …….  April 6

All classes cover Elasticsearch 2.x

Hands-on — lab exercises follow each class section

Early bird pricing until February 29

Add a second seat for 50% off

Register_Now_2

Course overviews are on our Elasticsearch Training page.

Want a training in your city or on-site?  Let us know!

Attendees in all three workshops will go through several sequences of short lectures followed by interactive, group, hands-on exercises. There will be Q&A sessions in each workshop after each such lecture-practicum block.

Got any questions or suggestions for the course? Just drop us a line or hit us @sematext!

Lastly, if you can’t make it…watch this space or follow @sematext — we’ll be adding more Elasticsearch training workshops in the US, Europe and possibly other locations in the coming months.  We are also known worldwide for Elasticsearch Consulting Services, and Elasticsearch Production Support.
We hope to see you in London in April!

Sending your Windows Event Logs to Logsene using NxLog and Logstash

There are a lot of sources of logs these days. Some may come from mobile devices, some from your Linux servers used to host data, while other can be related to your Docker containers. They are all supported by Logsene. What’s more, you can also ship logs from your Microsoft Windows based hosts and visualize them using Logsene. In this blog post we’ll show how to send your Windows Event Logs to Logsene in a way that will let you build great visualizations and really see what is happening on your Windows-based systems.
Continue reading “Sending your Windows Event Logs to Logsene using NxLog and Logstash”

Using Filebeat to Send Elasticsearch Logs to Logsene

One of the nice things about our log management and analytics solution Logsene is that you can talk to it using various log shippers.  You can use Logstash, or you can use syslog protocol capable tools like rsyslog, or you can just push your logs using the Elasticsearch API just like you would to send data to a local Elasticsearch cluster. And like any good DevOps team, we like to play with all the tools ourselves.  So we thought the timing was right to make Logsene work as a final destination for data sent using Filebeat.

With that in mind, let’s see how to use Filebeat to send log files to Logsene.  In this post we’ll ship Elasticsearch logs, but Filebeat can tail and ship logs from any log file, of course.

Continue reading “Using Filebeat to Send Elasticsearch Logs to Logsene”

PagerDuty and Logsene Integration

Great news for for those of us who use PagerDuty and manage — or are considering managing — logs with Logsene: PagerDuty and Logsene are now integrated!

This integration is a huge time- and aggravation-saver for DevOps professionals who wouldn’t mind dramatically reducing the frequent “noise” from log-generated monitoring alarms.

In case you’re not familiar, Logsene is an enterprise-class log management solution. Logsene can receive logs from a wide array of logs shippers, such as Fluentd, Logstash, and Syslog, and supports many logging frameworks for programming languages such as: Java, Scala, Go, Node.js, Ruby, Python, .Net, Perl, and more.  Among other capabilities, Logsene exposes the Elasticsearch API, works with Kibana and with Grafana (video), and has built-in alerts and anomaly detection.  It is available both in the Cloud (SaaS) and On Premises.

Logsene also integrates with SPM Performance Monitoring to correlate metrics, events, and logs in a single UI (check out Integrate PagerDuty with SPM Performance Monitoring for those instructions, which are very similar to what you will see here).

In PagerDuty:

Create a new service:

1) In your account, go to Services click +Add New Service

2) Enter in a name for your new service

3) Start typing “Sematext” for the Integration Type, which will narrow your filtering

PagerDuty_image

4) Select an escalation policy. Then, adjust the incident settings to your liking, then click Add Service.

5) Once the service is created, you’ll be taken to the service page. On this page, you’ll see the Service Integration Key​, which you will need when you configure Sematext products to send events to PagerDuty. Copy the Service Integration Key to the clipboard.

PagerDuty_2

In Logsene

1) Navigate to App Actions of your Logsene App by clicking the App Settings menu item.

PagerDuty_3

2) Navigate to Alerts / PagerDuty

3) Enter the API key from PagerDuty in the field Service API key.

4) Press Save

PagerDuty_4

5) To enable PagerDuty Notifications, navigate to Alerts /Notification Transports

6) Select PagerDuty

PagerDuty_5

Done. Every alert from your Logsene app will be forwarded to PagerDuty, where you can manage escalation policies and configure notifications to other services like HipChat, Slack, Zapier, Flowdock, and more.

Like what you saw here? To integrate PagerDuty with Logsene just get a free account here!  And drop us an email or hit us on Twitter with suggestions, questions or comments.

Docker Swarm: Collecting Metrics, Events & Logs

Docker Swarm is a cluster manager for Docker.  When accessed via the Docker API by Docker API Clients or Docker command line tools, a Docker Swarm cluster looks just like a single Docker Host.  Docker Swarm distributes containers to multiple nodes using various deployment strategies in the cluster scheduler.

Having in mind that a Swarm cluster looks like a single Docker Host from the API point of view, it should be very easy to monitor Docker Swarm with existing Docker monitoring tools!  Connecting a monitoring agent to the Swarm Master API endpoint should do the job, right? The Sematext Docker Agent could simply collect all container metrics, events and all logs from the Swarm Master – should be a piece of cake. Hm, but could there a gotcha?  It turns out there is more than one:

  • If we deploy a single monitoring agent to the master node, it would miss host metrics for all other nodes because the Docker API doesn’t provide any host metrics. We could also not see how much memory, disk space or CPU the Docker Swarm node itself consumes. Solution: deploy the monitoring agents to each node for collecting the metrics locally.
  • Assuming a larger cluster with a high volume of logs, events and metrics to collect, a single monitoring agent connected to the the master node would need to handle all operational data of the cluster.  This would work for a small cluster but such an architecture would obviously be destined for failure on larger clusters.  Guess what the solution is? It’s much better having an agent running on each node and distributing the monitoring and logging work over all nodes. If you do it right from the beginning, there is no need to change the deployment strategy later, when the cluster scales out.
DockerSwarmMonitoring
Monitoring container running on each Docker node

In the following example we assume that the master and agent nodes have the UNIX socket enabled in Docker daemon settings. This can be achieved by using –engine-env ‘DOCKER_OPTS=”-H unix:///var/run/docker.sock”‘ in the docker-machine create command. Use this Github Gist to create a Docker-Swarm Cluster with with enabled UNIX sockets. Later, we will see this helps simplify the deployment of any tool that needs to connect to the local Docker daemon – including monitoring and logging containers.

Let’s see how to deploy Sematext Agent to each node in a Docker Swarm Cluster with UNIX socket enabled in Docker-Daemon as just described.

When we started to work on Swarm Monitoring our first question was “Does Docker Swarm provide a deployment strategy for running exactly one instance of a service on each node?” We checked the documentation, but no dice.  We found strategies like “spread, binpack, and random” (see https://docs.docker.com/swarm/scheduler/strategy/), but none of them would guarantee exactly one instance of a service on each node. The “spread” strategy spreads the containers evenly over all hosts. The “binpack” strategy fills up one node after another with containers, while “random” spreads containers randomly to nodes. There was seemingly no strategy suitable for monitoring services running only once on each node.

So how can we distribute the monitoring container to each host using Docker Swarm instead of bash script iterating over all nodes?  It turns out it’s possible to define an affinity to ensure that containers that should run on the same host are scheduled together. In our case we use “anti-affinity” in the deployment strategy, which instructs Swarm not to deploy the container with Sematext Agent to hosts that already have that container running. In other words, it tells Docker Swarm to run no more than one Sematext Agent container on each Docker host.  To do that we define a docker-compose.yml file with the “anti-affinity” specified in the container environment section:

sematext-agent:
  image: 'sematext/sematext-agent-docker:latest'
  environment:
    - LOGSENE_TOKEN=3b549a2c-653a-4832-xxx
    - SPM_TOKEN=fe31fc3a-4660-47c6-xxx
    - affinity:container!=sematext-agent* 
  privileged: true
  restart: always
  volumes:
    - '/var/run/docker.sock:/var/run/docker.sock'

Finally, we use the docker-compose command to scale out the Sematext Docker Agent and deploy it to all Swarm cluster nodes.  To do that we run:

eval $(docker-machine env swarm-master --swarm)
docker-compose up -d 
# scale is == num nodes
docker-compose scale sematext-agent=$(docker-machine ls | grep swarm | grep Running | wc -l)

After running the above commands, Sematext Docker Agent will be running on each node and within a minute you will receive Host and Container Metrics for all containers, all their Logs and all Docker events from all nodes in your Docker Swarm cluster.  Complete visibility!

Bildschirmfoto 2016-01-12 um 15.36.01
Aggregated Metrics from all Docker Swarm nodes 

Please note there are many ways to create a Swarm cluster and you might have another setup, such as:

  • TLS secured Docker daemon and no possibility to activate the unix socket: In this situation you have to deal with the existing Docker daemon setup, which typically uses TLS and authentication via certificates (for example, if you followed Docker’s instructions to create Swarm clusters using Docker-Machine). When the Docker socket is secured with TLS, each client – including Sematext Docker Agent – needs the certificates for authentication. This involves a bunch of parameters such as “DOCKER_HOST”, “DOCKER_CERT_PATH”, “DOCKER_TLS_VERIFY” and mounting of the certificate into the container. In addition we should know to which Docker daemon the agent should be connected (typically port 2375 for TCP, 2376 for TLS on each node and port 3376 on Swarm Master nodes for the Swarm API). We made this scenario easy with a deployment script for the Sematext Agent with TLS options provided by Docker-Machine.
  • You use CoreOS to run Docker Swarm: In this case you could use fleet and systemd to distribute the agent to each node (simply install Sematext Agent with these instructions)

The deployment methods above should work for other monitoring tools or logging containers as well because most of such tools need to run on each node to collect the metrics locally.

If you have questions or special needs for monitoring more complex setups feel free to contact us. The Sematext Docker Agent is a turnkey-solution for Docker Logs, Metrics and Events – sign up here and give it a try (30-days free trial, no credit card needed).

How to forward CloudTrail (or other logs from AWS S3) to Logsene

This recipe shows how to send CloudTrail logs (which are .gz logs that AWS puts in a certain S3 bucket) to a Logsene application, but should apply to any kinds of logs that you put into S3. We’ll use AWS Lambda for this, but you don’t have to write the code. We’ve got that covered.

The main steps are:
0. Have some logs in an AWS S3 bucket 🙂
1. Create a new AWS Lambda function
2. Paste the code from this repository and fill in your Logsene Application Token
3. Point the function to your S3 bucket and give it permissions
4. Decide on the maximum memory to allocate for the function and the timeout for its execution
5. Explore your logs in Logsene 🙂

Continue reading “How to forward CloudTrail (or other logs from AWS S3) to Logsene”

Sematext Joins Docker’s ETP Program for Logging

Docker_ETP_Program_logo_squareSematext has just been recognized by Docker as an Ecosystem Technology Partner (ETP) for logging.  This designation indicates that Logsene has contributed to the logging driver and is available to users and organizations that seek solutions to capture logging data for monitoring their Dockerized distributed applications.

Log Management for Docker

“Sematext brings years of logging and monitoring expertise to the Docker community,” said Nick Stinemates, Head of Business Development and Technical Alliances at Docker.  “As an active participant in the Docker community, Sematext has provided logging solutions like Logsene and SPM for Docker, and contributed valuable user education and resources through informative webinars and blogs.”

Logsene & Docker

Logsene is a centralized logging, alerting and anomaly detection solution, available in the Cloud and On Premises.  Logsene delivers critical operational and business insights from data generated by Docker containers, applications and servers, and other devices.  Some DevOps engineers even think of Logsene as “ELK Stack on steroids.”  Logsene also integrates seamlessly with SPM, a performance monitoring, alerting and anomaly detection tool for Docker and many other platforms used by DevOps teams.

The following screenshot shows expanded views for Docker Events and Alerts (top), Container Logs (middle) and Container Metrics (bottom):

Docker_ETP_Container_CPU_annotation

Sematext SPM, showing Docker Events, Logs and Metrics

If you need more functionality to slice and dice logs then move to the Logsene UI shown below. The screenshot shows Container Log search (top) and detailed log messages tagged with container information and parsed fields (middle). Both the detail view in the middle and the Fields & Filters on the right side contain buttons to drill down into logs – e.g., to filter for the logs of a specific Docker Image or Docker Container.

Docker_ETP_Logsene_copy

Logsene User Interface – showing Docker log search, filtering options, log messages, & log events sorted by format

1-Minute Deployment in Tutum

One of the benefits of using SPM and Logsene for Docker monitoring, logging, and events is how easily they can be launched on Tutum.  It’s basically one minute: click-click-done!  For Docker users this means a single solution, a single container that captures not just logs or just metrics, but both container metrics and logs, plus Docker events, plus Docker host metrics and its logs.

Docker_ETP_Agent_Tutum_button

Sematext Docker Agent on Docker Hub

Sematext Docker Agent image is available on Docker Hub, and we shared the Tutum Stackfile for Sematext Docker Agent on Stackfiles.io – but the easiest way is to go via Sematext UI, which generates the stackfiles for you, including Application Tokens, as demonstrated in the video.

Docker_ETP_Tutum_create_stack

Sematext Docker Agent Stackfile in Tutum Cloud, ready to deploy

Docker’s ETP Program

Docker’s ETP program recognizes ecosystem partners like Sematext that have demonstrated integration with the Docker platform. As part of the program, Docker will highlight a capability area within the application lifecycle, validate integration and communicate the availability of the partner’s solution to the community and the market. The goal of the program is to ensure that logging tools like Logsene have been working with Docker to ensure the highest degree of availability and performance of distributed applications. Like the other partners in this program, Sematext has proven integration with the Docker platform and has demonstrated that Logsene is able to record logging data for dockerized applications.

“Sematext has been on the forefront of Docker monitoring, along with Docker event collection, charting and correlation with metrics,” said Otis Gospodnetić, Sematext’s Founder and CEO.  “So it was a natural next step to incorporate Docker logging via our Logsene log management solution.  The combination of SPM and Logsene not only allows for correlation of Docker metrics and logs, but also metrics and logs of applications running inside containers, along with anomaly detection and alerting. All this makes it much easier to troubleshoot performance and other issues much faster and with a lot less hassle than using more traditional or siloed solutions.”

Not using Logsene yet? Check out the free 30-day trial by registering here (ping us if you’re a startup, a non-profit, or educational institution – we’ve got special pricing for you!).  There’s no commitment and no credit card required.

Using Grafana with Elasticsearch for Log Analytics

Grafana is an open-source alternative to Kibana.  Grafana is best known as a visualization / dashboarding tool focused on graphing metrics from various data sources, such as InfluxDB. Even though Grafana started its life as a Kibana fork, it didn’t originally support using Elasticsearch as a Data Source.  Starting with version 2.5 Grafana added support for Elasticsearch as a Data Source — good news that we at Sematext got very excited about. Elasticsearch is typically not used to store pure metrics.  It is used more often for storing time series data like logs and other types of events (think IoT).  Grafana 2.5 was limited to the display of numerical values, but as of version 2.6 Grafana supports tabular display of textual data as well. Of course, most logs include numerical data, too, which means we can now use Grafana to render both logs and metrics from those logs stored in Logsene – perfect!

The Logsene API is compatible with Elasticsearch, which means you can use Grafana (from v2.6 and up) with your data in Logsene simply by using Grafana’s Elasticsearch Data Source and pointing it to Logsene. You only need to do two things:

  1. Create a Data Source
  2. Add a Table Panel to a Dashboard

Watch this short video to see Grafana and Logsene together in action:

We hope you like this new, alternative way to derive insight from your data in Logsene.  Got ideas how we could make it more useful for you?  Let us know via comments, email or @sematext.

Not using Logsene yet? Check out the free 30-day trial by registering here (ping us if you’re a startup, a non-profit, or educational institution – we’ve got special pricing for you!).  There’s no commitment and no credit card required.  Even better — combine Logsene with SPM to make the integration of performance metrics, logs, events and anomalies more robust for those looking for a single pane of glass.