I’m really excited to be attending Monitorama EU this week! I’ll give a talk about centralizing logs on Friday at 15:15 . You can see the full schedule here.
The talk is mainly about centralizing logs and storing them in Elasticsearch. It will begin with tips about using Elasticsearch for logs in production, so it runs fast and stable. There will be an introduction to Kibana 3 and then we’ll move to indexing.
We’ll start the indexing part by clarifying the term syslog: is it about a daemon? is it about a log message format? is it about a protocol for transferring logs? Spoiler alert: it can be any of the three, and there are options at every level. And one of them is to write syslog messages to Elasticsearch.
Then, we’ll move to Logstash and describe a few typical deployments. We’ll end by introducing alternatives to the setup described above: from our Logsene to the Flume + Solr combination.
If there’s enough time, I have some extra slides with tips about configuring rsyslog for processing lots of messages. Think 100K+ or even 1M+ messages per second, depending on the hardware and configuration.
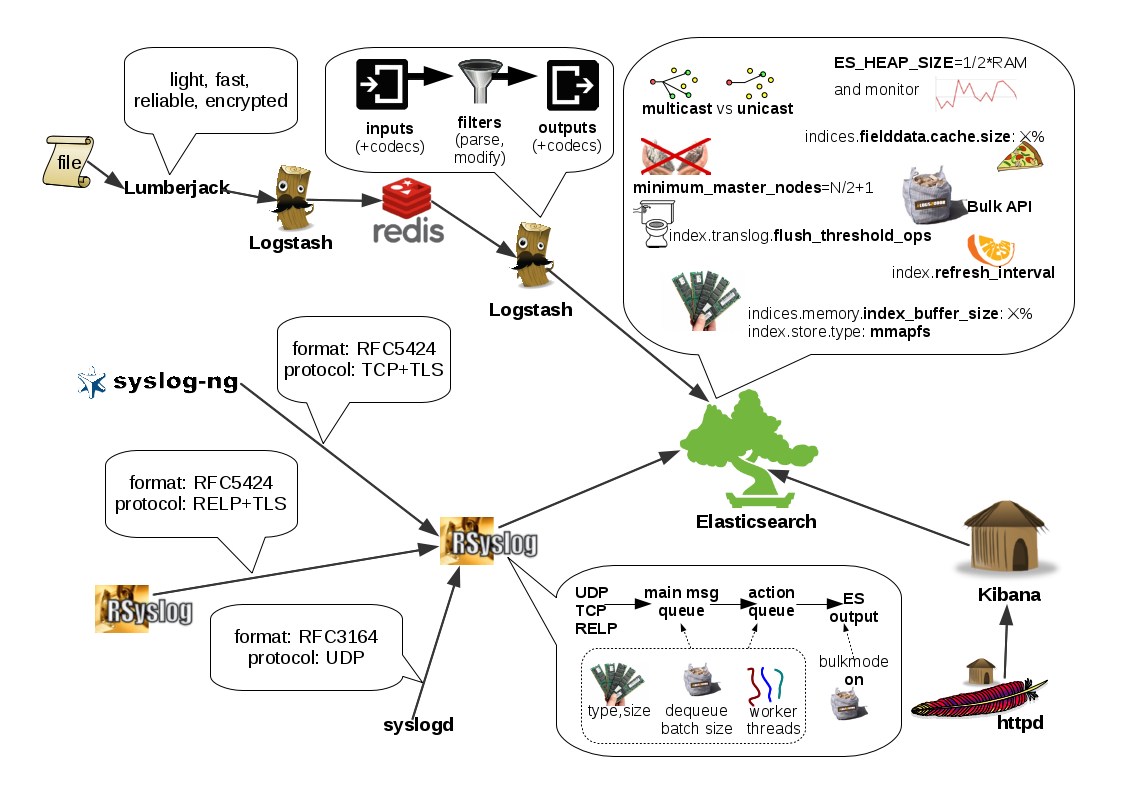
Below is a sketchnote of the whole talk, which will be printed and given to participants. Click on the image get the full resolution.
In this post you’ll see how you can take your logs with rsyslog and ship them directly to Elasticsearch (running on your own servers, or the one behind Logsene Elasticsearch API) in such a way that you can use Kibana to search, analyze and make pretty graphs out of them.
This is especially useful when you have a lot of servers logging [a lot of data] to their syslog daemons and you want a way to search them quickly or do statistics on the logs. You can use rsyslog’s Elasticsearch output to get your logs into Elasticsearch, and Kibana to visualize them. The only challenge is to get your rsyslog configuration right, so your logs end up where Kibana is expecting them. In this post, we’ll get you through the basics; if you want a more complete tutorial (including how to parse unstructured data and use rsyslog as a high-performance buffer), we suggest to have a look at our updated recipehere.
Note: that if this sort of stuff excites you, we are both hiring (from devops and core product engineering to marketing and sales) and working on Logsene – a log and data analytics product/service to complement SPM.
Getting all the ingredients
Here’s what you’ll need:
a recent version of rsyslog (v7+, if you ask me. The Elasticsearch output is available since 6.4.0). You can download and compile it yourself, or you can get it from the RHEL/CentOS or Ubuntu repositories provided by the maintainers
the Elasticsearch output plugin for rsyslog. If you compile rsyslog from sources, you’ll need to add the –enable-elasticsearch parameter to the configure script. If you use the repositories, just install the rsyslog-elasticsearch package
Elasticsearch :). You have a DEB and a RPM there, which should get you started in no time. If you choose the tar.gz archive, you might find the installation instructions useful
Kibana 3 and a web server to serve it. There are installation instructions on the GitHub page. To get started quickly, you can just clone the repository somewhere, then go into the “kibana” directory:
Then, you’ll probably need to edit config.js to change the Elasticsearch host name from “localhost” to the actual FQDN of the host that’s running Elasticsearch. This applies even if Kibana is on the same machine as Elasticsearch. “localhost” only works if your browser is on the same machine as Elasticsearch, because Kibana talks to Elasticsearch directly from your browser.
Finally, you can serve the Kibana page with any HTTP server you prefer. If you want to get started quickly, you can try SimpleHTTPServer, which should be embedded to any recent Python, by running this command from the “kibana” directory:
python -m SimpleHTTPServer
Putting them all together
Kibana is, by default, expecting Logstash to send logs to Elasticsearch. So “putting them all together” here means “configuring rsyslog to send logs to Elasticsearch in the same manner Logstash does”. And Logstash, by default, has some particular ways when it comes to naming the indices and formatting the logs:
indices should be formatted like logstash-YYYY.MM.DD. You can change the pattern Kibana is looking for, but we won’t do that here
logs must have a timestamp, and that timestamp must be stored in the @timestamp field. It’s also nice to put the message part in the message field – because Kibana shows it by default
To satisfy the requirements above, here’s a rsyslog configuration that should work for sending your local syslog logs to Elasticsearch in a Logstash/Kibana-friendly way:
module(load="imuxsock") # for listening to /dev/log
module(load="omelasticsearch") # for outputting to Elasticsearch# this is for index names to be like: logstash-YYYY.MM.DD
template(name="logstash-index"
type="list") {
constant(value="logstash-")
property(name="timereported" dateFormat="rfc3339" position.from="1" position.to="4")
constant(value=".")
property(name="timereported" dateFormat="rfc3339" position.from="6" position.to="7")
constant(value=".")
property(name="timereported" dateFormat="rfc3339" position.from="9" position.to="10")
}
# this is for formatting our syslog in JSON with @timestamp
template(name="plain-syslog"
type="list") {
constant(value="{")
constant(value="\"@timestamp\":\"") property(name="timereported" dateFormat="rfc3339")
constant(value="\",\"host\":\"") property(name="hostname")
constant(value="\",\"severity\":\"") property(name="syslogseverity-text")
constant(value="\",\"facility\":\"") property(name="syslogfacility-text")
constant(value="\",\"tag\":\"") property(name="syslogtag" format="json")
constant(value="\",\"message\":\"") property(name="msg" format="json")
constant(value="\"}")
}
# this is where we actually send the logs to Elasticsearch (localhost:9200 by default)
action(type="omelasticsearch"
template="plain-syslog"
searchIndex="logstash-index"
dynSearchIndex="on")
After restarting rsyslog, you can go to http://host-serving-Kibana:8000/ in your browser and start searching and graphing your logs:
Digging into syslog with Kibana
Tips
Now that you got the essentials working, here are some tips that might help you go even further with your centralized logging setup:
you might not want to put the new rsyslog and omelasticsearch on all your servers. In this case you can forward them over the network to a central rsyslog that has omelasticsearch, and push your logs to Elasticsearch from there. Some information on forwarding logs via TCP can be found here and here
you might want rsyslog to buffer your logs (in memory, on disk, or some combination of the two), in case Elasticsearch is not available for some reason. Buffering will also help performance, as you can send messages in bulks instead of one by one. There’s a reference on buffers with rsyslog&omelasticsearch here
you might want to parse JSON-formatted (CEE) syslog messages. If you’re using them, check our earlier post on the subject
If you don’t want to worry about any of that, you might want to check out Logsene. This is our new data & log analytics service, where you can just send your syslog messages (CEE-formatted or not) and not worry about running and maintaining a logging cluster in house. We’ll index them for you, and provide a nice interface to search and graph those logs. We also expose an Elasticsearch HTTP API, so Logsene plays nicely with Logstash, rsyslog+omelasticsearch, Kibana, and virtually any other logging tool that can send logs to Elasticsearch.
 For the occasion, Sematext is giving a 20% discount for all SPM applications. The discount code is MONEU2013
