1-Click ELK Stack: Hosted Kibana 4

We just pushed a new release of Logsene to production, including 1-Click Access to Kibana 4!

Did you know that Logsene provides a complete ELK Stack? Logsene’s indexing and search API is compatible with the Elasticsearch API.  That’s why it is very easy to use Logsene – you can use the existing Logstash Elasticsearch output, point it to Logsene for indexing, and then you can use Kibana and point it to Logsene like it’s your local Elasticsearch cluster.  And not only is this process easy, but Logsene actually adds more functionality to the bare “ELK” stack!  In fact, here is a long list of features the open-source ELK stack just doesn’t have, such as:

  • User Authentication and User Roles
  • Secured communication (TLS/HTTPS)
  • App Sharing: access control for each Logsene App, aka Index
  • Account Sharing: share resources, not passwords
  • Syslog receiver – no need to run Logstash just for forwarding server logs
  • Anomaly detection and Alerts for logs or any indexed data!

Let’s take a look to the Kibana 4 integration. You’ll find the “Kibana 4” button in the Logsene App Overview. Simply click on it and Kibana 4 will load the data from your Logsene App.

KIbana4-LS-OverviewKibana 4 automatically shows the “Discover” view and doesn’t require any setup – Logsene does everything for you! This means you can immediately start to build Queries, Visualizations, and Dashboards!

Kibana4-Discover
Kibana 4 Discover View – displaying data stored in Logsene
Kibana4-Apache-Logs-Dashboard
Simple Demo Dashboard – try it here!

If you prefer to run Kibana and point it to Logsene, yes, you can still do that; we show how to do that in How to use Kibana 4 with Logsene.

If you don’t want to run and manage your own Elasticsearch cluster but would like to use Kibana for log and data analysis, then give Logsene a quick try by registering here – we do all the backend heavy lifting so you can focus on what you want to get out of your data and not on infrastructure.  There’s no commitment and no credit card required.  And, if you are a young startup, a small or non-profit organization, or an educational institution, ask us for a discount (see special pricing)!

We are happy to answer questions or receive feedback – please drop us a line or get us @sematext.

Monitoring Kibana 4’s Node.js App

The release of Kibana 4.x has had an impact on monitoring and other related activities.  In this post we’re going to get specific and show you how to add Node.js monitoring to the Kibana 4 server app.  Why Node.js?  Because Kibana 4 now comes with a little Node.js server app that sits between the Kibana UI and the Elasticsearch backend.  Conveniently, you can monitor Node.js apps with SPM, which means SPM can monitor Kibana in addition to monitoring Elasticsearch.  Futhermore, Logstash can also be monitored with SPM, which means you can use SPM to monitor your whole ELK Stack!  But, I digress…

A few important things to note first:

  • the Kibana 4 project moved from Ruby to pure browser app to Node.js on the server side, as mentioned above
  • it now uses the popular Express Web Framework
  • the server component has a built-in proxy to Elasticsearch, just like it did with the Ruby app
  • when monitoring Kibana 4, the proxy requests to Elasticsearch are monitored at the same time

OK, here’s how to add Node.js monitoring to the Kibana 4 server-side app.

1) Preparation

Get an App Token for SPM by creating a new Node.js SPM App in SPM.

Kibana 4 currently ships with Node.js version 0.10.35 in a subdirectory – so please make sure your Node.js is on 0.10 while installing SPM Agent for Node.js (it compiles native modules, which need to fit to Kibana’s 0.10 runtime).

  npm-install n -g
  n 0.10.35

After finishing the described installation below you can easily switch back to 0.12 or io.js 2.0 by using “n 0.12” or “n io 2.0” – because Kibana will use its own node.js sub-folder.

2) Install SPM Agent for Node.js

Switch over to your Kibana 4 installation directory.  It has a “src” folder where the Node.js modules are installed.

  cd src
  npm install spm-agent-nodejs

Add the following line to ./src/app.js

  var spmAgent = require ('spm-agent-nodejs')

Add the following line to bin/kibana shell script at the beginning

export spmagent_tokens__spm=YOUR-SPM-APP-TOKEN

3) Run Kibana

bin/kibana

4) Check results in SPM

After a minute you should see the performance metrics such as EventLoop Latencies, Memory Usage, Garbage Collection details and HTTP statistics of your Kibana 4 Server app in SPM.

Kibana 4 - monitored with SPM for Node.js
Kibana 4 – monitored with SPM for Node.js

SPM for Node.js Monitoring – Details, Screenshots and more

For more specific details about SPM’s Node.js monitoring integration, check out this blog post.

That’s all there is to it!  If you’ve got questions or feedback to this post, please let us know!

How to use Kibana 4 with Logsene Log Management

Did you know that Logsene provides a complete ELK Stack; i.e., a complete Log management, analytics, exploration, and visualization solution? Logsene currently supports Kibana 3 with complete Kibana 4 support about to be released soon.

Can’t wait to use Kibana 4 with Logsene? No problem – part of the integration is already done and we’ve prepared instructions to run your own Kibana 4 with Logsene:

  • Open Kibana 4 configuration file config/kibana.yml and add Logsene server and Kibana-Index:
    elasticsearch_url: “https://logsene-receiver.sematext.com”
    kibana_index: “LOGSENE_TOKEN_kibana
  • Start Kibana 4 (./bin/kibana) and open the web browser http://localhost:5601 – Kibana 4 asks for an index pattern. Here you need to enter the Logsene token and a daily date pattern separated by an underscore:
    [YOUR-LOGSENE-TOKEN_]YYYY-MM-DD
  • Enter Kibana Index-PatternNow you are ready to set up your visualizations and dashboards in Kibana 4:
Kibana4-Logsene-Syslog
Kibana 4 Dashboard for data stored in Logsene

Perhaps you prefer automation of tasks? We prepared it for you:

That’s all there is to it.  Like what you see here?  Sound like something that could benefit your organization?  Then try Logsene for Free by registering here.  There’s no commitment and no credit card required.  And, if you are a young startup, a small or non-profit organization, or an educational institution, ask us for a discount (see special pricing)!

We are happy answer questions or receive feedback – please drop us a line or get us @sematext.

Monitoring rsyslog’s Performance with impstats and Elasticsearch

If you’re using rsyslog for processing lots of logs (and, as we’ve shown before, rsyslog is good at processing lots of logs), you’re probably interested in monitoring it. To do that, you can use impstats, which comes from input module for process stats. impstats produces information like:
input stats, like how many events went through each input
queue stats, like the maximum size of a queue
– action (output or message modification) stats, like how many events were forwarded by each action
– general stats, like CPU time or memory usage

In this post, we’ll show you how to send those stats to Elasticsearch (or Logsene — essentially hosted ELK, our log analytics service) that exposes the Elasticsearch API), where you can explore them with a nice UI, like Kibana. For example get the number of logs going through each input/output per hour:
kibana_graph
More precisely, we’ll look at:
– the useful options around impstats
– how to use those stats and what they’re about
– how to ship stats to Elasticsearch/Logsene by using rsyslog’s Elasticsearch output
– how to do this shipping in a fast and reliable way. This will apply to most rsyslog use-cases, not only impstats

Continue reading “Monitoring rsyslog’s Performance with impstats and Elasticsearch”

Using Elasticsearch Mapping Types to Handle Different JSON Logs

By default, Elasticsearch does a good job of figuring the type of data in each field of your logs. But if you like your logs structured like we do, you probably want more control over how they’re indexed: is time_elapsed an integer or a float? Do you want your tags analyzed so you can search for big in big data? Or do you need it not_analyzed, so you can show top tags via the terms aggregation? Or maybe both?

In this post, we’ll look at how to use index templates to manage multiple types of logs across multiple indices. Also, we’ll explain how to use logging tools (such as Logstash and rsyslog) to handle JSON logging and specify types.

Elasticsearch Mapping and Logs

As you may already know, to control these things in Elasticsearch you’ll need to define a mapping. This works similarly in Logsene, our log analytics SaaS, because it uses Elasticsearch and exposes its API.

With logs you’ll probably use time-based indices, because they scale better (in Logsene, for instance, you get daily indices). That said, to make sure the mapping you define today applies to the index you create tomorrow, you need to define it in an index template.

Managing Multiple Types

Mappings provide a nice abstraction when you have to deal with multiple types of structured data. Let’s say you have two apps generating logs of different structures: both have a timestamp field, but one recording logins has a user field, and another one recording purchases has an amount field.

To deal with this, you can define the timestamp field in the _default_ mapping which applies to all types. Then, in each type’s own mapping we’ll define fields unique to that mapping. The following snippet is an example that works with Logsene, provided that aaaaaaaa-bbbb-cccc-dddd-eeeeeeeeeeee is your Logsene app token. If you roll your own Elasticsearch, you can use whichever name you want, and make sure the template applies to your index pattern.

curl -XPUT 'logsene-receiver.sematext.com/_template/aaaaaaaa-bbbb-cccc-dddd-eeeeeeeeeeee_MyTemplate' -d '{
 "template" : "aaaaaaaa-bbbb-cccc-dddd-eeeeeeeeeeee*",
 "order" : 21,
 "mappings" : {
  "_default_" : {
   "properties" : {
    "timestamp" : { "type" : "date" }
   }
  },
  "firstapp" : {
   "properties" : {
    "user" : { "type" : "string" }
   }
  },
  "secondapp" : {
   "properties" : {
    "amount" : { "type" : "long" }
   }
  }
 }
}'

Sending JSON Logs to Specific Types

When you send a document to Elasticsearch by using the API, you have to provide an index and a type. You can use an Elasticsearch client for your preferred language to log directly to Elasticsearch or Logsene this way. But I wouldn’t recommend this, because then you’d have to manage things like buffering if the destination is unreachable.

Instead, I’d keep my logging simple and use a specialized logging tool, such as Logstash or rsyslog to do the hard work for me. Logging to a file is usually the easiest option. It’s local, and you can have your logging tool tail the file and send contents over the network. I usually prefer sockets (like syslog) because they let me configure Logstash/rsyslog to:
– write events in a human format to a local file I can tail if I need to (usually in development)
– forward logs without hitting disk if I need to (usually in production)
Whatever you prefer, I think writing to local files or sockets is better than sending logs over the network from your application. Unless you’re willing to do a reliability trade-off and use UDP, which gets rid of most complexities.

Opinions aside, here’s a Logstash configuration for tailing a file with JSON logs separated by a newline. Here’s how you’d send those documents to Logsene via the Elasticsearch API:

input {
 file {
 path => "/var/log/test"
 codec => "json"
 }
}

output {
 elasticsearch {
 host => "logsene-receiver.sematext.com"
 port => 80
 index => "LOGSENE-APP-TOKEN-GOES-HERE"
 index_type => "fileapp"
 protocol => "http"
 manage_template => false
 }
}

Note how the JSON codec does the parsing here, instead of the more expensive and maintenance-heavy approach with grok that we’ve shown in an earlier post on getting started with Logstash. Some applications let you configure the log format, so you can make them write JSON (Apache httpd, for example).

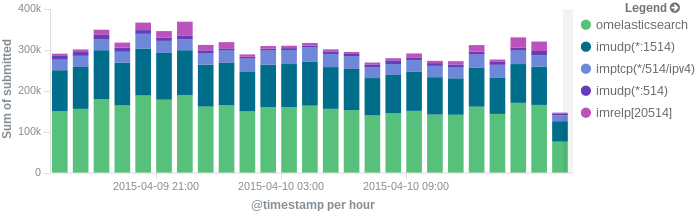
If you want to send JSON over syslog, there’s the JSON-over-syslog (CEE) format that we detailed in a previous post. You can use rsyslog’s JSON parser module to take your structured logs and forward them to Logsene:

module(load="imuxsock")        # can listen to local syslog socket
module(load="omelasticsearch") # can forward to Elasticsearch
module(load="mmjsonparse")     # can parse JSON

action(type="mmjsonparse")  # parse CEE-formatted messages

template(name="syslog-cee" type="list") {  # Elasticsearch documents will contain
  property(name="$!all-json")              # all JSON fields that were parsed
}

action(
  type="omelasticsearch"
  template="syslog-cee"                     # use the template defined earlier
  server="logsene-receiver.sematext.com"
  serverport="80"
  searchType="syslogapp"
  searchIndex="LOGSENE-APP-TOKEN-GOES-HERE"
  bulkmode="on"                                # send logs in batches
  queue.dequeuebatchsize="1000"                # of up to 1000
  action.resumeretrycount="-1"    # retry indefinitely (buffer) if destination is unreachable
)

To send a CEE-formatted syslog, you can run logger ‘@cee: {“amount”: 50}’ for example. Rsyslog would forward this JSON to Elasticsearch or Logsene via HTTP. Note that Logsene also supports CEE-formatted JSON over syslog out of the box if you want to use a syslog protocol instead of the Elasticsearch API.
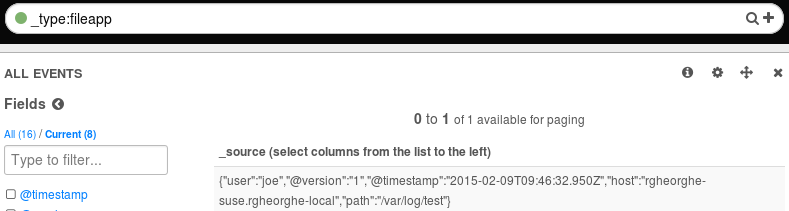
Filtering by Type

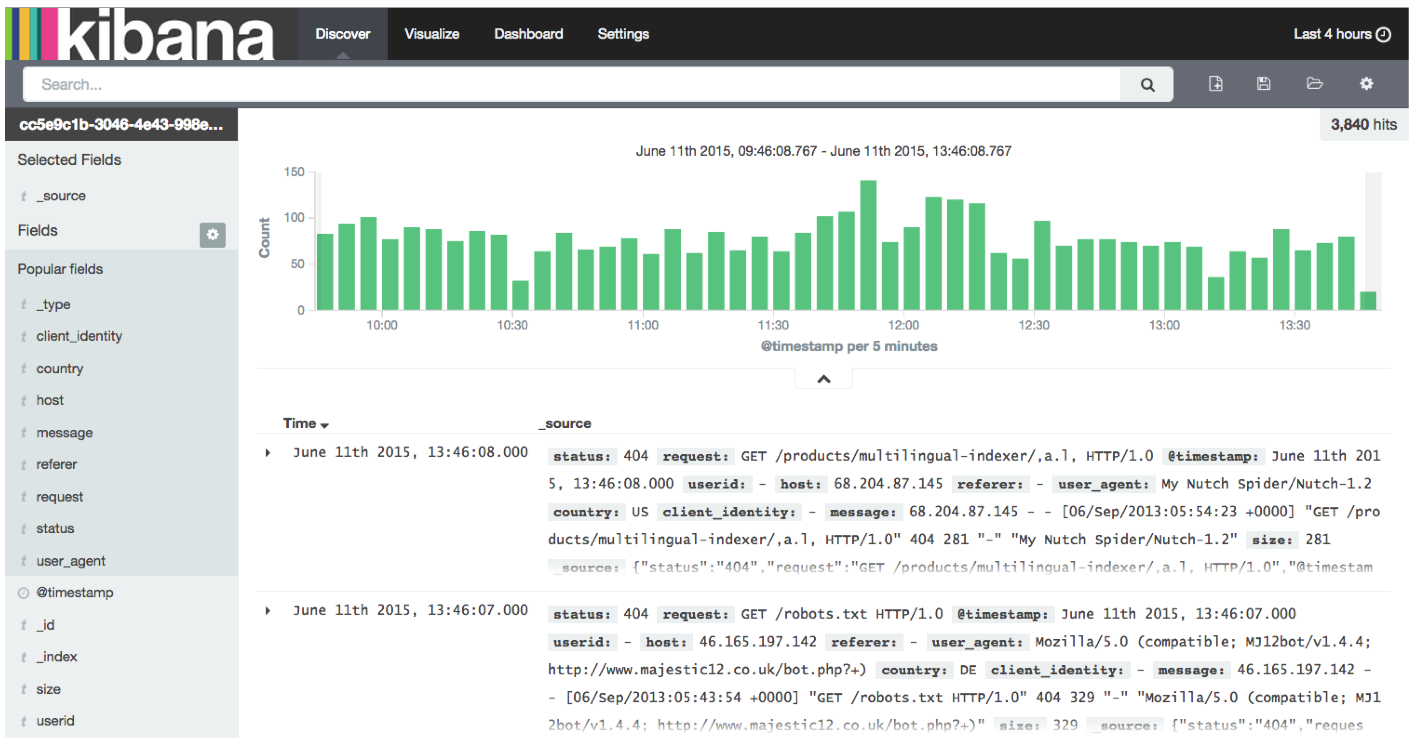
Once your logs are in, you can filter them by type (via the _type field) in Kibana:
Type Filtering with Kibana
However, if you want more refined filtering by source, we suggest using a separate field for storing the application name. This can be useful when you have different applications using the same logging format. For example, both crond and postfix use plain syslog.

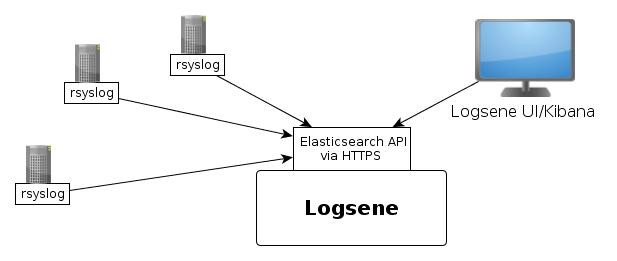
If you’re looking for a place to send your logs to, check out Logsene!
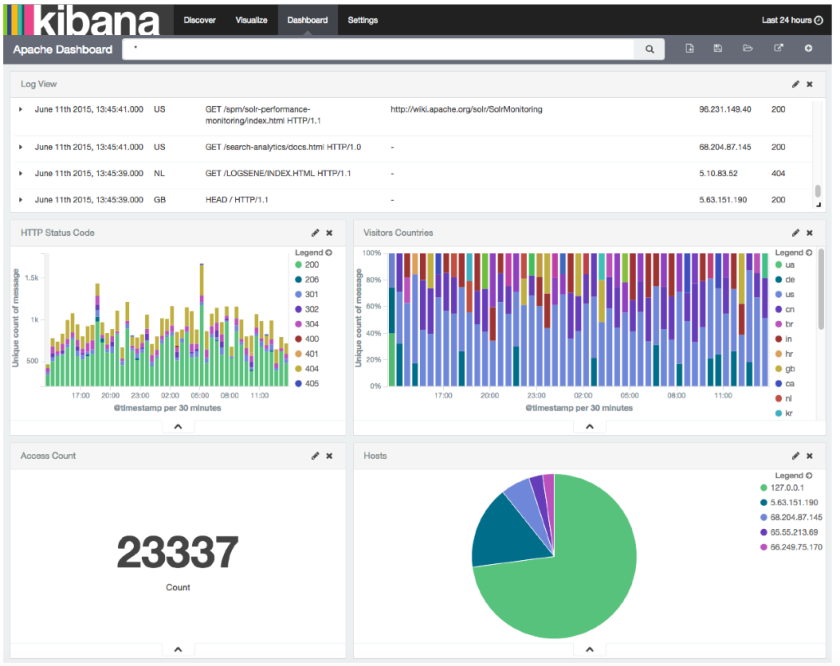
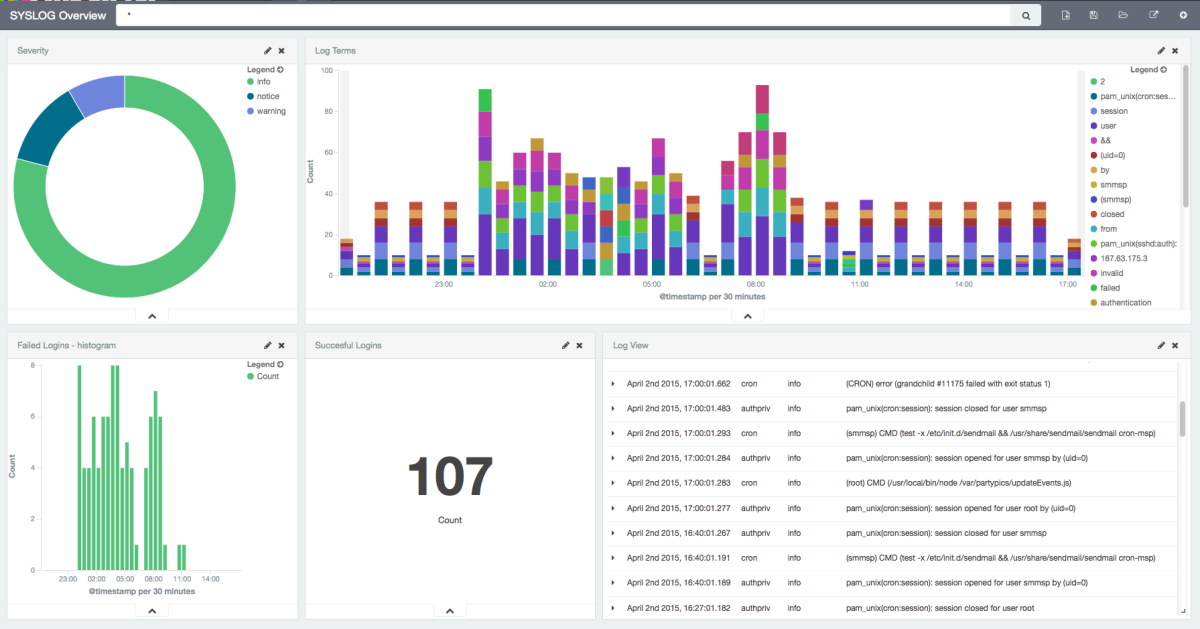
Parsing and Centralizing Elasticsearch Logs with Logstash

No, it’s not an endless loop waiting to happen, the plan here is to use Logstash to parse Elasticsearch logs and send them to another Elasticsearch cluster or to a log analytics service like Logsene (which conveniently exposes the Elasticsearch API, so you can use it without having to run and manage your own Elasticsearch cluster).

If you’re looking for some ELK stack intro and you think you’re in the wrong place, try our 5-minute Logstash tutorial. Still, if you have non-trivial amounts of data, you might end up here again. Because you’ll probably need to centralize Elasticsearch logs for the same reasons you centralize other logs:

  • to avoid SSH-ing into each server to figure out why something went wrong
  • to better understand issues such as slow indexing or searching (via slowlogs, for instance)
  • to search quickly in big logs

In this post, we’ll describe how to use Logstash’s file input to tail the main Elasticsearch log and the slowlogs. We’ll use grok and other filters to parse different parts of those logs into their own fields and we’ll send the resulting structured events to Logsene/Elasticsearch via the elasticsearch output. In the end, you’ll be able to do things like slowlog slicing and dicing with Kibana:

logstash_elasticsearch

TL;DR note: scroll down to the FAQ section for the whole config with comments.

Continue reading “Parsing and Centralizing Elasticsearch Logs with Logstash”

Encrypting Logs on Their Way to Elasticsearch Part 2: TLS Syslog

In part 1 of the “encrypted logs” series we discussed sending logs to Elasticsearch over HTTPS. This second part is about TLS syslog.

If you wonder what this has to do with Elasticsearch, the point is that TLS syslog is a standard (RFC-5425): any decent version of rsyslog, syslog-ng or nxlog works with it. So you can forward logs over TLS to a recent, “intermediary” rsyslog. Then, you can either use omelasticsearch with HTTPS to ship your logs to Elasticsearch, or you can install rsyslog on an Elasticsearch node (and index logs over HTTP to localhost).

Such a setup will give you the following benefits:

  • it will work with most syslog daemons, because TLS syslog is so widely supported
  • the “intermediate” rsyslog can act as a buffer, taking that pressure off your application servers
  • the “intermediate” rsyslog can be used for processing, like parsing CEE-formatted JSON over syslog. Again, taking load off your applicaton servers

Our log analytics SaaS, Logsene, gives you all the benefits listed above through the syslog endpoint:

TLS syslog flow in Logsene

Client Setup

Before you start, you’ll need a Certificate Authority’s public key, which will be used to validate the encryption certificate from the syslog destination (more about the server side later).

If you’re using Logsene, you can download the CA certificates directly. If you’re on a local setup, or you just want to consolidate your logs before shipping them to Logsene, you can use your own certificates or generate self-signed ones. Here’s a guide to generating certificates that will work with TLS syslog.

With the CA certificate(s) in hand, you can start configuring your syslog daemon. For example, the rsyslog configuration can look like this:

module(load="imuxsock")  # listens for local logs on /dev/log

global (  # global settings
 defaultNetstreamDriver="gtls"  # use TLS driver when it comes to transporting over TCP
 defaultNetstreamDriverCAFile="/opt/rsyslog/ca_bundle.pem"  # CA certificate. Concatenate if you have more
)

action(  # how to send logs
  type="omfwd"                                    # Forward them
  target="logsene-receiver-syslog.sematext.com"   # to Logsene's syslog endpoint
  port="10514"                                    # on port X
  protocol="tcp"                                  # over TCP
  template="RSYSLOG_SyslogProtocol23Format"       # using the RFC-5424 syslog format
  StreamDriverMode="1"                            # via the TLS mode of the driver defined above.
  StreamDriverAuthMode="x509/name"                # Request the machine certificate of the server
  StreamDriverPermittedPeers="*.sematext.com"     # and based on it, just allow Sematext hosts
)

This is the new-style configuration format for rsyslog, that works with version 6 or above. For the pre-v6 format (BSD-style), check out the Logsene documentation. You can also find the syslog-ng equivalent there.

Server Setup

If you’re using Logsene, you might as well stop here, because it handles everything from buffering and indexing to parsing JSON-formatted syslog.

If you’re consolidating logs before sending them to Logsene, or you’re running your local setup, here’s an excellent end-to-end guide to setting up TLS with rsyslog. The basic steps for the server are:

  • use the same CA certificates as the client, so they have the same basis
  • generate the machine public-private key pair. You’ll have to provide both in the rsyslog configuration
  • set up the TLS rsyslog configuration

Explore

Once you start logging, the end result should be just like in part 1. You can use Logsene’s hosted Kibana, your own Kibana or the Logsene UI to explore your logs:

Logsene Screnshot

As always, feel free to contact us if you need any help:

Encrypting Logs on Their Way to Elasticsearch

Let’s assume you want to send your logs to Elasticsearch, so you can search or analyze them in realtime. If your Elasticsearch cluster is in a remote location (EC2?) or is our log analytics service, Logsene (which exposes the Elasticsearch API), you might need to forward your data over an encrypted channel.

There’s more than one way to forward over SSL, and this post is part 1 of a series explaining how.

update: part 2 is now available!

Today’s method is about sending data over HTTPS to Elasticsearch (or Logsene), instead of plain HTTP. You’ll need two pieces to achieve this:

  1. a tool that can send logs over HTTPS
  2. the Elasticsearch REST API exposed over HTTPS

You can build your own tool or use existing ones. In this post we’ll show you how to use rsyslog’s Elasticsearch output to do that. For the API, you can use Nginx or Apache as a reverse proxy for HTTPS in front of your Elasticseach, or you can use Logsene’s HTTPS endpoint:

Rsyslog Configuration

To get rsyslog’s omelasticsearch plugin, you need at least version 6.6. HTTPS support was just added to master, and it’s expected to land in version 8.2.0. Once that is up, you’ll be able to use the Ubuntu, Debian or RHEL/CentOS packages to install both the base rsyslog and the rsyslog-elasticsearch packages you need. Otherwise, you can always install from sources:
– clone from the rsyslog github repository
– run `autogen.sh –enable-elasticsearch && make && make install` (depending on your system, it might ask for some dependencies)

With omelasticsearch in place (the om part comes from output module, if you’re wondering about the weird name), you can try the configuration below to take all your logs from your local /dev/log and forward them to Elasticsearch/Logsene:

# load needed input and output modules
module(load="imuxsock.so") # listen to /dev/log
module(load="omelasticsearch.so") # provides Elasticsearch output capability

# template that will build a JSON out of syslog
# properties. Resulting JSON will be in Logstash format
# so it plays nicely with Logsene and Kibana
template(name="plain-syslog"
         type="list") {
           constant(value="{")
             constant(value="\"@timestamp\":\"")
                 property(name="timereported" dateFormat="rfc3339")
             constant(value="\",\"host\":\"")
                 property(name="hostname")
             constant(value="\",\"severity\":\"")
                 property(name="syslogseverity-text")
             constant(value="\",\"facility\":\"")
                 property(name="syslogfacility-text")
             constant(value="\",\"syslogtag\":\"")
                 property(name="syslogtag" format="json")
             constant(value="\",\"message\":\"")
                 property(name="msg" format="json")
             constant(value="\"}")
         }

# send resulting JSON documents to Elasticsearch
action(type="omelasticsearch"
       template="plain-syslog"
 # Elasticsearch index (or Logsene token)
       searchIndex="YOUR-LOGSENE-TOKEN-GOES-HERE"
 # bulk requests
       bulkmode="on"  
       queue.dequeuebatchsize="100"
 # buffer and retry indefinitely if Elasticsearch is unreachable
       action.resumeretrycount="-1"
 # Elasticsearch/Logsene endpoint
       server="logsene-receiver.sematext.com"
       serverport="443"
       usehttps="on"
)

Exploring Your Data

After restarting rsyslog, you should be able to see your logs flowing in the Logsene UI, where you can search and graph them:

Logsene Screnshot

If you prefer Logsene’s Kibana UI, or you run your own Elasticsearch cluster, you can run make your own Kibana connect to the HTTPS endpoint just like rsyslog or Logsene’s native UI do.

Wrapping Up

If you’re using Logsene, all you need to do is to make sure you add your Logsene application token as the Elasticsearch index name in rsyslog’s configuration.

If you’re running your own Elasticsearch cluster, there are some nice tutorials about setting up reverse HTTPS proxies with Nginx and Apache respectively. You can also try Elasticsearch plugins that support HTTPS, such as the jetty and security plugins.

Feel free to contact us if you need any help. We’d be happy to answer any Logsene questions you may have, as well as help you with your local setup through professional services and production support. If you just find this stuff exciting, you may want to join us, wherever you are.

Stay tuned for part 2, which will show you how to use RFC-5425 TLS syslog to encrypt your messages from one syslog daemon to the other.

Video Presentation: On Centralizing Logs

You might have seen our PDF presentation from Monitorama that was published last week. Now, the video is available as well. You will be able to see more about tuning Elasticsearch’s configuration for logging. You’ll also learn what the various flavors of syslog are all about – and some tips for making rsyslog process hundreds of thousands of messages per second. And, of course, one can’t talk about centralizing logs without mentioning Kibana and Logstash.

If you like using these tools, you might want to check out our Logsene, which will do the heavy lifting for you. If you like working with them, we’re hiring, too.


For the occasion, Sematext is giving a 20% discount for all SPM applications. The discount code is MONEU2013.


Presentation: On Centralizing Logs

… with Syslog, LogStash, Elasticsearch, Kibana, and friends, one might add.  If you liked Recipe: rsyslog + Elasticsearch + Kibana, you’ll like this presentation.  We’ve also published the actual 25-minute video of the presentation.

For the occasion, Sematext is giving a 20% discount for all SPM applications. The discount code is MONEU2013.

Also, Manning is giving a 44% discount for Elasticsearch in Action and all the other books from their website. The discount code is mlmoneu13cf.

For those interested in Logsene, our Logstash + Syslog + Elasticsearch + Kibana service mentioned in the talk, we’ll notify you when Logsene becomes fully (and freely!) available next month if you leave your name on the Logsene page.

Below is a sketchnote of the whole talk, which was printed and given to all attendees. Click on the image to get the full resolution.

sketchnote