How to forward CloudTrail (or other logs from AWS S3) to Logsene

This recipe shows how to send CloudTrail logs (which are .gz logs that AWS puts in a certain S3 bucket) to a Logsene application, but should apply to any kinds of logs that you put into S3. We’ll use AWS Lambda for this, but you don’t have to write the code. We’ve got that covered.

The main steps are:
0. Have some logs in an AWS S3 bucket 🙂
1. Create a new AWS Lambda function
2. Paste the code from this repository and fill in your Logsene Application Token
3. Point the function to your S3 bucket and give it permissions
4. Decide on the maximum memory to allocate for the function and the timeout for its execution
5. Explore your logs in Logsene 🙂

Continue reading “How to forward CloudTrail (or other logs from AWS S3) to Logsene”

Recipe: rsyslog + Kafka + Logstash

This recipe is similar to the previous rsyslog + Redis + Logstash one, except that we’ll use Kafka as a central buffer and connecting point instead of Redis. You’ll have more of the same advantages:

  • rsyslog is light and crazy-fast, including when you want it to tail files and parse unstructured data (see the Apache logs + rsyslog + Elasticsearch recipe)
  • Kafka is awesome at buffering things
  • Logstash can transform your logs and connect them to N destinations with unmatched ease

There are a couple of differences to the Redis recipe, though:

  • rsyslog already has Kafka output packages, so it’s easier to set up
  • Kafka has a different set of features than Redis (trying to avoid flame wars here) when it comes to queues and scaling

As with the other recipes, I’ll show you how to install and configure the needed components. The end result would be that local syslog (and tailed files, if you want to tail them) will end up in Elasticsearch, or a logging SaaS like Logsene (which exposes the Elasticsearch API for both indexing and searching). Of course you can choose to change your rsyslog configuration to parse logs as well (as we’ve shown before), and change Logstash to do other things (like adding GeoIP info).

Getting the ingredients

First of all, you’ll probably need to update rsyslog. Most distros come with ancient versions and don’t have the plugins you need. From the official packages you can install:

If you don’t have Kafka already, you can set it up by downloading the binary tar. And then you can follow the quickstart guide. Basically you’ll have to start Zookeeper first (assuming you don’t have one already that you’d want to re-use):

bin/zookeeper-server-start.sh config/zookeeper.properties

And then start Kafka itself and create a simple 1-partition topic that we’ll use for pushing logs from rsyslog to Logstash. Let’s call it rsyslog_logstash:

bin/kafka-server-start.sh config/server.properties
bin/kafka-topics.sh --create --zookeeper localhost:2181 --replication-factor 1 --partitions 1 --topic rsyslog_logstash

Finally, you’ll have Logstash. At the time of writing this, we have a beta of 2.0, which comes with lots of improvements (including huge performance gains of the GeoIP filter I touched on earlier). After downloading and unpacking, you can start it via:

bin/logstash -f logstash.conf

Though you also have packages, in which case you’d put the configuration file in /etc/logstash/conf.d/ and start it with the init script.

Configuring rsyslog

With rsyslog, you’d need to load the needed modules first:

module(load="imuxsock")  # will listen to your local syslog
module(load="imfile")    # if you want to tail files
module(load="omkafka")   # lets you send to Kafka

If you want to tail files, you’d have to add definitions for each group of files like this:

input(type="imfile"
  File="/opt/logs/example*.log"
  Tag="examplelogs"
)

Then you’d need a template that will build JSON documents out of your logs. You would publish these JSON’s to Kafka and consume them with Logstash. Here’s one that works well for plain syslog and tailed files that aren’t parsed via mmnormalize:

template(name="json_lines" type="list" option.json="on") {
  constant(value="{")
  constant(value="\"timestamp\":\"")
  property(name="timereported" dateFormat="rfc3339")
  constant(value="\",\"message\":\"")
  property(name="msg")
  constant(value="\",\"host\":\"")
  property(name="hostname")
  constant(value="\",\"severity\":\"")
  property(name="syslogseverity-text")
  constant(value="\",\"facility\":\"")
  property(name="syslogfacility-text")
  constant(value="\",\"syslog-tag\":\"")
  property(name="syslogtag")
  constant(value="\"}")
}

By default, rsyslog has a memory queue of 10K messages and has a single thread that works with batches of up to 16 messages (you can find all queue parameters here). You may want to change:
– the batch size, which also controls the maximum number of messages to be sent to Kafka at once
– the number of threads, which would parallelize sending to Kafka as well
– the size of the queue and its nature: in-memory(default), disk or disk-assisted

In a rsyslog->Kafka->Logstash setup I assume you want to keep rsyslog light, so these numbers would be small, like:

main_queue(
  queue.workerthreads="1"      # threads to work on the queue
  queue.dequeueBatchSize="100" # max number of messages to process at once
  queue.size="10000"           # max queue size
)

Finally, to publish to Kafka you’d mainly specify the brokers to connect to (in this example we have one listening to localhost:9092) and the name of the topic we just created:

action(
  broker=["localhost:9092"]
  type="omkafka"
  topic="rsyslog_logstash"
  template="json"
)

Assuming Kafka is started, rsyslog will keep pushing to it.

Configuring Logstash

This is the part where we pick the JSON logs (as defined in the earlier template) and forward them to the preferred destinations. First, we have the input, which will use to the Kafka topic we created. To connect, we’ll point Logstash to Zookeeper, and it will fetch all the info about Kafka from there:

input {
  kafka {
    zk_connect => "localhost:2181"
    topic_id => "rsyslog_logstash"
  }
}

At this point, you may want to use various filters to change your logs before pushing to Logsene or Elasticsearch. For this last step, you’d use the Elasticsearch output:

output {
  elasticsearch {
    hosts => "logsene-receiver.sematext.com:443" # it used to be "host" and "port" pre-2.0
    ssl => "true"
    index => "your Logsene app token goes here"
    manage_template => false
    #protocol => "http" # removed in 2.0
    #port => "443" # removed in 2.0
  }
}

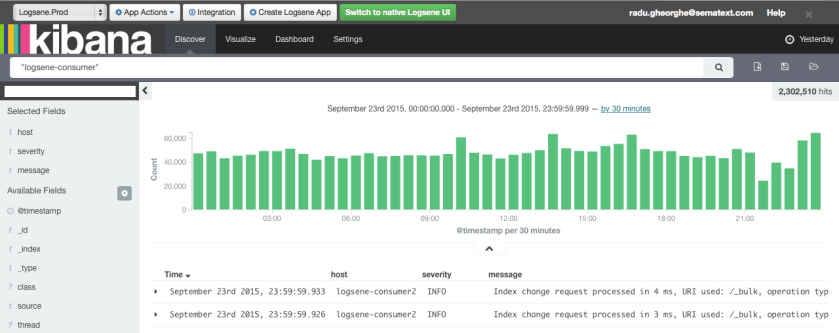
And that’s it! Now you can use Kibana (or, in the case of Logsene, either Kibana or Logsene’s own UI) to search your logs!
Recipe: rsyslog + Redis + Logstash

OK, so you want to hook up rsyslog with Logstash. If you don’t remember why you want that, let me give you a few hints:

  • Logstash can do lots of things, it’s easy to set up but tends to be too heavy to put on every server
  • you have Redis already installed so you can use it as a centralized queue. If you don’t have it yet, it’s worth a try because it’s very light for this kind of workload.
  • you have rsyslog on pretty much all your Linux boxes. It’s light and surprisingly capable, so why not make it push to Redis in order to hook it up with Logstash?

In this post, you’ll see how to install and configure the needed components so you can send your local syslog (or tail files with rsyslog) to be buffered in Redis so you can use Logstash to ship them to Elasticsearch, a logging SaaS like Logsene (which exposes the Elasticsearch API for both indexing and searching) so you can search and analyze them with Kibana:

Kibana_search

Continue reading “Recipe: rsyslog + Redis + Logstash”

Recipe: Reindexing Elasticsearch Documents with Logstash

If you’re working with Elasticsearch, it’s very likely that you’ll need to reindex data at some point. The most popular reason is because you need a mapping change that is incompatible with your current mapping. New fields can be added by default, but many changes are not allowed, for example:

  • Want to switch to doc values because field data is taking too much heap? Reindex!
  • Want to change the analyzer of a given field? Reindex!
  • Want to break one great big index into time-based indices? Reindex!

Enter Logstash

A while ago I was using stream2es for reindexing, but if you look at the GitHub page it recommends using Logstash instead. Why? In general, Logstash can do more stuff, here are my top three reasons:

  1. On the input side, you can filter only a subset of documents to reindex
  2. You can add filters to transform documents on their way to the new index (or indices)
  3. It should perform better, as you can add more filter threads (using the -w parameter) and multiple output worker threads (using the workers configuration option)

Show Me the Configuration!

In short, you’ll use the elasticsearch input to read existing data and the elasticsearch output to write it. In between, you can use various filters to change how documents look like.

Input

To read documents, you’ll use the elasticsearch input. You’ll probably want to specify the host(s) to connect to and the index (check the documentation for more options like query):

input {
  elasticsearch {
   hosts => ["localhost"]
   index => "old-index"
  }
}

By default, this will run a match_all query that does a scan through all the documents of the index, fetch pages of 1000, and times out in a minute (i.e. after a minute it won’t know where it left off). All this is configurable, but the defaults are sensible. Scan is good for deep paging (as normally when you fetch a page from 1000000 to 1000020, Elasticsearch fetches 1000020, sorts them, and gives back the last 20) and also works with a “snapshot” of the index (updates after the scan started won’t be taken into account).

Filter

Next, you might want to change documents in their way to the new index. For example, if the data you’re reindexing wasn’t originally indexed with Logstash, you probably want to remove the @version and/or @timestamp fields that are automatically added. To do that, you’ll use the mutate filter:

filter {
 mutate {
  remove_field => [ "@version" ]
 }
}

Output

Finally, you’ll use the elasticsearch output to send data to a new index. The defaults are once again geared towards the logging use-case. If this is not your setup, you might want to disable the default Logstash template (manage_template=false) and use yours:

output {
 elasticsearch {
   host => "localhost"
   protocol => "http"
   manage_template => false
   index => "new-index"
   index_type => "new-type"
   workers => 5
 }
}

Final Remarks

If you want to use time-based indices, you can change index to something like “logstash-%{+YYYY.MM.dd}” (this is the default), and the date would be taken from the @timestamp field. This is by default populated with the time Logstash processes the document, but you can use the date filter to replace it with a timestamp from the document itself:

filter {
 date {
   "match" => [ "custom_timestamp", "MM/dd/YYYY HH:mm:ss" ]
   target => "@timestamp"
 }
}

If your Logstash configuration contains only these snippets, it will nicely shut down when it’s done reindexing.

That’s it! We are happy answer questions or receive feedback – please drop us a line or get us @sematext. And, yes, we’re hiring!