New functionality is rolling out in SPM Performance Monitoring! Watch this space for future posts on Transaction Tracing, Global and App-specific Server Views, Kafka 0.8.2 monitoring and other cool stuff. For this post, those of you who use HAProxy are in luck as we just added monitoring support for this popular TCP/HTTP load balancer.
See also: Apache monitoring, and Nginx & Nginx Plus monitoring.
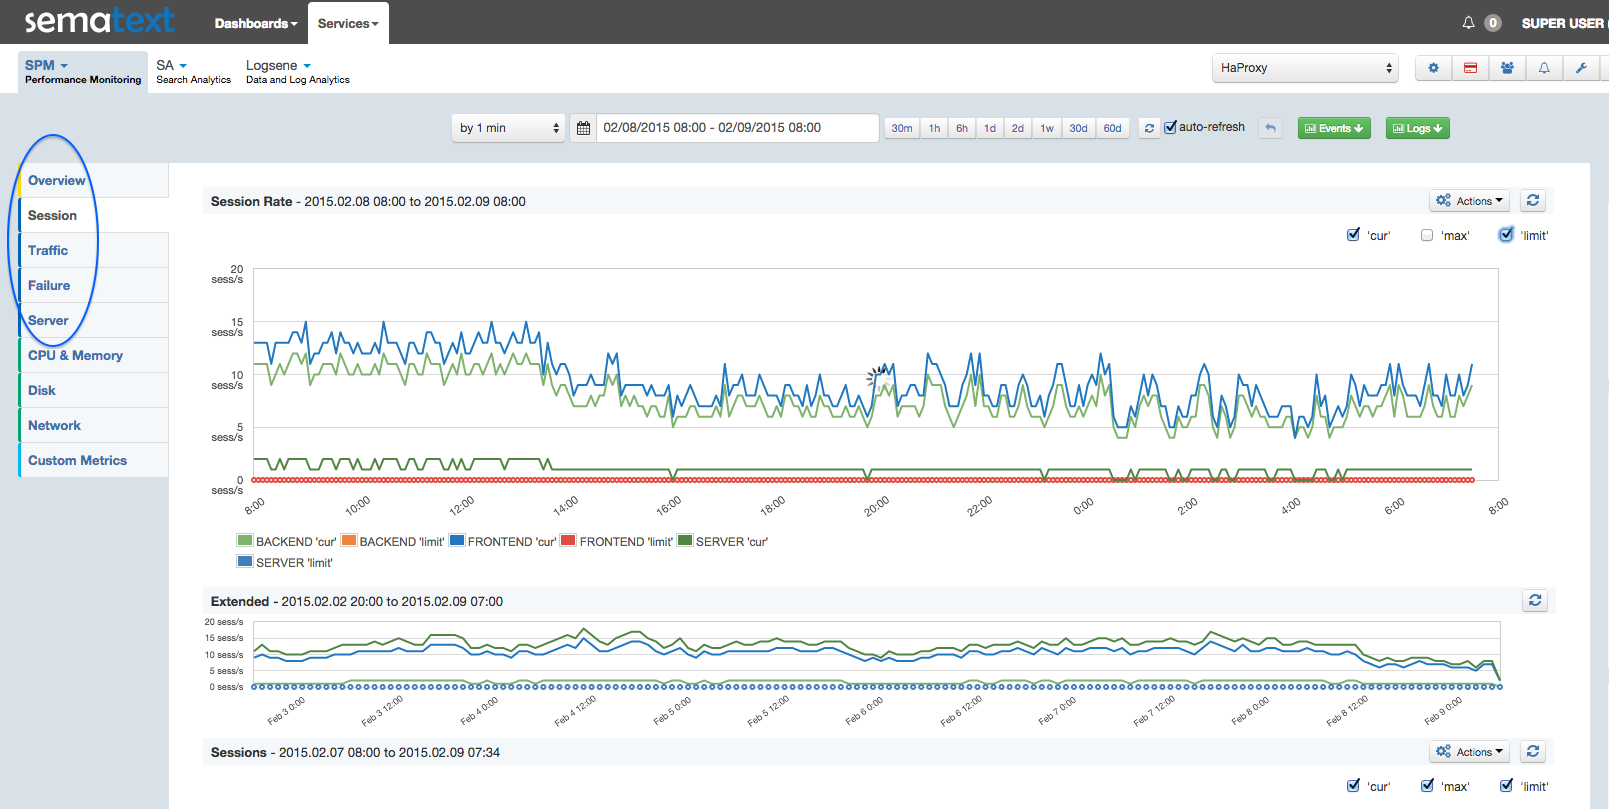
Screenshot – HAProxy Session Rate (click to enlarge)
HAProxy Metrics
SPM collects key metrics from the HAProxy load balancer of the underlying proxies/servers, as you can see in the chart below.
| Metric Name | Description |
| status | 1 (UP/OPEN) 0 (DOWN) |
| downtime | total downtime (in seconds) |
| rate | number of sessions per second over last elapsed second |
| rate_max | max number of new sessions per second |
| rate_lim | limit on new sessions per second |
| scur | current sessions |
| smax | max sessions |
| slimit | sessions limit |
| stot | total sessions |
| lbtot | total number of times a server was selected |
| bin | bytes in |
| bout | bytes out |
| dreq | denied requests |
| dresp | denied responses |
| ereq | error requests |
| eresp | response errors |
| econ | connection errors |
| wretr | retries (warning) |
| wredis | redispatches (warning) |
| weight | server weight (server), total weight (backend) |
| act | server is active (server), number of active servers (backend) |
| bck | server is backup (server), number of backup servers (backend) |
You can create threshold-based or machine learning-based anomaly detection on any of these metrics, of course, and you can also rely on heartbeat alerts to detect any HAProxy daemon going down. Any alerts can be emailed or you can use any of the SPM Alerts Integrations such as PagerDuty, HipChat, Slack, Nagios, or any other WebHook.
See for Yourself
You can check out SPM’s live demo and see some more of SPM’s monitoring, alerting and anomaly detection functionality. In addition to native monitoring for apps like Solr, Elasticsearch, Hadoop, HBase, Spark, Cassandra, Kafka, Storm, and many more, SPM also integrates with with Logsene Log Management and Analytics to add centralized logging functionality and correlation of metrics, logs, alerts, anomalies, and events.
Take a Test Drive — It’s Easy and Free to Get Started
Like what you see here? Sound like something that could benefit your organization? Then try SPM (and Logsene, too) for Free for 30 days by registering here. There’s no commitment and no credit card required.
