Replaying Elasticsearch Slowlogs with Logstash and JMeter

Sometimes we just need to replay production queries – whether it’s because we want a realistic load test for the new version of a product or because we want to reproduce, in a test environment, a bug that only occurs in production (isn’t it lovely when that happens? Everything is fine in tests but when you deploy, tons of exceptions in your logs, tons of alerts from the monitoring system…).

With Elasticsearch, you can enable slowlogs to make it log queries taking longer (per shard) than a certain threshold. You can change settings on demand. For example, the following request will record all queries for test-index:

curl -XPUT localhost:9200/test-index/_settings -d '{
  "index.search.slowlog.threshold.query.warn" : "1ms"
}'

You can run those queries from the slowlog in a test environment via a tool like JMeter. In this post, we’ll cover how to parse slowlogs with Logstash to write only the queries to a file, and how to configure JMeter to run queries from that file on an Elasticsearch cluster.

Continue reading “Replaying Elasticsearch Slowlogs with Logstash and JMeter”

Parsing and Centralizing Elasticsearch Logs with Logstash

No, it’s not an endless loop waiting to happen, the plan here is to use Logstash to parse Elasticsearch logs and send them to another Elasticsearch cluster or to a log analytics service like Logsene (which conveniently exposes the Elasticsearch API, so you can use it without having to run and manage your own Elasticsearch cluster).

If you’re looking for some ELK stack intro and you think you’re in the wrong place, try our 5-minute Logstash tutorial. Still, if you have non-trivial amounts of data, you might end up here again. Because you’ll probably need to centralize Elasticsearch logs for the same reasons you centralize other logs:

  • to avoid SSH-ing into each server to figure out why something went wrong
  • to better understand issues such as slow indexing or searching (via slowlogs, for instance)
  • to search quickly in big logs

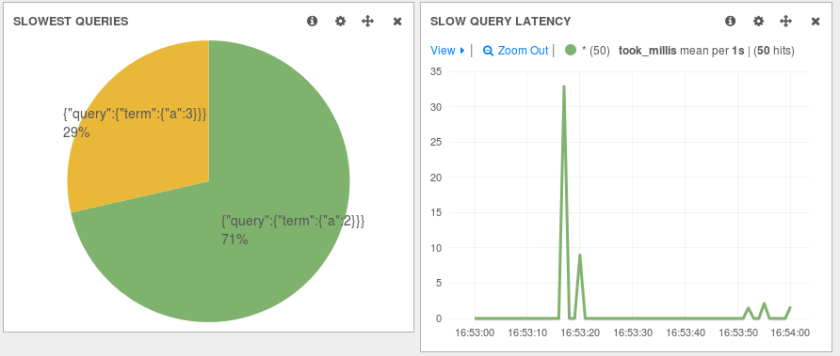
In this post, we’ll describe how to use Logstash’s file input to tail the main Elasticsearch log and the slowlogs. We’ll use grok and other filters to parse different parts of those logs into their own fields and we’ll send the resulting structured events to Logsene/Elasticsearch via the elasticsearch output. In the end, you’ll be able to do things like slowlog slicing and dicing with Kibana:

logstash_elasticsearch

TL;DR note: scroll down to the FAQ section for the whole config with comments.

Continue reading “Parsing and Centralizing Elasticsearch Logs with Logstash”

5-minute Logstash: Parsing and Sending a Log File

NOTE: this post has been updated for Logstash 2.x.

We like Logstash a lot at Sematext, because it’s a good (if not the) swiss-army knife for logs. Plus, it’s one of the easiest logging tools to get started with, which is exactly what this post is about. In less than 5 minutes, you’ll learn how to send logs from a file, parse them to extract metrics from those logs and send them to Logsene, our logging SaaS (basically, ELK Stack in the Cloud, though you can get an On Premises version, too, if you really want)

NOTE: Because Logsene exposes the Elasticsearch API, the same steps will work if you have a local Elasticsearch cluster.

NOTE: If this sort of stuff excites you, we are hiring world-wide for positions from devops and core product engineering to marketing and sales.

Overview

As an example, we’ll take an Apache log, written in its combined logging format. Your Logstash configuration would be made up of three parts:

  • a file input, that will follow the log
  • a grok filter, that would parse its contents to make a structured event
  • an elasticsearch output, that will send your logs to Logsene via HTTP, so you can use Kibana or its native UI to explore those logs. For example, with Kibana you can make a pie-chart of response codes:

pie_chart

The Input

The first part of your configuration file would be about your inputs. Inputs are modules of Logstash responsible for ingesting data. You can use the file input to tail your files. There are a lot of options around this input, and the full documentation can be found here. For now, let’s assume you want to send the existing contents of that file, in addition to the new content. To do that, you’d set the start_position to beginning. Here’s how the whole input configuration will look like:

input {
  file {
    path => "/var/log/apache.log"
    type => "apache-access"  # a type to identify those logs (will need this later)
    start_position => "beginning"
  }
}

The Filter

Filters are modules that can take your raw data and try to make sense of it. Logstash has lots of such plugins, and one of the most useful is grok. Grok makes it easy for you to parse logs with regular expressions, by assigning labels to commonly used patterns. One such label is called COMBINEDAPACHELOG, which is exactly what we need:

filter {
  if [type] == "apache-access" {   # this is where we use the type from the input section
    grok {
      match => [ "message", "%{COMBINEDAPACHELOG}" ]
    }
  }
}

If you need to use more complicated grok patterns, we suggest trying the grok debugger.

The Output

To send logs to Logsene (or your own Elasticsearch cluster) via HTTP, you can use the elasticsearch output. You’ll need to specify that you want the HTTP protocol, the host and port of an Elasticsearch server.

For Logsene, those would be logsene-receiver.sematext.com and port 80. Another Logsene-specific requirement is to specify the access token for your Logsene app as the Elasticsearch index. You can find that token in your Sematext account, under Services -> Logsene.

The complete output configuration would be:

output {
  elasticsearch {
    hosts => "logsene-receiver.sematext.com:443" # it used to be "host" and "port" pre-2.0
    ssl => "true"
    index => "your Logsene app token goes here"
    manage_template => false
    #protocol => "http" # removed in 2.0
    #port => "443" # removed in 2.0
  }
}

Wrapping Up

To start sending your logs, you’d have to download Logstash and put the three configuration snippets above in a file (let’s say, /etc/logstash/conf.d/logstash.conf). Then start Logstash. Once your logs are in, you can start exploring your data by using Kibana or the native Logsene UI.  Remember, Logsene is free to play with and it frees you up from having to manage your own Elasticsearch cluster.
Video: Using Solr for Logs with Rsyslog, Flume, Fluentd and Logstash

A while ago we published the slides from our talk at Lucene Revolution about using Solr for indexing and searching logs. This topic is of special interest for us, since we’ve released Logsene and we’re also offering consulting services for logging infrastructure. If you’re also into working with search engines or logs, please note that we’re hiring worldwide.

The video for that talk is now available, and you can watch it below. The talk is made of three parts:

  • one that discusses the general concepts of what a log is, structured logging and indexing logs in general, whether it’s Solr or Elasticsearch
  • one that shows how to use existing tools to send logs to Solr: Rsyslog and Fluentd to send structured events (yes, structured syslog!); Apache Flume and Logstash to take unstructured data, make it structured via Morphlines and Grok, and then send it to Solr
  • one that shows how to optimize Solr’s performance for handling logs. From tuning the commit frequency and merge factor to using time-based collections with aliases