Elasticsearch Training in London

3 Elasticsearch Classes in London


es-training-240x187

Elasticsearch for Developers ……. April 4-5

Elasticsearch for Logging ……… April 6

Elasticsearch Operations …….  April 6

All classes cover Elasticsearch 2.x

Hands-on — lab exercises follow each class section

Early bird pricing until February 29

Add a second seat for 50% off

Register_Now_2

Course overviews are on our Elasticsearch Training page.

Want a training in your city or on-site?  Let us know!

Attendees in all three workshops will go through several sequences of short lectures followed by interactive, group, hands-on exercises. There will be Q&A sessions in each workshop after each such lecture-practicum block.

Got any questions or suggestions for the course? Just drop us a line or hit us @sematext!

Lastly, if you can’t make it…watch this space or follow @sematext — we’ll be adding more Elasticsearch training workshops in the US, Europe and possibly other locations in the coming months.  We are also known worldwide for Elasticsearch Consulting Services, and Elasticsearch Production Support.
We hope to see you in London in April!

Elasticsearch “Big Picture” – A Creative Flow Chart and Poster

There are many ways to look at Elasticsearch, but here at Sematext we’re pretty confident that you haven’t seen anything like this flowchart to demonstrate how it works:

ES_poster

Download a copy and print your own Elasticsearch poster!

If you’re looking for something unique to show off your Elasticsearch chops, then download a copy today and print your own.  We have files for US letter, A4, Ledger (11”x17”) and Poster (24”x36”) sizes.

poster_24poster_11poster_letterposter_A4


Sematext is your “one-stop shop” for all things Elasticsearch: Expert Consulting, Production Support, Elasticsearch Training, Elasticsearch Monitoring, even Hosted ELK!

Doing Centralized Logging with ELK?  We Can Help There, Too

If your log analysis and management leave something to be desired, then we’ve got you covered there as well.  There’s our centralized logging solution, Logsene, which you can think of as your “Managed ELK Stack in the Cloud.”   It’s is also available as an On Premises deployment.  Lastly, we offer Logging Consulting should you require more in-depth support.

Questions or Feedback?

If any questions or feedback for us, please contact us by email or hit us on Twitter.

Elasticsearch Training in New York City — October 19-20

[Note: since this workshop has already taken place, stay up to date with future workshops at our Elasticsearch / ELK Stack Training page]

——-

For those of you interested in some comprehensive Elasticsearch and ELK Stack (Elasticsearch / Logstash / Kibana) training taught by experts from Sematext who know them inside and out, we’re running a super hands-on training workshop in New York City from October 19-20.

This two-day, hands-on workshop will be taught by experienced Sematext engineers — and authors of Elasticsearch booksRafal Kuc and Radu Gheorghe.

Target audience:

Developers and DevOps who want to configure, tune and manage Elasticsearch and ELK Stack at scale.

What you’ll get out of it:

In two days with training run by two trainers we’ll:

  • bring Elasticsearch novices to the level where he/she would be comfortable with taking Elasticsearch to production
  • give experienced Elasticsearch users proven and practical advice based on years of experience designing, tuning, and operating numerous Elasticsearch clusters to help with their most advanced and pressing issues

When & Where:

  • Dates:        October 19 & 20 (Monday & Tuesday)
  • Time:         9:00 a.m. — 5:00 p.m.
  • Location:     New Horizons Computer Learning Center in Midtown Manhattan (map)
  • Cost:         $1,200 “early bird rate” (valid through September 1) and $1,500 afterward.  And…we’re also offering a 50% discount for the purchase of a 2nd seat!
  • Food/Drinks: Light breakfast and lunch will be provided

Register_Now_2

Attendees will go through several sequences of short lectures followed by interactive, group, hands-on exercises. There will be a Q&A session after each such lecture-practicum block.

Course outline:

  1. Basic flow of data in Elasticsearch
    1. what is Elasticsearch and typical use-cases
    2. installation
    3. index
    4. get
    5. search
    6. update
    7. delete
  2. Controlling how data is indexed and stored
    1. mappings and mapping types
    2. strings, integers and other core types
    3. _source, _all and other predefined fields
    4. analyzers
    5. char filters
    6. tokenizers
    7. token filters
  3. Searching through your data
    1. selecting fields, sorting and pagination
    2. search basics: term, range and bool queries
    3. performance: filters and the filtered query
    4. match, query string and other general queries
    5. tweaking the score with the function score query
  4. Aggregations
    1. relationships between queries, filters, facets and aggregations
    2. metrics aggregations
    3. multi-bucket aggregations
    4. single-bucket aggregations and nesting
  5. Working with relational data
    1. arrays and objects
    2. nested documents
    3. parent-child relations
    4. denormalizing and application-side joins
  6. Performance tuning
    1. bulk and multiget APIs
    2. memory management: field/filter cache, OS cache and heap sizes
    3. how often to commit: translog, index buffer and refresh interval
    4. how data is stored: merge policies; store settings
    5. how data and queries are distributed: routing, async replication, search type and shard preference
    6. doc values
    7. thread pools
    8. warmers
  7. Scaling out
    1. multicast vs unicast
    2. number of shards and replicas
    3. node roles
    4. time-based indices and aliases
    5. shard allocation
    6. tribe node
  8. Monitor and administer your cluster
    1. mapping and search templates
    2. snapshot and restore
    3. health and stats APIs
    4. cat APIs
    5. monitoring products
    6. hot threads API
  9. Beyond keyword search
    1. percolator
    2. suggesters
    3. geo-spatial search
    4. highlighting
  10. Ecosystem
    1. indexing tools: Logstash, rsyslog, Apache Flume
    2. data visualization: Kibana
    3. cluster visualization: Head, Kopf, BigDesk

Got any questions or suggestions for the course? Just drop us a line or hit us @sematext!

Lastly, if you can’t make it…watch this space or follow @sematext — we’ll be adding more Elasticsearch / ELK stack training workshops in the US, Europe and possibly other locations in the coming months.  We are also known worldwide for our Elasticsearch Consulting Services and Elasticsearch/ELK Production Support, as well as ELK Consulting.

Hope to see you in the Big Apple in October!

New Elasticsearch Reports: Warmers, Thread Pools and Circuit Breakers

Have you read the Top 10 Elasticsearch Metrics to Watch?

How about our free eBook – Elasticsearch Monitoring Essentials?

If you have, we’re impressed. If not, it’s great bedtime reading. 😉

Besides writing bedtime reading material, we also wrote some code last month and added a few new and useful Elasticsearch metrics to SPM.  Specifically, we’ve added:

  • Index Warmer metrics
  • Thread Pool metrics
  • Circuit Breaker metrics

So why are these important?  Read on!

Index Warmers

Warmers do what their name implies.  They warm up. But what? Indices. Why?  Because warming up an index means searches against it will be faster.  Thus, one can warm up indices before exposing searches against them.  If you come to Elasticsearch from Solr, this is equivalent to searcher warmup queries in Solr.
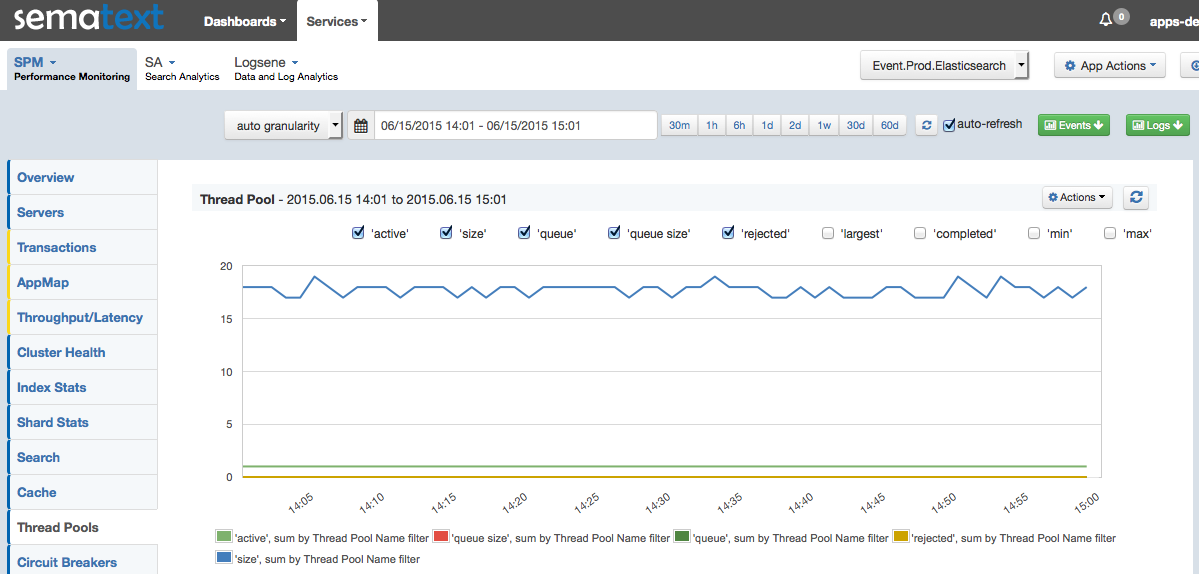
ES_Warmer

Thread Pools

Elasticsearch nodes use a number of dedicated thread pools to handle different types of requests.  For example, indexing requests are handled by a thread pool that is separate from the thread pool that handles search requests.  This helps with better memory management, request prioritization, isolation, etc.  There are over a dozen thread pools, and each of them exposes almost a dozen metrics.

Each pool also has a queue, which makes it possible to hold onto some requests instead of simply dropping them when a node is very busy.  However, if your Elasticsearch cluster handles a lot of concurrent or slow requests, it may sometimes have to start rejecting requests if those thread pool queues are full.  When that starts happening, you will want to know about it ASAP.  Thus, you should pay close attention to thread pool metrics and may want to set Alerts and SPM’s Anomaly Detection Alerts on the metric that shows the number of rejection or queue size, so you can adjust queue size settings, or other parameters to avoid requests being rejected.

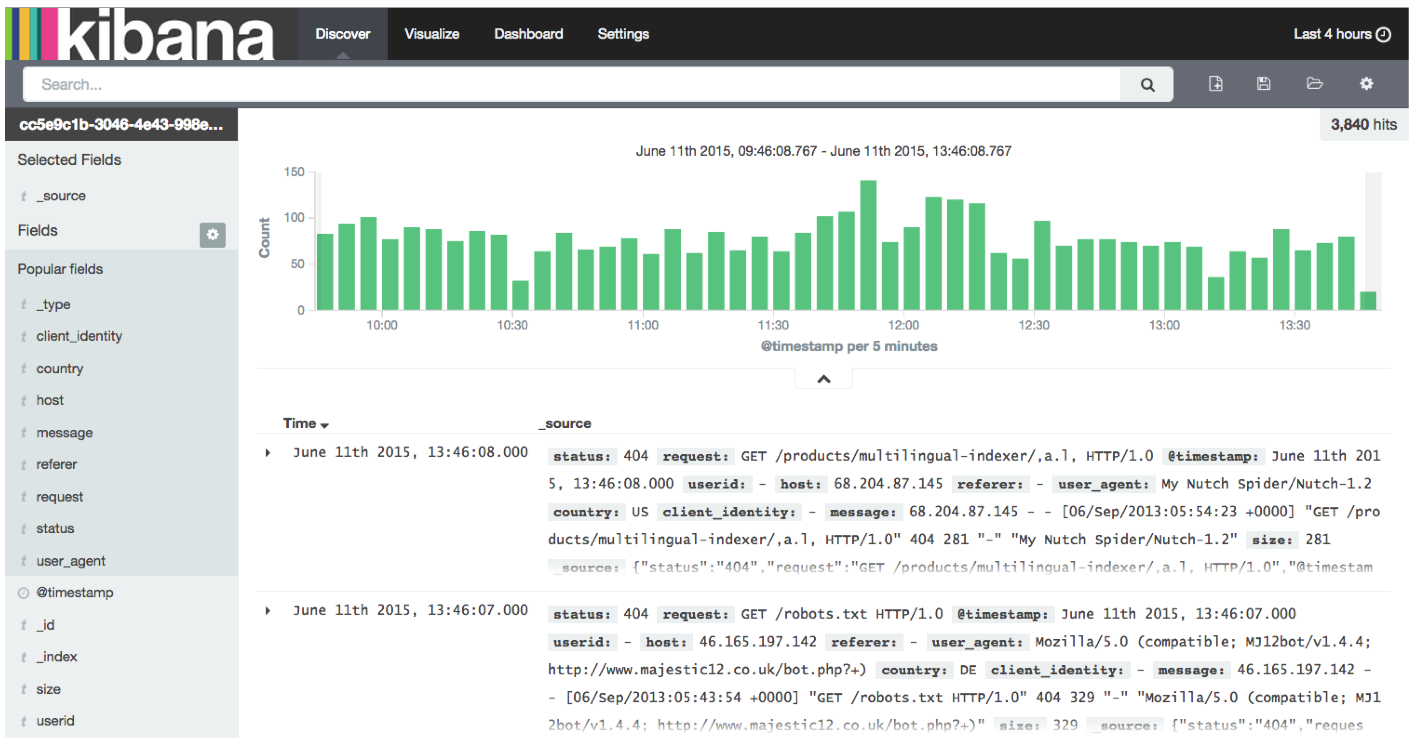
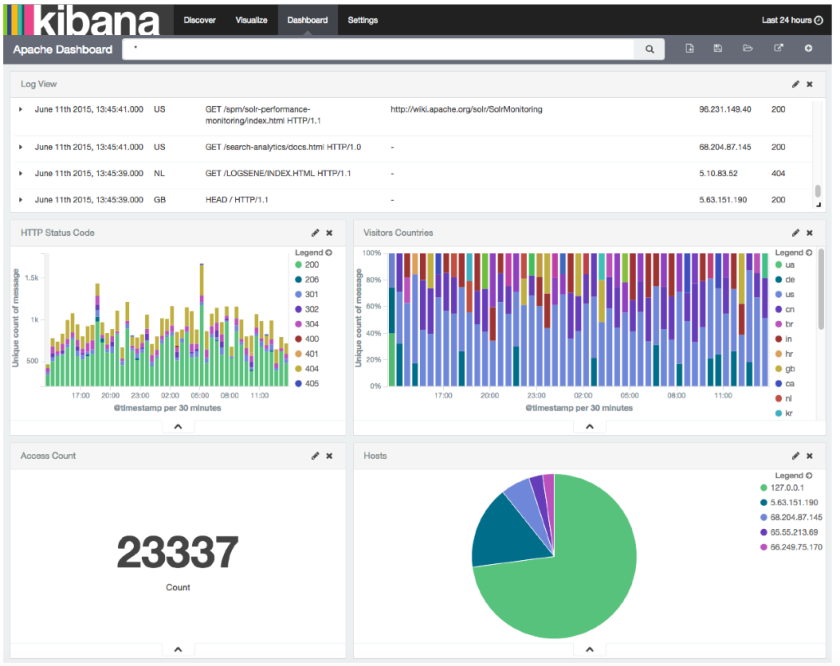
Alternatively, or perhaps additionally, you may want to feed your logs to Logsene.  Elasticsearch can log request rejections (see an example below), so if your ship your Elasticsearch logs to Logsene, you’ll have both Elasticsearch metrics and its logs available for troubleshooting.  Moreover, in Logsene you can create alert queries that alert you about anomalies in your logs, and such alert queries will alert you when Elasticsearch starts logging errors, like the example shown here:

o.es.c.u.c.EsRejectedExecutionException: rejected execution (queue capacity 1000) on org.elasticsearch.search.action.SearchServiceTransportAction$23@5a805c60
at org.elasticsearch.common.util.concurrent.EsAbortPolicy.rejectedExecution(EsAbortPolicy.java:62)
at java.util.concurrent.ThreadPoolExecutor.reject(ThreadPoolExecutor.java:821)
at java.util.concurrent.ThreadPoolExecutor.execute(ThreadPoolExecutor.java:1372)
at org.elasticsearch.search.action.SearchServiceTransportAction.execute(SearchServiceTransportAction.java:509)
at org.elasticsearch.search.action.SearchServiceTransportAction.sendExecuteScan(SearchServiceTransportAction.java:441)
at org.elasticsearch.action.search.type.TransportSearchScanAction$AsyncAction.sendExecuteFirstPhase(TransportSearchScanAction.java:68)
at org.elasticsearch.action.search.type.TransportSearchTypeAction$BaseAsyncAction.performFirstPhase(TransportSearchTypeAction.java:171)
at org.elasticsearch.action.search.type.TransportSearchTypeAction$BaseAsyncAction.start(TransportSearchTypeAction.java:153)
at org.elasticsearch.action.search.type.TransportSearchScanAction.doExecute(TransportSearchScanAction.java:52)
at org.elasticsearch.action.search.type.TransportSearchScanAction.doExecute(TransportSearchScanAction.java:42)
at org.elasticsearch.action.support.TransportAction.execute(TransportAction.java:63)
at org.elasticsearch.action.search.TransportSearchAction.doExecute(TransportSearchAction.java:107)
at org.elasticsearch.action.search.TransportSearchAction.doExecute(TransportSearchAction.java:43)
at org.elasticsearch.action.support.TransportAction.execute(TransportAction.java:63)
at org.elasticsearch.action.search.TransportSearchAction$TransportHandler.messageReceived(TransportSearchAction.java:124)
at org.elasticsearch.action.search.TransportSearchAction$TransportHandler.messageReceived(TransportSearchAction.java:113)

ES_Threadpools

Circuit Breakers

Circuit Breakers are Elasticsearch’s attempt to control memory usage and prevent the dreaded OutOfMemoryError.  There are currently two Circuit Breakers – one for Field Data, the other for Requests.  In short, you can set limits for each of them and prevent excessive memory usage to avoid your cluster blowing up with OOME.

ES_Circuit_Breakers

Want something like this for your Elasticsearch cluster?

Feel free to register here and enjoy all the SPM for Elasticsearch goodness.  There’s no commitment and no credit card required.  And, if you are a young startup, a small or non-profit organization, or an educational institution, ask us for a discount (see special pricing)!

Feedback & Questions

We are happy to answer questions or receive feedback – please drop us a line or get us @sematext.

1-Click ELK Stack: Hosted Kibana 4

We just pushed a new release of Logsene to production, including 1-Click Access to Kibana 4!

Did you know that Logsene provides a complete ELK Stack? Logsene’s indexing and search API is compatible with the Elasticsearch API.  That’s why it is very easy to use Logsene – you can use the existing Logstash Elasticsearch output, point it to Logsene for indexing, and then you can use Kibana and point it to Logsene like it’s your local Elasticsearch cluster.  And not only is this process easy, but Logsene actually adds more functionality to the bare “ELK” stack!  In fact, here is a long list of features the open-source ELK stack just doesn’t have, such as:

  • User Authentication and User Roles
  • Secured communication (TLS/HTTPS)
  • App Sharing: access control for each Logsene App, aka Index
  • Account Sharing: share resources, not passwords
  • Syslog receiver – no need to run Logstash just for forwarding server logs
  • Anomaly detection and Alerts for logs or any indexed data!

Let’s take a look to the Kibana 4 integration. You’ll find the “Kibana 4” button in the Logsene App Overview. Simply click on it and Kibana 4 will load the data from your Logsene App.

KIbana4-LS-OverviewKibana 4 automatically shows the “Discover” view and doesn’t require any setup – Logsene does everything for you! This means you can immediately start to build Queries, Visualizations, and Dashboards!

Kibana4-Discover
Kibana 4 Discover View – displaying data stored in Logsene
Kibana4-Apache-Logs-Dashboard
Simple Demo Dashboard – try it here!

If you prefer to run Kibana and point it to Logsene, yes, you can still do that; we show how to do that in How to use Kibana 4 with Logsene.

If you don’t want to run and manage your own Elasticsearch cluster but would like to use Kibana for log and data analysis, then give Logsene a quick try by registering here – we do all the backend heavy lifting so you can focus on what you want to get out of your data and not on infrastructure.  There’s no commitment and no credit card required.  And, if you are a young startup, a small or non-profit organization, or an educational institution, ask us for a discount (see special pricing)!

We are happy to answer questions or receive feedback – please drop us a line or get us @sematext.

eBook: Elasticsearch Monitoring Essentials

Elasticsearch is booming.  Together with Logstash, a tool for collecting and processing logs, and Kibana, a tool for searching and visualizing data in Elasticsearch (aka the “ELK stack”), adoption of Elasticsearch continues to grow by leaps and bounds. In this detailed (and free!) booklet Sematext DevOps Evangelist, Stefan Thies, walks readers through Elasticsearch and ELK stack basics and supplies numerous graphs, diagrams and infographics to clearly explain what you should monitor, which Elasticsearch metrics you should watch.  We’ve also included the popular “Top 10 Elasticsearch Metrics” list with corresponding explanations and screenshots.  This booklet will be especially helpful to those who are new to Elasticsearch and ELK stack, but also to experienced users who want a quick jump start into Elasticsearch monitoring.

Free_download

Like this booklet?  Please tweet about Performance Monitoring Essentials Booklet – Elasticsearch Edition

Know somebody who’d find this booklet useful?  Please let them know…

When it comes to actually using Elasticsearch, there are tons of metrics generated.  The goal of creating this free booklet is to provide information that we at Sematext have found to be extremely useful in our work as Elasticsearch and ELK stack consultants, production support providers, and monitoring solution builders.

ES_Book_cover

Topics, including our Top 10 Elasticsearch Metrics

Topics addressed in the booklet include: Elasticsearch Vocabulary, Scaling a Cluster, How Indexing Works, Cluster Health – Nodes & Shards, Node Performance, Search Performance, and many others.  And here’s a quick taste of the kind of juicy content you’ll find inside: a dashboard view of our 10 Elasticsearch metrics list.

Top_10_dashboard

This dashboard image, and all images in the booklet, are from Sematext’s SPM Performance Monitoring tool.

Got Feedback? Questions?

Please give our booklet a look and let us know what you think — we love feedback!  You can DM us (and RT and/or follow us, if you like what you read) @sematext, or drop us an email.

And…if you’d like try SPM to monitor Elasticsearch yourself, check out a Free 30-day trial by registering here.  There’s no commitment and no credit card required. Small startups, startups with no or very little outside funding, non-profit and educational institutions get special pricing – just get in touch with us.