Webinar: Docker Logging

[ Note: Click here for the Docker Monitoring webinar video recording and slides. And click here for the Docker Logging webinar video recording and slides. ]

——-

If you use Docker you know that these deployments can be very dynamic, not to mention all the ways there are to monitor Docker containers and their hosts, collect logs from them, etc. etc.  And if you didn’t know these things, well, you’ve come to the right place!

With this pair of identical webinars, we’re going to focus on Docker logging.  Specifically — the different log collection options Docker users have, the pros and cons of each, specific and existing Docker logging solutions, tooling, the role of syslog, log shipping to ELK Stack, and more.  Docker, and with it projects like CoreOS and RancherOS, are growing rapidly, and here at Sematext we’re at the front of the bandwagon when it comes to adding support for Docker monitoring and logging, along with Docker event collection, charting, and correlation.  The same goes for CoreOS monitoring and centralized CoreOS log management, too!

[Note: We’re also holding a Docker Monitoring webinar on October 6]

The webinar will be presented by Stefan Thies, our DevOps Evangelist, deeply involved in Sematext’s activities around monitoring and logging in Docker and CoreOS.  A post-webinar Q&A will take place — in addition to the encouraged attendee interaction during the webinar.

Dates/Times

We’re holding two identical sessions to accommodate attendees on different continents.

Register_Now_2                        Register_Now_2

September 29                                  September 30


“Show, Don’t Tell”

The infographic below will give you a good idea of what Stefan will be showing and discussing in the webinar.

Docker_logging_graphic

Got Questions, or Docker Logging topics you’d like Stefan to address?

Leave a comment, ping @sematext or send us an email — we’re all ears.

Whether you’re using Docker or not, we hope you join us on one of the webinars.  Docker is hot — let us help you take advantage of it!

Webinar: Docker Monitoring

[ Note: Click here for the Docker Monitoring webinar video recording and slides. And click here for the Docker Logging webinar video recording and slides. ]

——-

There are many ways to skin a cat.

If you use Docker you know that these deployments can be very dynamic, not to mention all the ways there are to monitor Docker containers, collect logs from them, etc. etc.  And if you didn’t know these things, well, you’ve come to the right place!

Sematext has been on the forefront of Docker monitoring, along with Docker event collection, charting, and correlation.  The same goes for CoreOS monitoring and CoreOS centralized log management.  So it’s only natural that we’d like to share our experiences and how-to knowledge with the growing Docker and container community.  We’re holding a couple webinars in September to go through a number of different Docker monitoring options, point out their pros and cons, and offer solutions for Docker monitoring.

[Note: We’re also holding webinars on Docker Logging on September 29 and 30.]

The webinar will be presented by Stefan Thies, our DevOps Evangelist, deeply involved in Sematext’s activities around monitoring and logging in Docker and CoreOS.  A post-webinar Q&A will take place — in addition to the encouraged attendee interaction during the webinar.

Dates/Times

We’re holding two identical sessions to accommodate attendees on different continents.

Register_Now_2                        Register_Now_2

September 15                                  September 16


“Show, Don’t Tell”

The infographic below will give you a good idea of what Stefan will be showing and discussing in the webinar.

Docker_webinar_infographic

Got Questions, or topics you’d like Stefan to address?

Leave a comment, ping @sematext, or send us email – we’re all ears.

Whether you’re using Docker or not, we hope you join us on one of the webinars.  Docker is hot — let us help you take advantage of it!

Centralized Log Management and Monitoring for CoreOS Clusters

 Note: Click here for the Docker Monitoring webinar video recording and slides. And click here for the Docker Logging webinar video recording and slides.

SPM Agent for Docker was renamed  “sematext/sematext-agent-docker” on Docker Hub (see Sematext joins Docker ETP program for Logging).  The latest CoreOS service files and instructions are available in the new Github Repository.

——-

If you’ve got an interest in things like CoreOS, logs and monitoring then you should check out our previous CoreOS-related posts on Monitoring Core OS Clusters and how to get CoreOS logs into ELK in 5 minutes.  And they are only the start of SPM integrations with CoreOS!  Case in point: we have recently optimized the SPM setup on CoreOS and integrated a logging gateway to Logsene into the SPM Agent for Docker.  And that’s not all…

In this post we want to share the current state of CoreOS Monitoring and Log Management from Sematext so you know what’s coming — and you know about things that might be helpful for your organization, such as:

  1. Feature Overview
  2. Fleet Units for SPM
  3. How to Set Up Monitoring and Logging Services

1. Feature Overview

  • Quick setup
    • add monitoring and logging for the whole cluster in 5 minutes
  • Collection Performance Metrics for the CoreOS Cluster
    • Metrics for all CoreOS cluster nodes (hosts)
      • CPU, Memory, Disk usage
    • Detailed metrics for all containers on each host
      • CPU, Memory, Limits, Failures, Network and Disk I/O, …
    • Anomaly detection and alerts for all metrics
    • Anomaly detection and alerts for all logs
  • Correlated Container Events, Metrics and Logs
    • Docker Events like start/stop/destroy are related to deployments, maintenance or sometimes to errors and unwanted restarts;  correlation of metrics, events and logs is the natural way to discover problems using SPM.

Docker Events

  • Centralized configuration via etcd
    • There is often a mix of configurations in environment variables, static settings in cloud configuration files, and combinations of confd and etcd. We decided to have all settings stored in etcd, so the settings are done only once and are easy to access.
  • Automatic Log Collection
    • Logging gateway Integrated into SPM Agent
      • SPM Agent for Docker includes a logging gateway service to receive log message via TCP.  The service discovery is solved via etcd (where the exposed TCP is stored). All received messages are parsed, and the following formats are supported:
        • journalctl -o short | short-iso | json
        • integrated messages parser (e.g. for dockerd time, level and message text)
        • line delimited JSON
        • plain text messages
        • In cases where the parsing fails, the gateway adds a timestamp and keeps the message 1:1.
      • The logging gateway can be configured with the Logsene App Token – this makes it compatible with most Unix tools e.g. journalctl -o json -n 10 | netcat localhost 9000
      • SPM for Docker collects all logs from containers directly from the Docker API. The logging gateway is typically used for system logs – or anything else configured in journald (see “Log forwarding service” below)
      • The transmission to Logsene receivers is encrypted via HTTPS.
    • Log forwarding service
      • The log forwarding service streams logs to the logging gateway by pulling them from journald. In addition, it saves the ‘last log time’ to recover after a service restart. Most people take this for granted; but not all logging services have such a recovery function.  There are many tools which just capture the current log stream. Often people realize this only when they miss logs one day because of a reboot, network outage, software update, etc.  But these are exactly the types of situations where you would like to know what is going on!
SPM integrations into CoreOS

2. Fleet Units for SPM

SPM agent services are installed via fleet (a distributed init system) in the whole cluster. Lets see those unit files before we fire them up into the Cloud.

The first unit file sematext-agent.service starts SPM Agent for Docker. It takes the SPM and Logsene app tokens and port for the logging gateway etcd. It starts on every CoreOS host (global unit).

spm-agent.service
Fleet Unit File – SPM Agent incl. Log Gateway: spm-agent.service

The second unit file logsene-service.service forwards logs from journald to that logging gateway running as part of sematext-agent-docker. All fields stored in the journal (down to source-code level and line numbers provided by GO modules) are then available in Logsene.

logsene-service
Fleet Unit File – Log forwarder: logsene.service

3. Set Up Monitoring and Logging Services

Preparation:

  1. Get a free account apps.sematext.com
  2. Create an SPM App of type “Docker” and copy the SPM Application Token
  3. Store the configuration in etcd
# PREPARATION
# set your application tokens for SPM and Logsene
export $SPM_TOKEN=YOUR-SPM-TOKEN
export $LOGSENE_TOKEN=YOUR-LOGSENE-TOKEN
# set the port for the Logsene Gateway
export $LG_PORT=9000
# Store the tokens in etcd
# please note the same key is used in the unit file!
etcdctl set /sematext.com/myapp/spm/token $SPM_TOKEN
etcdctl set /sematext.com/myapp/logsene/token $LOGSENE_TOKEN
etcdctl set /sematext.com/myapp/logsene/gateway_port $LG_PORT
 

Download the fleet unit files and start the service via fleetclt

# INSTALLATION
# Download the unit file for SPM
wget https://raw.githubusercontent.com/sematext/sematext-agent-docker/master/coreos/sematext-agent.service
# Start SPM Agent in the whole cluster
fleetctl load spm-agent.service; fleetctl start spm-agent.service
# Download the unit file for Logsene
wget https://raw.githubusercontent.com/sematext/sematext-agent-docker/master/coreos/logsene.service
# Start the log forwarding service
fleetctl load logsene.service; fleetctl start logsene.service

Check the installation

systemctl status sematext-agent.service
systemctl status logsene.service

Send a few log lines to see them in Logsene.

journalctl -o json -n 10 | ncat localhost 9000

After about a minute you should see Metrics in SPM and Logs in Logsene.

Core-OS-BEV
Cluster Health in ‘Birds Eye View’
docker-overview-2
Host and Container Metrics Overview for the whole cluster
logs
Logs and Metrics

Open-Source Resources

Some of the things described here are open-sourced:

Summary – What this gets you

Here’s what this setup provides for you:

  • Operating System metrics of each CoreOS cluster node
  • Container and Host Metrics on each node
  • All Logs from Docker containers and Hosts (via journald)
  • Docker Events from all nodes
  • CoreOS logs from all nodes

Having this setup allows you to take the full advantage of SPM and Logsene by defining intelligent alerts for metrics and logs (delivered via channels like e-mail, PagerDuty, Slack, HipChat or any WebHook), as well as making correlations between performance metrics, events, logs, and alerts.

Running CoreOS? Need any help getting CoreOS metrics and/or logs into SPM & Logsene?  Let us know!  Oh, and if you’re a small startup — ping @sematext — you can get a good discount on both SPM and Logsene!

Monitoring CoreOS Clusters

UPDATE: Related to monitoring CoreOS clusters, we have recently optimized the SPM setup on CoreOS and integrated a logging gateway to Logsene into the SPM Agent for Docker.  You can read about it in Centralized Log Management and Monitoring for CoreOS Clusters

——-

[ Note: Click here for the Docker Monitoring webinar video recording and slides. And click here for the Docker Logging webinar video recording and slides. ]

In this post you’ll learn how to get operational insights (i.e. performance metrics, container events, etc.) from CoreOS and make that super simple with etcd, fleet, and SPM.

We’ll use:

  • SPM for Docker to run the monitoring agent as a Docker container and collect all Docker metrics and events for all other containers on the same host + metrics for hosts
  • fleet to seamlessly distribute this container to all hosts in the CoreOS cluster by simply providing it with a fleet unit file shown below
  • etcd to set a property to hold the SPM App token for the whole cluster

The Big Picture

Before we get started, let’s take a step back and look at our end goal.  What do we want?  We want charts with Performance Metrics, we want Event Collection, we’d love integrated Anomaly Detection and Alerting, and we want that not only for containers, but also for hosts running containers.  CoreOS has no package manager and deploys services in containers, so we want to run the SPM agent in a Docker container, as shown in the following figure:

SPM_for_Docker

By the end of this post each of your Docker hosts could look like the above figure, with one or more of your own containers running your own apps, and a single SPM Docker Agent container that monitors all your containers and the underlying hosts.

Continue reading “Monitoring CoreOS Clusters”

Docker Events and Docker Metrics Monitoring

[ Note: Click here for the Docker Monitoring webinar video recording and slides. And click here for the Docker Logging webinar video recording and slides. ]

——-

Docker deployments can be very dynamic with containers being started and stopped, moved around the YARN or Mesos-managed clusters, having very short life spans (the so-called pets) or long uptimes (aka cattle).  Getting insight into the current and historical state of such clusters goes beyond collecting container performance metrics and sending alert notifications.  If a container dies or gets paused, for example, you may want to know about it, right?  Or maybe you’d want to be able to see that a container went belly up in retrospect when troubleshooting, wouldn’t you?

Just two weeks ago we added Docker Monitoring (docker image is right here for your pulling pleasure) to SPM.  We didn’t stop there — we’ve now expanded SPM’s Docker support by adding Docker Event collection, charting, and correlation.  Every time a container is created or destroyed, started, stopped, or when it dies, spm-agent-docker captures the appropriate event so you can later see what happened where and when, correlate it with metrics, alerts, anomalies — all of which are captured in SPM — or with any other information you have at your disposal.  The functionality and the value this brings should be pretty obvious from the annotated screenshot below.

Like this post?  Please tweet about Docker Events and Docker Metrics Monitoring

Know somebody who’d find this post useful?  Please let them know…

Bildschirmfoto 2015-06-24 um 13.56.39

Here’s the list of Docker events SPM Docker monitoring agent currently captures:

  • Version Information on Startup:
    • server-info – created by spm-agent framework with node.js and OS version info on startup
    • docker-info – Docker Version, API Version, Kernel Version on startup
  • Docker Status Events:
    • Container Lifecycle Events like
      • create, exec_create, destroy, export
    • Container Runtime Events like
      • die, exec_start, kill, oom, pause, restart, start, stop, unpause

Every time a Docker container emits one of these events spm-agent-docker will capture it in real-time, ship it over to SPM, and you’ll be able to see it as shown in the above screenshot.

Oh, and if you’re running CoreOS, you may also want to see how to index CoreOS logs into ELK/Logsene. Why? Because then you can have not only metrics and container events in one place, but also all container and application logs, too!

If you’re using Docker, we hope you find this useful!  Anything else you’d like us to add to SPM (for Docker or any other integration)?  Leave a comment, ping @sematext, or send us email – tell us what you’d like to get for early Christmas!

Get CoreOS Logs into ELK in 5 Minutes

Update: We have recently optimized the SPM setup on CoreOS and integrated a logging gateway to Logsene into the SPM Agent for Docker.  Please follow the setup instructions in Centralized Log Management and Monitoring for CoreOS Clusters


[ Note: Click here for the Docker Monitoring webinar video recording and slides. And click here for the Docker Logging webinar video recording and slides. ]

CoreOS Linux is the operating system for “Super Massive Deployments”.  We wanted to see how easily we can get CoreOS logs into Elasticsearch / ELK-powered centralized logging service. Here’s how to get your CoreOS logs into ELK in about 5 minutes, give or take.  If you’re familiar with CoreOS and Logsene, you can grab CoreOS/Logsene config files from Github. Here’s an example Kibana Dashboard you can get in the end:

CoreOS Kibana Dashboard

CoreOS is based on the following:

  • Docker and rkt for containers
  • systemd for startup scripts, and restarting services automatically
  • etcd as centralized configuration key/value store
  • fleetd to distribute services over all machines in the cluster. Yum.
  • journald to manage logs. Another yum.

Amazingly, with CoreOS managing a cluster feels a lot like managing a single machine!  We’ve come a long way since ENIAC!

There’s one thing people notice when working with CoreOS – the repetitive inspection of local or remote logs using “journalctl -M machine-N -f | grep something“.  It’s great to have easy access to logs from all machines in the cluster, but … grep? Really? Could this be done better?  Of course, it’s 2015!

Here is a quick example that shows how to centralize logging with CoreOS with just a few commands. The idea is to forward the output of “journalctl -o short” to Logsene‘s Syslog Receiver and take advantage of all its functionality – log searching, alerting, anomaly detection, integrated Kibana, even correlation of logs with Docker performance metrics — hey, why not, it’s all available right there, so we may as well make use of it all!  Let’s get started!

Preparation:

1) Get a list of IP addresses of your CoreOS machines

fleetctl list-machines

2) Create a new Logsene App (here)
3) Change the Logsene App Settings, and authorize the CoreOS host IP Addresses from step 1) (here’s how/where)

Congratulations – you just made it possible for your CoreOS machines to ship their logs to your new Logsene app!
Test it by running the following on any of your CoreOS machines:

journalctl -o short -f | ncat --ssl logsene-receiver-syslog.sematext.com 10514

…and check if the logs arrive in Logsene (here).  If they don’t, yell at us @sematext – there’s nothing better than public shaming on Twitter to get us to fix things. 🙂

Create a fleet unit file called logsene.service

[Unit]
Description=Logsene Log Forwarder

[Service]
Restart=always
RestartSec=10s
ExecStartPre=/bin/sh -c "if [ -n \"$(etcdctl get /sematext.com/logsene/`hostname`/lastlog)\" ]; then  echo \"Value Exists: /sematext.com/logsene/`hostname`/lastlog $(etcdctl get /sematext.com/logsene/`hostname`/lastlog)\"; else etcdctl set /sematext.com/logsene/`hostname`/lastlog\"`date +\"%Y-%%m-%d %%H:%M:%S\"`\"; true; fi"
ExecStart=/bin/sh -c "journalctl --since \"$(etcdctl get /sematext.com/logsene/`hostname`/lastlog)\" -o short -f | ncat --ssl logsene-receiver-syslog.sematext.com  10514"
ExecStopPost=/bin/sh -c "export D=\"`date +\"%Y-%%m-%%d %%H:%M:%S\"`\"; /bin/etcdctl set /sematext.com/logsene/$(hostname)/lastlog \"$D\""

[Install]
WantedBy=multi-user.target

[X-Fleet]
Global=true

Activate cluster-wide logging to Logsene with fleet

To start logging to Logsene from all machines activate logsene.service:

fleetctl load logsene.service
fleetctl start logsene.service

There.  That’s all there is to it!  Hope this worked for you!

At this point all your CoreOS logs should be going to Logsene.  Now you have a central place to see all your CoreOS logs.  If you want to send your app logs to Logsene, you can do that, too — anything that can send logs via Syslog or to Elasticsearch can also ship logs to Logsene. If you want some Docker containers & host monitoring to go with your CoreOS logs, just pull spm-agent-docker from Docker Registry.  Enjoy!

Docker Monitoring Support

[ Note: Click here for the Docker Monitoring webinar video recording and slides. And click here for the Docker Logging webinar video recording and slides. ]

——-

Containers and Docker are all the rage these days.  In fact, containers — with Docker as the leading container implementation — have changed how we deploy systems, especially those comprised of micro-services. Despite all the buzz, however, Docker and other containers are still relatively new and not yet mainstream. That being said, even early Docker adopters need a good monitoring tool, so last month we added Docker monitoring to SPM.  We built it on top of spm-agent – the extensible framework for Node.js-based agents and ended up with sematext-agent-docker.

Monitoring of Docker environments is challenging. Why? Because each container typically runs  a single process, has its own environment, utilizes virtual networks, or has various methods of managing storage. Traditional monitoring solutions take metrics from each server and application they run. These servers and the applications running on them are typically very static, with very long uptimes. Docker deployments are different: a set of containers may run many applications, all sharing the resources of a single host. It’s not uncommon for Docker servers to run thousands of short-term containers (e.g., for batch jobs) while a set of permanent services runs in parallel.  Traditional monitoring tools not used to such dynamic environments are not suited for such deployments. SPM, on the other hand, was built with this in mind.  Moreover, container resource sharing calls for stricter enforcement of resource usage limits, an additional issue you must watch carefully. To make appropriate adjustments for resource quotas you need good visibility into any limits containers have reached or errors they have caused. We recommend using alerts according to defined limits; this way you can adjust limits or resource usage even before errors start happening.

How do we get a detailed metrics of each container?

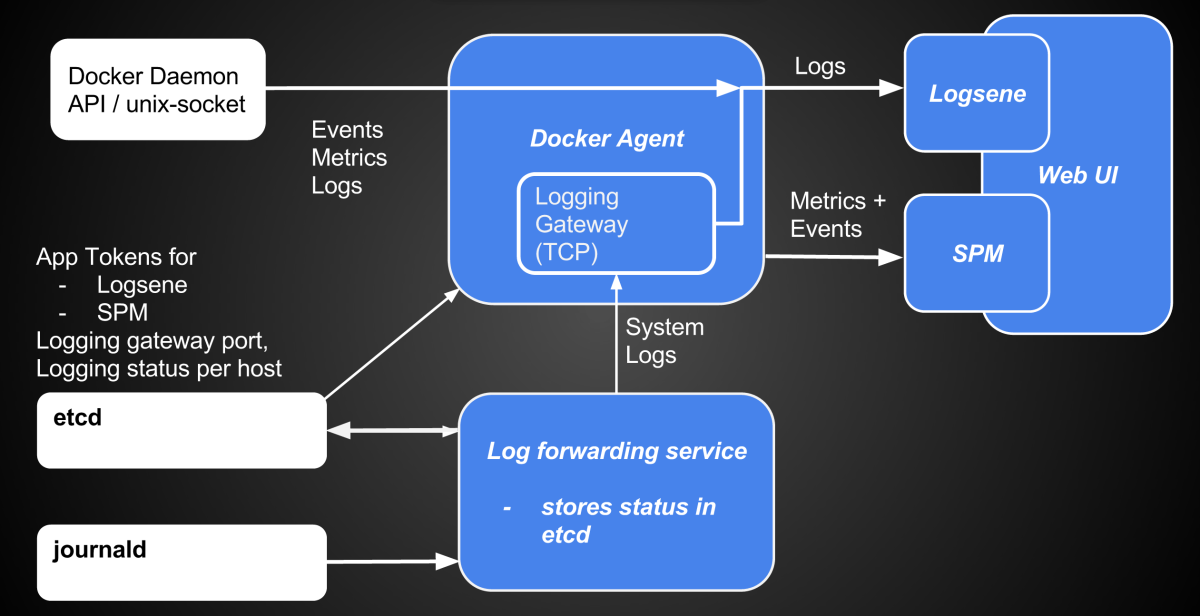
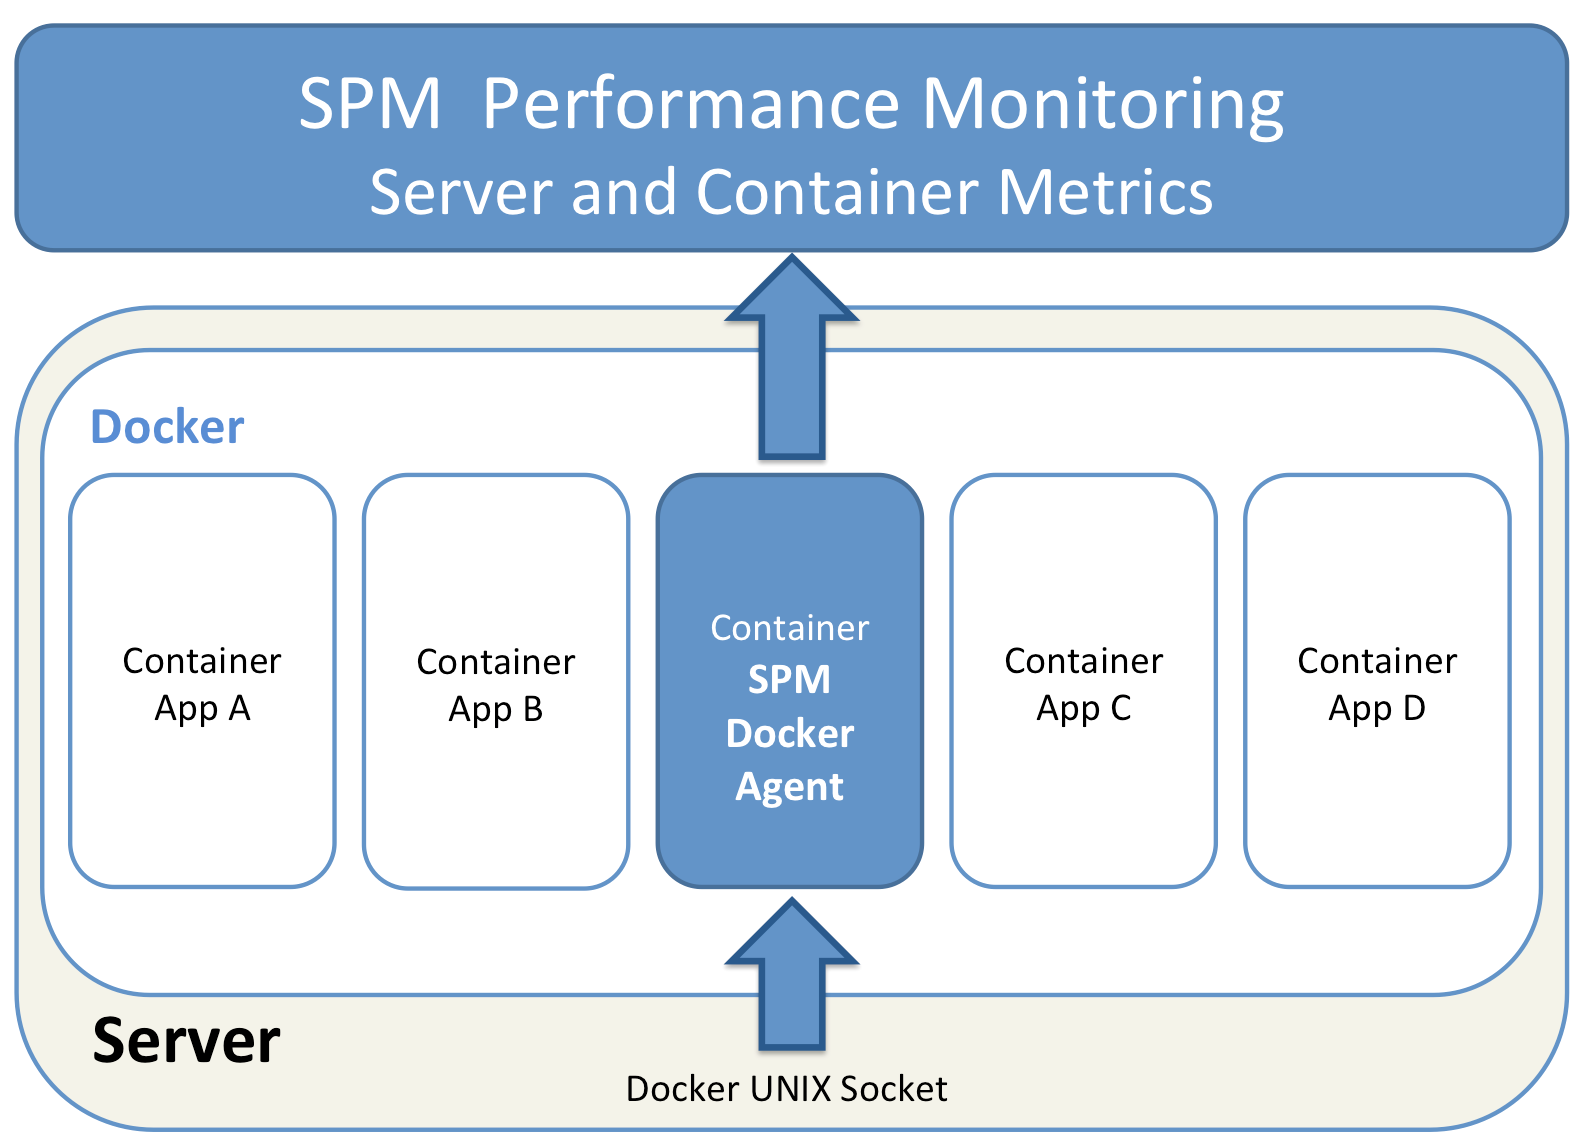
Docker provides a remote interface for container stats (by default exposed via UNIX domain socket). The SPM agent for Docker uses this interface to collect Docker metrics.

SPM for Docker

SPM Docker Agent monitoring other containers, itself running in a Docker container

How to deploy monitoring for Docker

There are several ways one can run a Docker monitor, including:

  1. run it directly on the host machine (“Server” in the figure above)
  2. run one agent for multiple servers
  3. run agent in a container (along containers it monitors) on each server

SPM uses approach 3), aka the “Docker Way”. Thus, SPM for Docker is provided as a Docker Image. This makes the installation easy, requires no installation of dependencies on the host machine compared to approach 1), and it requires no configuration of a server list to support multiple Docker servers.

How to install SPM for Docker

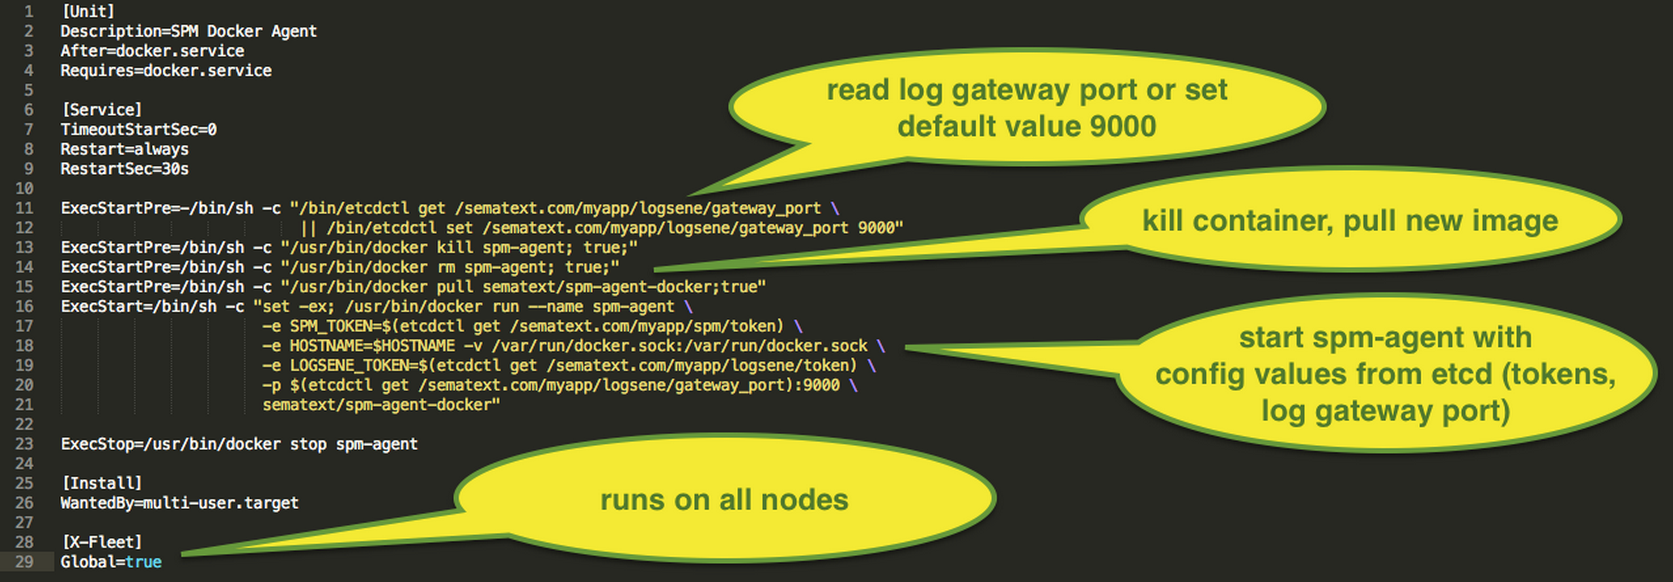
It’s very simple: Create an SPM App of type “Docker” to get the SPM application token (for $TOKEN, see below), and then run:

  1. docker pull sematext/sematext-agent-docker and
  2. docker run -d  -v /var/run/docker.sock:/var/run/docker.sock -e SPM_TOKEN=$TOKEN sematext/sematext-agent-docker

You’ll see your Docker metrics in SPM after about a minute.

SPM for Docker – Features

If you already know SPM then you’re aware that each SPM integration supports all SPM features.  If, however, you are new to SPM, this summary will help:

  1. Out-of-the-box Dashboards and unlimited custom Dashboards
  2. Multi-user support with role-based access control, application and account sharing
  3. Threshold-based Alerts on all metrics mentioned above including Custom Metrics
  4. Machine learning-based Anomaly Detection on all metrics, including Custom Metrics
  5. Alerting via email, PagerDuty, Nagios and Webhooks  (e.g. Slack, HipChat)
  6. Email subscriptions for scheduled Performance Reports
  7. Secure sharing of graphs and reports with your team, or with the public
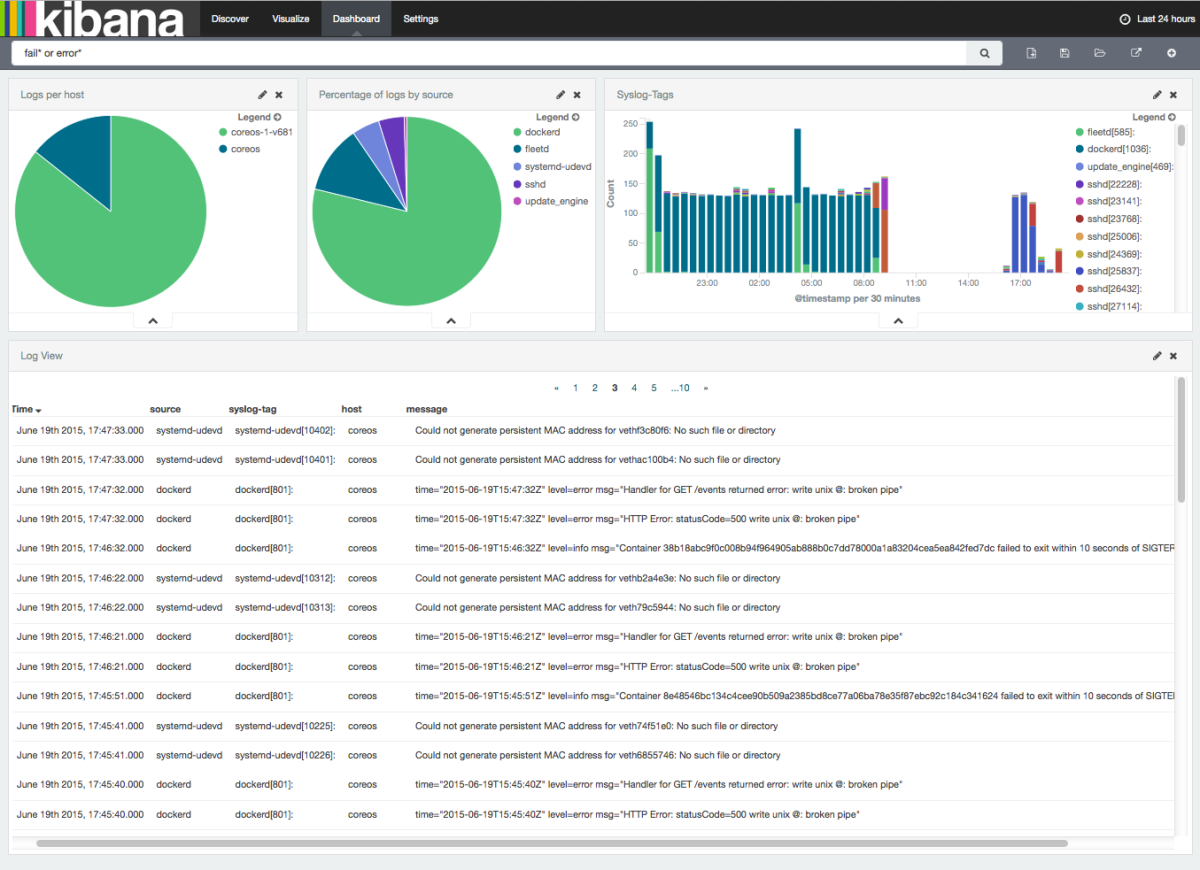
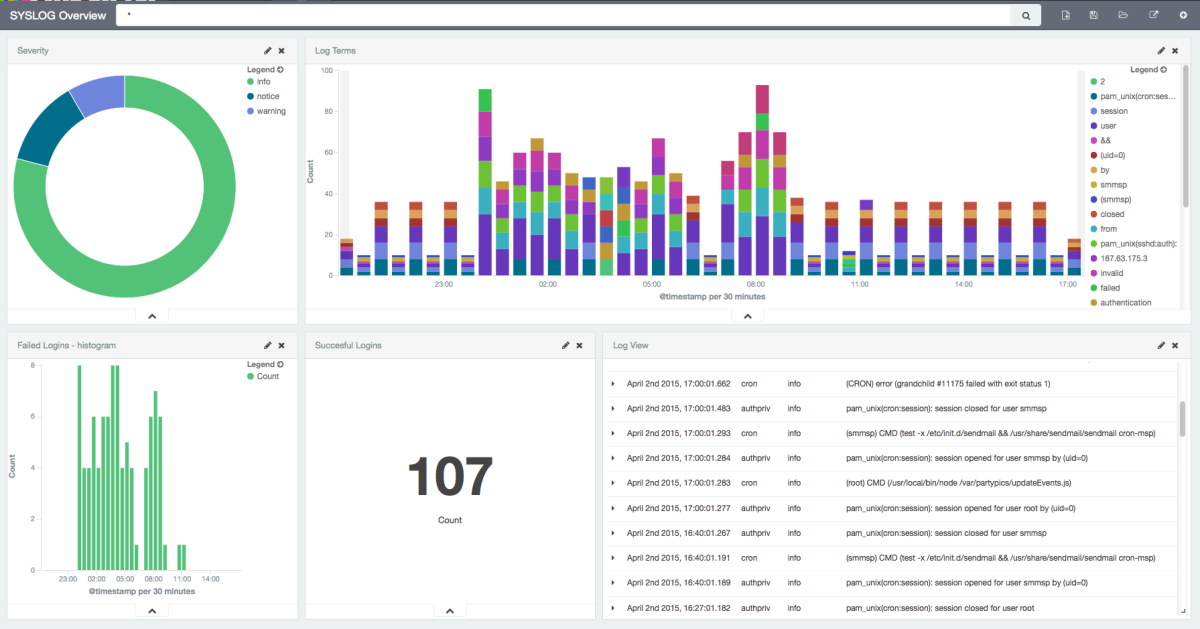
  8. Correlation with logs shipped to Logsene
  9. Charting and correlation with arbitrary Events

Let’s continue with the Docker-specific part:

  1. Easy to install docker agent
  2. Monitoring of multiple Docker Hosts and unlimited number of Containers per ‘SPM Docker App’
  3. Predefined Dashboards for all Host and Container metrics
  • OS Metrics of the Docker Host
  • Detailed Container Metrics
    • CPU
    • Memory
    • Network
    • I/O Metrics
  • Limits of Resource Usage
    • CPU throttled times
    • Memory limits
  • Fail counters (e.g., for memory allocation and network packets)
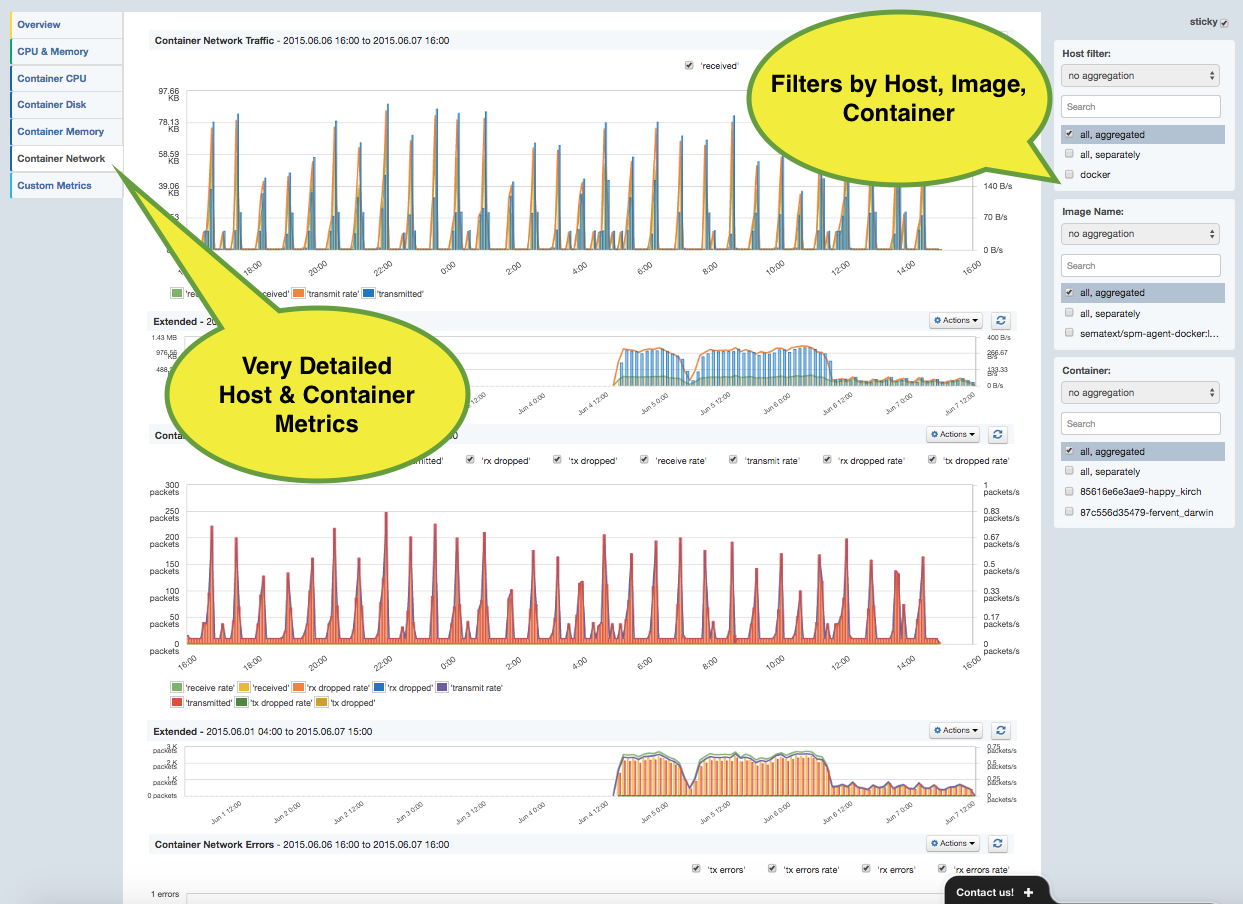
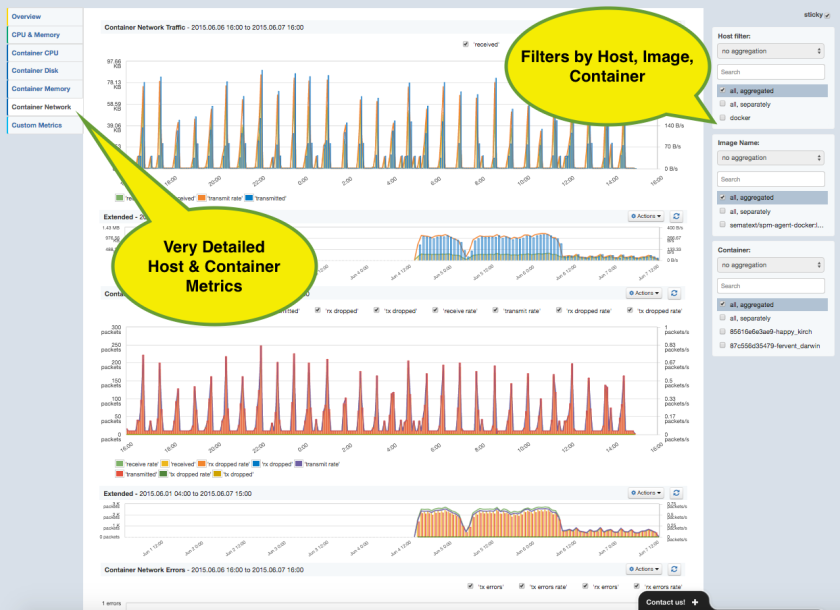
  • Filter and aggregations by Hosts, Images, Container IDs, and Tags

docker-overview-2
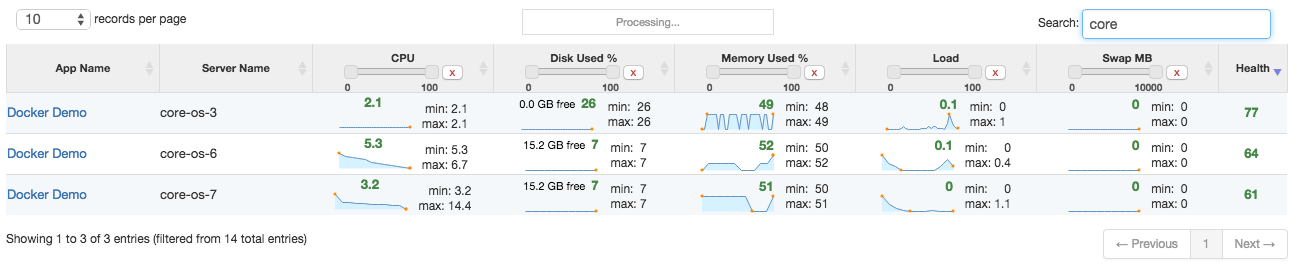
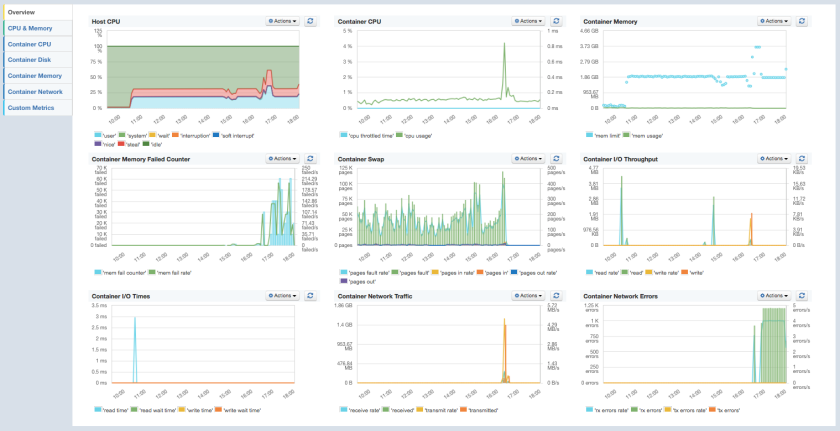
SPM for Docker – Predefined Dashboard ‘Overview’

Containerized applications typically communicate with other applications via the exposed network ports; that’s why network metrics are definitely on the hot list of metrics to watch for Docker and a reason to provide such detailed Reports in SPM:

Docker-Network-Metrics

Did you enjoy this little excursion on Docker monitoring? Then it’s time to practice it!

We appreciate feedback of early adopters, so please feel free to drop us a line, DM us on Twitter @sematext or chat with us using the web chat in SPM or on our homepage — we are here to get your monitoring up and running.  If you are a startup, get in touch – we offer discounts for startups!

How to use Kibana 4 with Logsene Log Management

Did you know that Logsene provides a complete ELK Stack; i.e., a complete Log management, analytics, exploration, and visualization solution? Logsene currently supports Kibana 3 with complete Kibana 4 support about to be released soon.

Can’t wait to use Kibana 4 with Logsene? No problem – part of the integration is already done and we’ve prepared instructions to run your own Kibana 4 with Logsene:

  • Open Kibana 4 configuration file config/kibana.yml and add Logsene server and Kibana-Index:
    elasticsearch_url: “https://logsene-receiver.sematext.com”
    kibana_index: “LOGSENE_TOKEN_kibana
  • Start Kibana 4 (./bin/kibana) and open the web browser http://localhost:5601 – Kibana 4 asks for an index pattern. Here you need to enter the Logsene token and a daily date pattern separated by an underscore:
    [YOUR-LOGSENE-TOKEN_]YYYY-MM-DD
  • Enter Kibana Index-PatternNow you are ready to set up your visualizations and dashboards in Kibana 4:
Kibana4-Logsene-Syslog
Kibana 4 Dashboard for data stored in Logsene

Perhaps you prefer automation of tasks? We prepared it for you:

That’s all there is to it.  Like what you see here?  Sound like something that could benefit your organization?  Then try Logsene for Free by registering here.  There’s no commitment and no credit card required.  And, if you are a young startup, a small or non-profit organization, or an educational institution, ask us for a discount (see special pricing)!

We are happy answer questions or receive feedback – please drop us a line or get us @sematext.