Coming to you from the recent DevOps Days event in Warsaw and delivered by Sematext engineer Rafal Kuć, “Running High Performance and Fault Tolerant Elasticsearch Clusters on Docker” is chock full of practical information that will no doubt answer many of the questions you might have about this process.
Docker Swarm is a cluster manager for Docker. When accessed via the Docker API by Docker API Clients or Docker command line tools, a Docker Swarm cluster looks just like a single Docker Host. Docker Swarm distributes containers to multiple nodes using various deployment strategies in the cluster scheduler.
Having in mind that a Swarm cluster looks like a single Docker Host from the API point of view, it should be very easy to monitor Docker Swarm with existing Docker monitoring tools! Connecting a monitoring agent to the Swarm Master API endpoint should do the job, right? The Sematext Docker Agent could simply collect all container metrics, events and all logs from the Swarm Master – should be a piece of cake. Hm, but could there a gotcha? It turns out there is more than one:
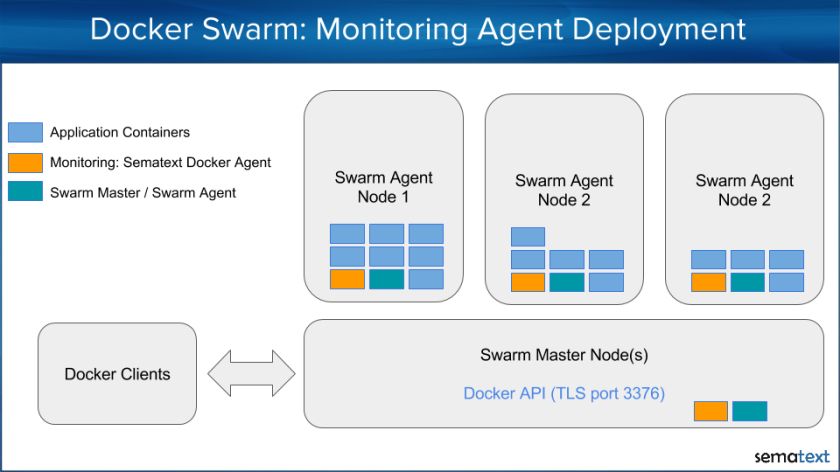
If we deploy a single monitoring agent to the master node, it would miss host metrics for all other nodes because the Docker API doesn’t provide any host metrics. We could also not see how much memory, disk space or CPU the Docker Swarm node itself consumes. Solution: deploy the monitoring agents to each node for collecting the metrics locally.
Assuming a larger cluster with a high volume of logs, events and metrics to collect, a single monitoring agent connected to the the master node would need to handle all operational data of the cluster. This would work for a small cluster but such an architecture would obviously be destined for failure on larger clusters. Guess what the solution is? It’s much better having an agent running on each node and distributing the monitoring and logging work over all nodes. If you do it right from the beginning, there is no need to change the deployment strategy later, when the cluster scales out.
Monitoring container running on each Docker node
In the following example we assume that the master and agent nodes have the UNIX socket enabled in Docker daemon settings. This can be achieved by using –engine-env ‘DOCKER_OPTS=”-H unix:///var/run/docker.sock”‘ in the docker-machine create command. Use this Github Gist to create a Docker-Swarm Cluster with with enabled UNIX sockets. Later, we will see this helps simplify the deployment of any tool that needs to connect to the local Docker daemon – including monitoring and logging containers.
Let’s see how to deploy Sematext Agent to each node in a Docker Swarm Cluster with UNIX socket enabled in Docker-Daemon as just described.
When we started to work on Swarm Monitoring our first question was “Does Docker Swarm provide a deployment strategy for running exactly one instance of a service on each node?” We checked the documentation, but no dice. We found strategies like “spread, binpack, and random” (see https://docs.docker.com/swarm/scheduler/strategy/), but none of them would guarantee exactly one instance of a service on each node. The “spread” strategy spreads the containers evenly over all hosts. The “binpack” strategy fills up one node after another with containers, while “random” spreads containers randomly to nodes. There was seemingly no strategy suitable for monitoring services running only once on each node.
So how can we distribute the monitoring container to each host using Docker Swarm instead of bash script iterating over all nodes? It turns out it’s possible to define an affinity to ensure that containers that should run on the same host are scheduled together. In our case we use “anti-affinity” in the deployment strategy, which instructs Swarm not to deploy the container with Sematext Agent to hosts that already have that container running. In other words, it tells Docker Swarm to run no more than one Sematext Agent container on each Docker host. To do that we define a docker-compose.yml file with the “anti-affinity” specified in the container environment section:
Finally, we use the docker-compose command to scale out the Sematext Docker Agent and deploy it to all Swarm cluster nodes. To do that we run:
eval $(docker-machine env swarm-master --swarm)
docker-compose up -d # scale is == num nodesdocker-compose scale sematext-agent=$(docker-machine ls | grep swarm | grep Running | wc -l)
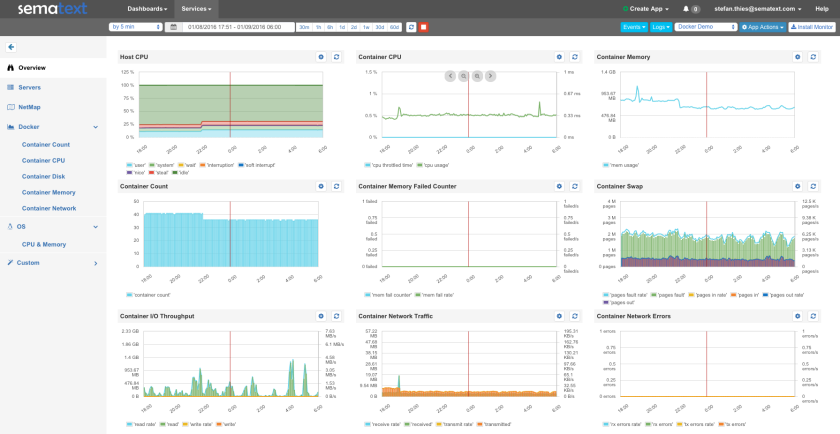
After running the above commands, Sematext Docker Agent will be running on each node and within a minute you will receive Host and Container Metrics for all containers, all their Logs and all Docker events from all nodes in your Docker Swarm cluster. Complete visibility!
Aggregated Metrics from all Docker Swarm nodes
Please note there are many ways to create a Swarm cluster and you might have another setup, such as:
TLS secured Docker daemon and no possibility to activate the unix socket: In this situation you have to deal with the existing Docker daemon setup, which typically uses TLS and authentication via certificates (for example, if you followed Docker’s instructions to create Swarm clusters using Docker-Machine). When the Docker socket is secured with TLS, each client – including Sematext Docker Agent – needs the certificates for authentication. This involves a bunch of parameters such as “DOCKER_HOST”, “DOCKER_CERT_PATH”, “DOCKER_TLS_VERIFY” and mounting of the certificate into the container. In addition we should know to which Docker daemon the agent should be connected (typically port 2375 for TCP, 2376 for TLS on each node and port 3376 on Swarm Master nodes for the Swarm API). We made this scenario easy with a deployment script for the Sematext Agent with TLS options provided by Docker-Machine.
You use CoreOS to run Docker Swarm: In this case you could use fleet and systemd to distribute the agent to each node (simply install Sematext Agent with these instructions)
The deployment methods above should work for other monitoring tools or logging containers as well because most of such tools need to run on each node to collect the metrics locally.
If you have questions or special needs for monitoring more complex setups feel free to contact us. The Sematext Docker Agent is a turnkey-solution for Docker Logs, Metrics and Events – sign up here and give it a try (30-days free trial, no credit card needed).
Sematext has just been recognized by Docker as an Ecosystem Technology Partner (ETP) for logging. This designation indicates that Logsene has contributed to the logging driver and is available to users and organizations that seek solutions to capture logging data for monitoring their Dockerized distributed applications.
Log Management for Docker
“Sematext brings years of logging and monitoring expertise to the Docker community,” said Nick Stinemates, Head of Business Development and Technical Alliances at Docker. “As an active participant in the Docker community, Sematext has provided logging solutions like Logsene and SPM for Docker, and contributed valuable user education and resources through informative webinars and blogs.”
Logsene & Docker
Logsene is a centralized logging, alerting and anomaly detection solution, available in the Cloud and On Premises. Logsene delivers critical operational and business insights from data generated by Docker containers, applications and servers, and other devices. Some DevOps engineers even think of Logsene as “ELK Stack on steroids.” Logsene also integrates seamlessly with SPM, a performance monitoring, alerting and anomaly detection tool for Docker and many other platforms used by DevOps teams.
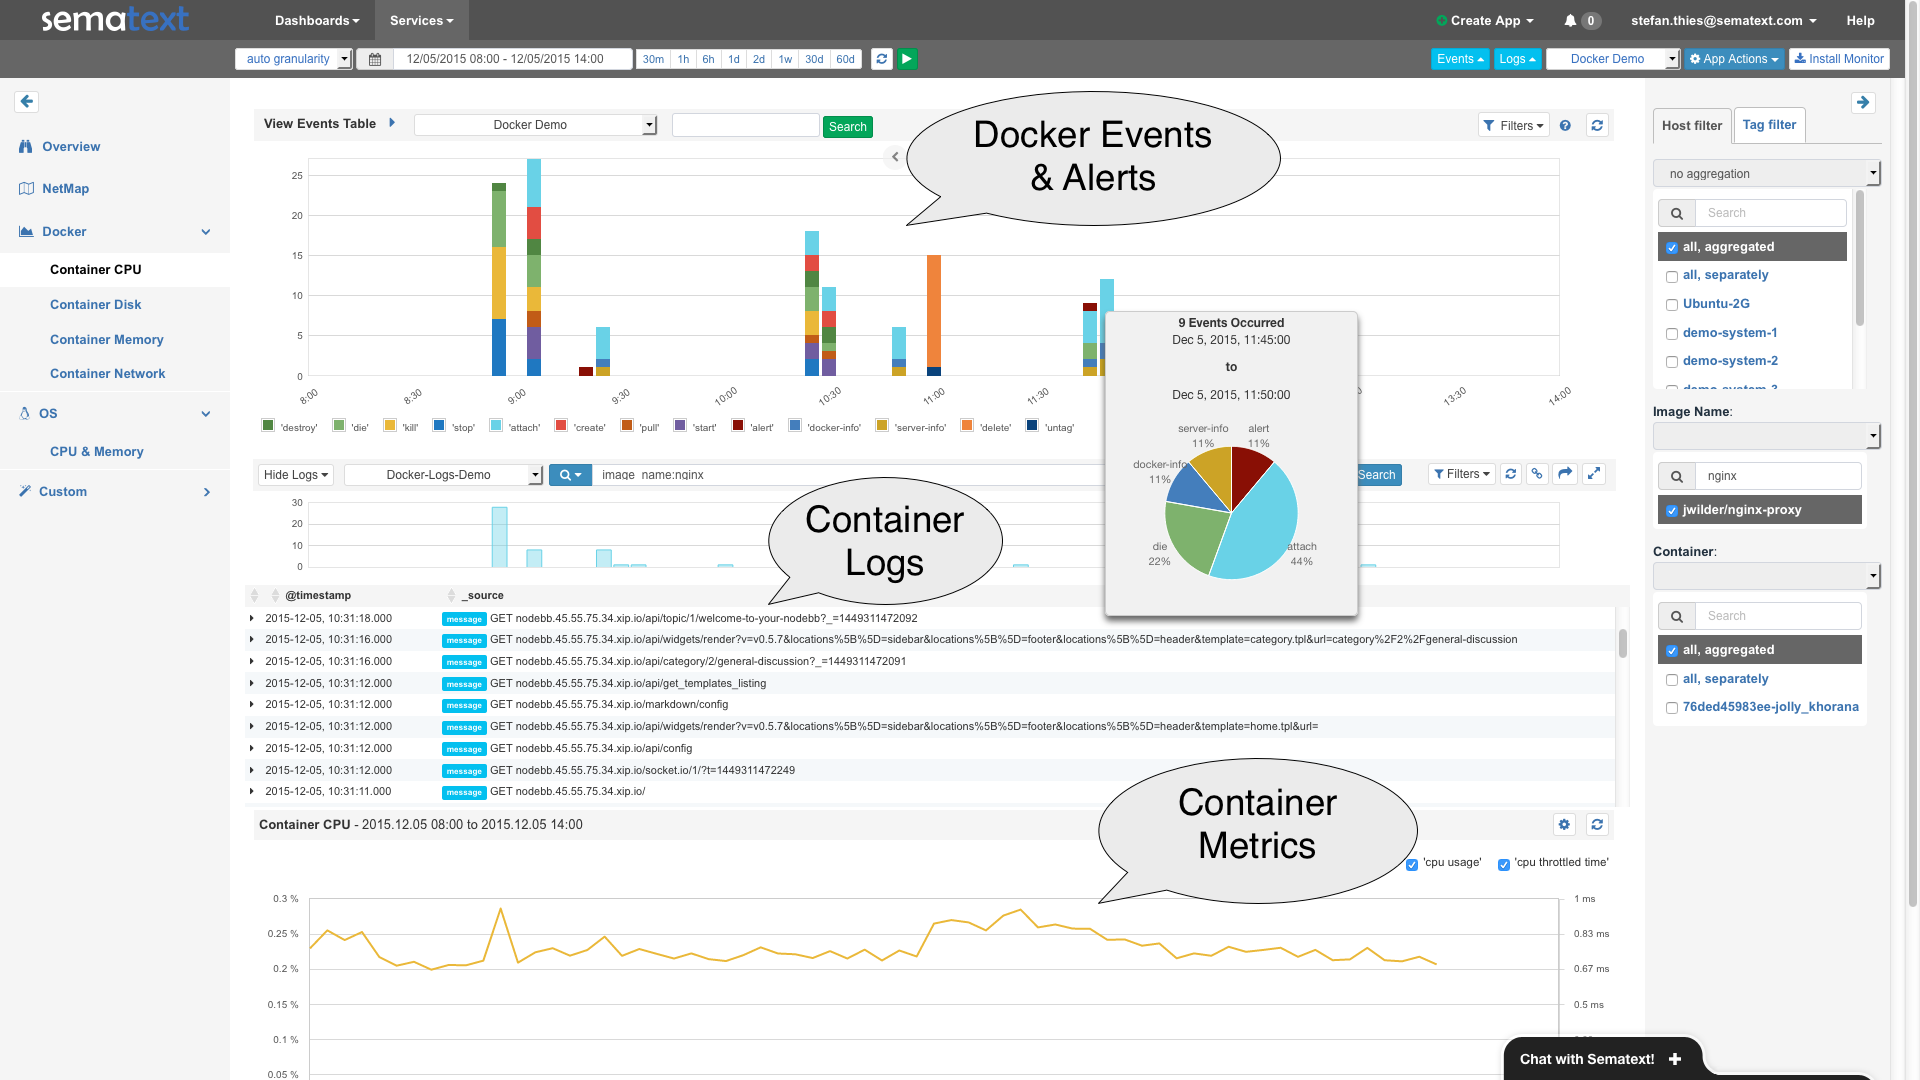
The following screenshot shows expanded views for Docker Events and Alerts (top), Container Logs (middle) and Container Metrics (bottom):
Sematext SPM, showing Docker Events, Logs and Metrics
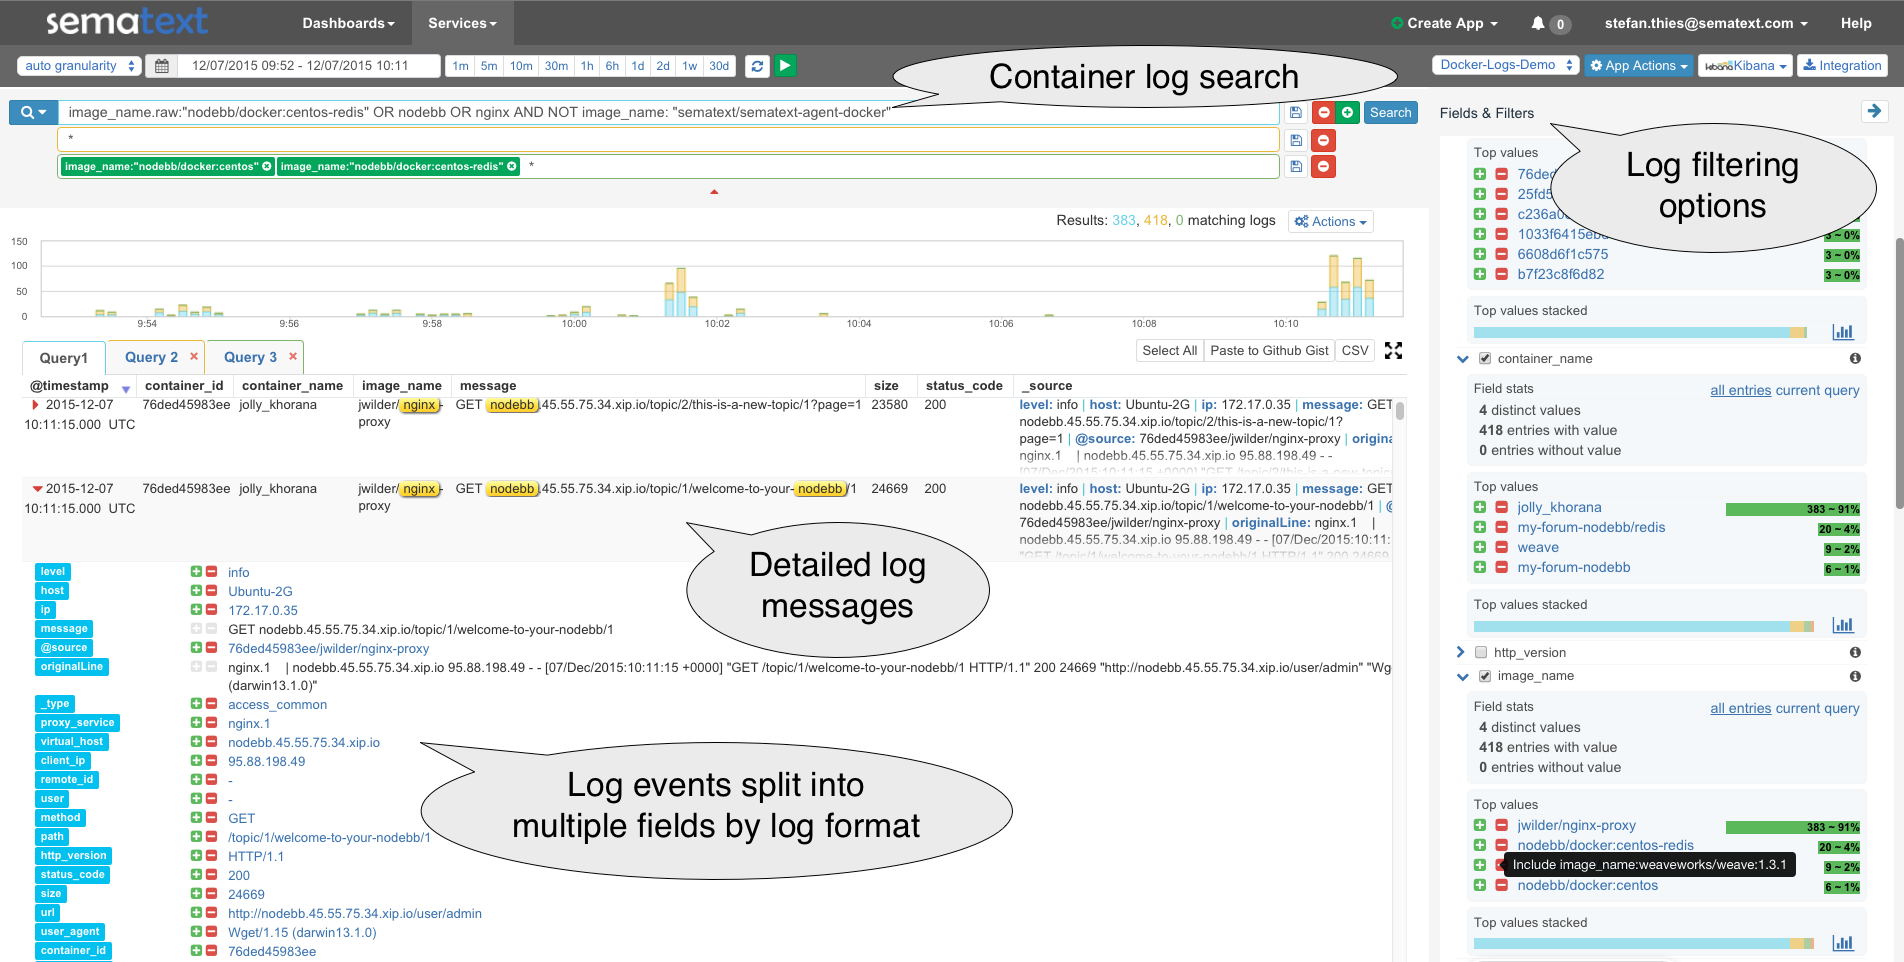
If you need more functionality to slice and dice logs then move to the Logsene UI shown below. The screenshot shows Container Log search (top) and detailed log messages tagged with container information and parsed fields (middle). Both the detail view in the middle and the Fields & Filters on the right side contain buttons to drill down into logs – e.g., to filter for the logs of a specific Docker Image or Docker Container.
Logsene User Interface – showing Docker log search, filtering options, log messages, & log events sorted by format
1-Minute Deployment in Tutum
One of the benefits of using SPM and Logsene for Docker monitoring, logging, and events is how easily they can be launched on Tutum. It’s basically one minute: click-click-done! For Docker users this means a single solution, a single container that captures not just logs or just metrics, but both container metrics and logs, plus Docker events, plus Docker host metrics and its logs.
Sematext Docker Agent on Docker Hub
Sematext Docker Agent image is available on Docker Hub, and we shared the Tutum Stackfile for Sematext Docker Agent on Stackfiles.io – but the easiest way is to go via Sematext UI, which generates the stackfiles for you, including Application Tokens, as demonstrated in the video.
Sematext Docker Agent Stackfile in Tutum Cloud, ready to deploy
Docker’s ETP Program
Docker’s ETP program recognizes ecosystem partners like Sematext that have demonstrated integration with the Docker platform. As part of the program, Docker will highlight a capability area within the application lifecycle, validate integration and communicate the availability of the partner’s solution to the community and the market. The goal of the program is to ensure that logging tools like Logsene have been working with Docker to ensure the highest degree of availability and performance of distributed applications. Like the other partners in this program, Sematext has proven integration with the Docker platform and has demonstrated that Logsene is able to record logging data for dockerized applications.
“Sematext has been on the forefront of Docker monitoring, along with Docker event collection, charting and correlation with metrics,” said Otis Gospodnetić, Sematext’s Founder and CEO. “So it was a natural next step to incorporate Docker logging via our Logsene log management solution. The combination of SPM and Logsene not only allows for correlation of Docker metrics and logs, but also metrics and logs of applications running inside containers, along with anomaly detection and alerting. All this makes it much easier to troubleshoot performance and other issues much faster and with a lot less hassle than using more traditional or siloed solutions.”
Not using Logsene yet? Check out the free 30-day trial by registering here (ping us if you’re a startup, a non-profit, or educational institution – we’ve got special pricing for you!). There’s no commitment and no credit card required.
The official Solr Image on Docker Hub was released just a few weeks ago and already has 16K pulls. Why not more? Well, there are more than 200 different Solr images on Docker Hub — probably because no official Image was available!
A rapidly growing number of organizations are using Solr and Docker in production and they are probably happy about the new official Image. Needless to say, monitoring Solr is essential in production. Docker is disruptive in many ways, and there are many things that are slightly different and worth mentioning. These include:
Changed deployment for Solr and its monitoring tools using Dockerfile, Docker Compose or various Orchestration Tools
Logging has changed: containers log to the console and logs need to be retrieved from Docker-Daemon instead getting them from the Solr log file. Check out our post on the subject: Innovative Docker Log Management
Official Images may not provide options for monitoring (such as JMX). However, the official Image for Solr provides an option to pass parameters to the Java Runtime Environment. We we will use this option for Solr monitoring in this post.
Next, I’m going to demonstrate the setup of a Solr node with SPM. The final setup will provide the full Solr & Docker Monitoring and Logging package:
Detailed Application Metrics for Solr, deployed on Docker
Detailed Container Metrics and Docker Events
Centralized Logs for all Containers by SPM for Docker
Let’s first decide on one of the following options to monitor Solr on Docker:
Build your own Solr container with a mix of open-source monitoring/alerting tools. I’m not going to go into detail about this option today because dealing with a mix of open-source DevOps tools and a non-official Solr image doesn’t sound clean; plus, we can do better.
Use a standalone monitoring agent, which queries metrics from the Solr container. This requires a setup for JMX and Docker networking configurations for the monitor and Solr. The metrics gathered by remote agents are limited and, in the Docker context, running an external monitoring process plus Solr processes consumes more resources. And the next option …
Inject an SPM in-process monitoring agent into Solr. This option has the lowest resource usage and has support for advanced monitoring functions like Transaction Tracing and AppMap.
We’ll go with Option #3 in this blog post, as it provides the best insights into Solr. Sematext provides the SPM Client (this includes the monitoring agent and metrics sender) pre-installed in a Docker Image. We refer to this dockerized SPM Client as “SPM Client Image/Container” in the following instructions. The main trick here is to mount a volume from SPM Client Container into Solr Containers in order to load the monitoring library that’s part of the SPM Client Container.
Let’s have a look at the desired setup and how to get there:
The SPM Token is a unique identifier for monitored applications – if you haven’t created an SPM App for Solr, then create one here first. Should take about 37 seconds.
# Set the SPM Token as Environment Variable
export SPM_TOKEN=4feb144c-4da8-4081-83b5-b0b8e06e743a
# Set the JVM Name, which appears in SPM JVM Metrics Report
# In addition we will use it as Hostname for the Solr container
export JVM_NAME=SOLR1
2) Create SPM Client and Solr service in docker-compose.yml Note: you may copy this file to make changes for additional Solr options; all parameters are set as Environment Variables.
In the Environment variable “SOLR_OPTS” in the Docker-Compose file above we see options for the SPM in-process monitor to inject a .jar file from the SPM Client Volume. The SOLR_OPTS string is taken from SPM install instructions. It includes the SPM Token (the ${SPM_TOKEN} part) and provides the JVM name so we can distinguish between multiple Solr instances if we run N of them on the same host (the ::${JVM_NAME} part).
3) Run Solr and SPM Monitor
We are now ready to fire up Solr:
docker-compose up -d
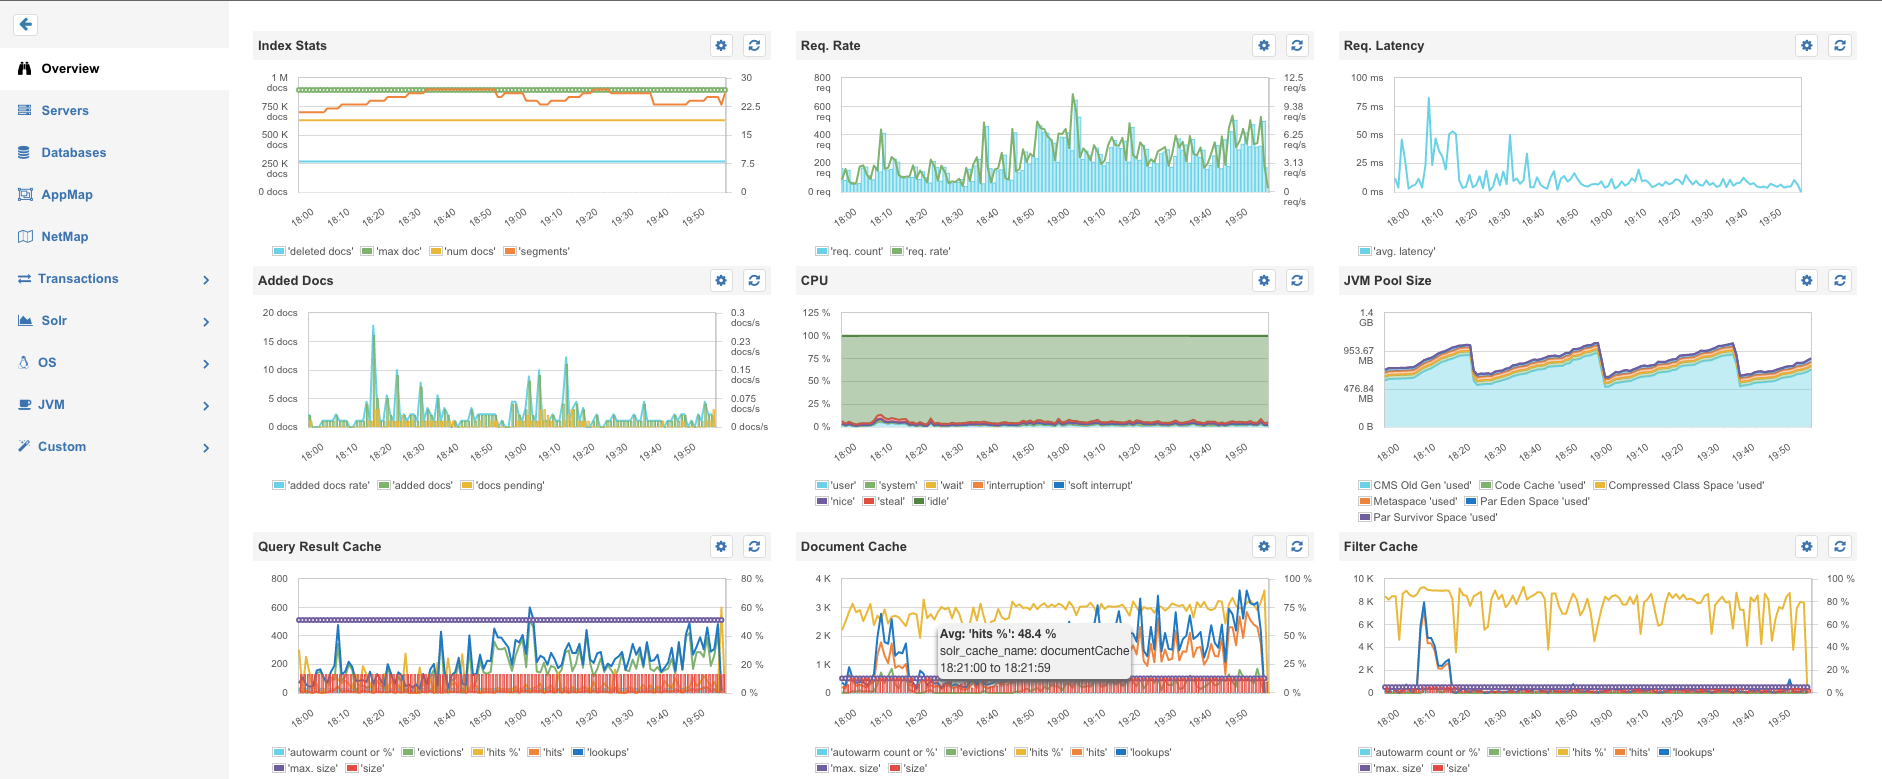
All done! After about a minute, metrics for the Docker Host, JVMs and Solr nodes will appear in SPM. Because we chose a consistent naming for Container hostname, and JVM name we can immediately see, in every chart, the relevant filters named “SOLR1”. This is much better than some random Container IDs.
Solr Metrics Overview
But what about my Solr Logs and the Container Metrics?
Simply run SPM for Docker – it collect logs as well as container and host metrics. It can also parse Solr logs and store them in Logsene (see Logsene 1-Click ELK Stack), which is awesome because it means you can have both Solr/OS/JVM metrics AND Solr logs all in one place! Or do you maybe like to ssh to your servers and grep log files?
docker run -d -name sematext-agent -e SPM_TOKEN=SPM_DOCKER_APP_TOKEN -e LOGSENE_TOKEN=LOGSENE_APP_TOKEN sematext/sematext-agent-docker
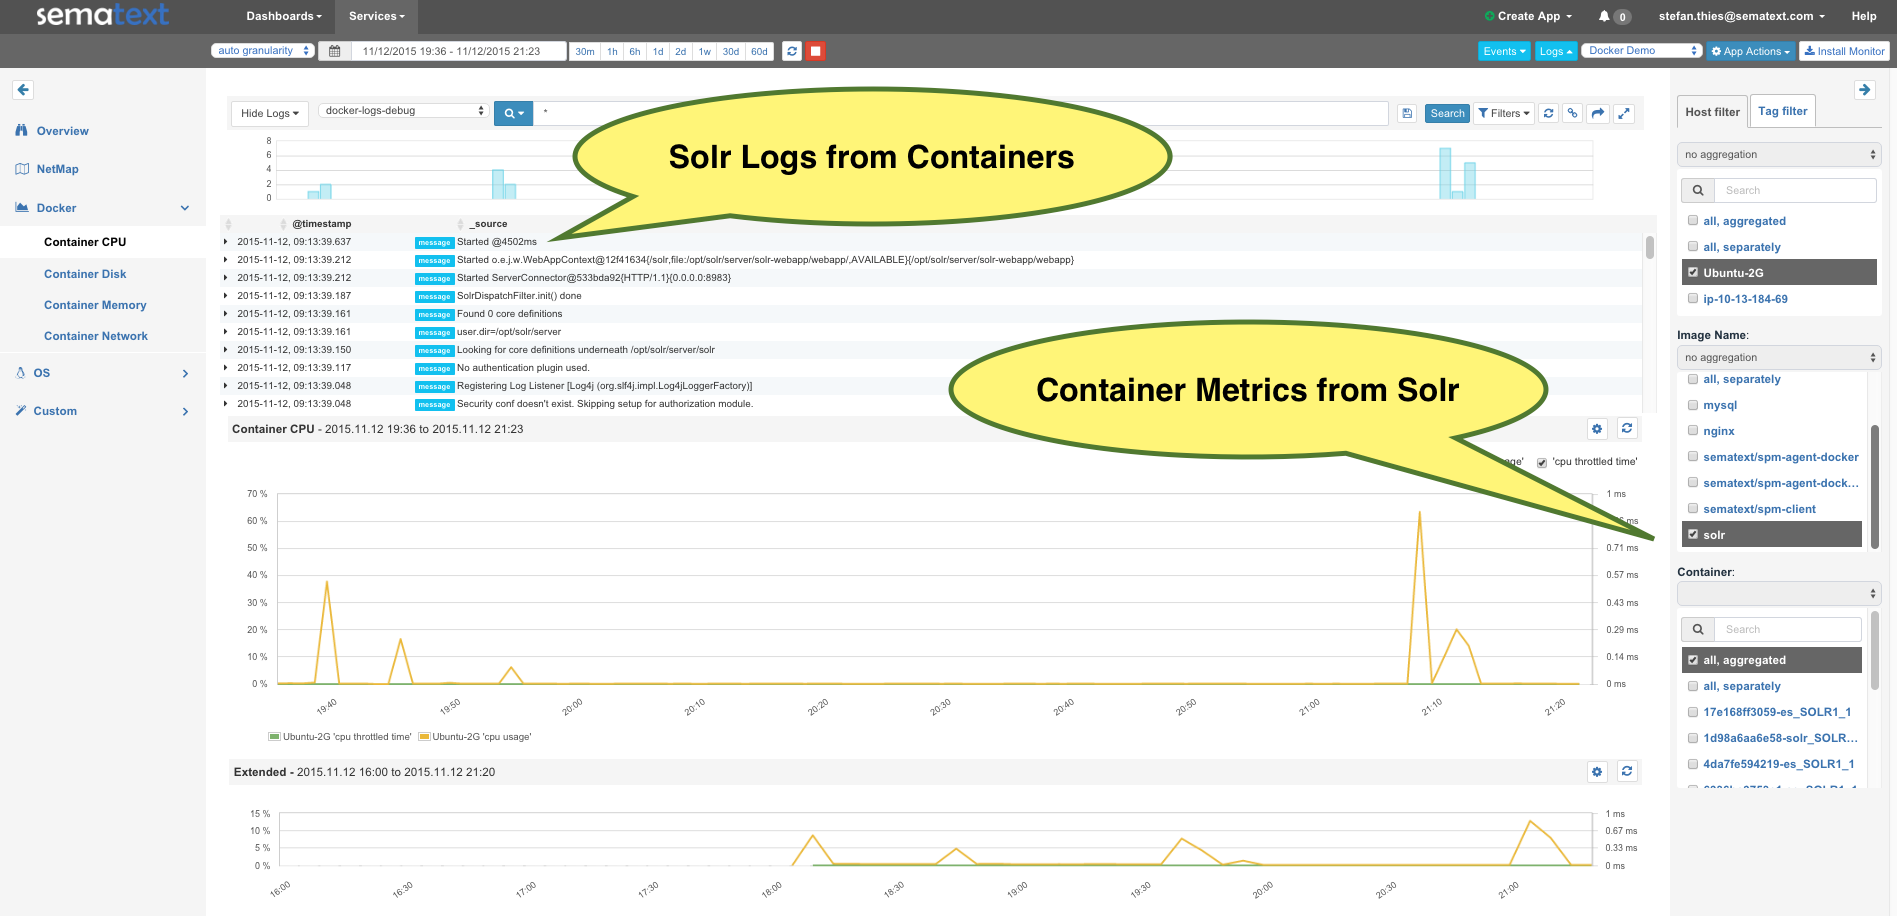
After a few minutes, you will get Host and Container Metrics together with Events and Logs in SPM, as shown here:
Please note that logs from the containers are automatically shipped and parsed! No setup for log shippers? That is correct — there is NO complicated setup of syslog, Logstash, Docker log drivers, etc. All this work is done by SPM for Docker. For example, each log line has a “node_name” field for the Solr node. It takes the timestamp, severity, class, thread and source from the Solr log and each log is automatically tagged with the container ID and image name. Moving from SPM Metrics to detailed Solr Logs including Exceptions and parsed Stack Traces is just another mouse click away! Look:
Multi-Line Exception, captured and parsed from Solr container
The filters next to field stats on the right side of the screen make it easy to identify containers with the most logs by choosing “container_name”. That’s just a little detail in the Logsene UI – feel free to explore it by creating Alerts or Kibana 4 Dashboards for your container logs.
Like what you saw here? To monitor Docker and Solr with SPM just get a free account here! And drop us an email or hit us on Twitter with suggestions, questions or comments. Solr and Docker are topics we enjoy chatting about with the community!
Fresh from DevOps Days in Warsaw and delivered by Sematext engineer Rafal Kuć, “Running High Performance and Fault Tolerant Elasticsearch Clusters on Docker” is chock full of practical information that will no doubt answer many of the questions you might have about this process.
Update:Elasticsearch 2.x requires a setup with standalone monitors. Why? A very restricitve Java security policy got implemented in Elasticsearch 2.x. This security policy forbids loading of 3rd party libraries – including in-process monitoring libraries from SPM. Here is an example with Docker Compose and SPM-Client standalone monitor, working with Elasticsearch 2.x.
Theofficial Elasticsearch Image on Docker Hub has already generated more than 1.6 million pulls. It is probably the easiest way to get a development setup — which includes Elasticsearch — to the application stack. The reason for this crazy number? A rapidly growing number of organizations are using Elasticsearch and Docker in production. Needless to say,monitoring Elasticsearch is essential in production, and you can find a detailed analysis of this topic (including the “top 10 Elasticsearch metrics to watch”) in thefree eBook: ElasticsearchMonitoring Essentials. Docker is disruptive in many ways, and there are many things that are slightly different and worth mentioning. These include:
Changed deployment for Elasticsearch and its monitoring tools using Dockerfile, Docker Compose or various Orchestration Tools
Logging has changed: containers log to the console and logs needs to be retrieved from Docker-Daemon instead getting them from the Elasticsearch log file. Check out our post on the subject: Innovative Docker Log Management
Official Images may not provide options for monitoring (such as JMX). However, the official Image for Elasticsearch provides an option to pass parameters to the Java Runtime Environment. We we will use this option for Elasticsearch monitoring in this post. You should also be aware that the official Elasticsearch Image does not include any plugins, and commercial monitoring from Elastic can’t be distributed in this Image for licensing reasons. Our monitoring tool of choice is SPM. If you are not familiar with SPM — but have heard of it — or if you use Marvel, have a look atMarvel vs. SPM.
Next, I’m going to demonstrate a setup to monitor multiple Elasticsearch nodes on a single Docker Host. The final setup will provide the full Monitoring and Logging package:
Detailed Application Metrics for Elasticsearch, deployed on Docker
Detailed Container Metrics and Docker Events
Centralized Logs for all Containers by SPM for Docker
So let’s first decide on one of the following options to monitor Elasticsearch on Docker. You can:
Build your own Elasticsearch container with the included monitoring components. I’m not going to go into details about this option today; rather, I’m going to focus on the official / trusted build.
Use a standalone agent, which queries metrics from the Elasticsearch container. This requires a setup for JMX and Docker networking configurations for the monitor and Elasticsearch. The metrics, gathered by remote agents, are limited and, in the Docker context, running an external monitoring process plus Elasticsearch processes consumes more resources. And the next option …
Inject an SPM in-process monitoring agent into Elasticsearch. This option has the lowest resource usage and has support for advanced monitoring functions likeTransaction TracingandAppMap.
I chose to implement Option #3 in this blog post because it provides the best insights into Elasticsearch. This means the Elasticsearch container needs file-system access to the SPM monitoring agent. Sematext provides the SPM Client (which includes the monitoring agent and metrics sender) pre-installed in a Docker Image, referred as “SPM Client Image/Container” in the following instructions and published onDocker Hub as “sematext/spm-client”. The main trick here is to mount a volume from SPM-Client Container into Elasticsearch Containers in order to load the monitoring library.
Let’s have a look at the desired setup and how to get there:
Docker Logging has been a very popular topic of late in our internal and external discussions. So much so that we decided to hold webinars on the topic (and Docker Monitoring as well) and now we’re making them available to everyone.
The webinars were presented by Sematext’s DevOps Evangelist, Stefan Thies. Stefan discussed Docker logging basics, including: the different log collection options Docker users have; the pros and cons of each option; specific and existing Docker logging solutions; log shipping to ELK Stack; and more.
Once you’ve checked out some of the Docker content sign up for a free 30-day trial (no credit card required) of Logsene or request a demo to see how easy it is to get up and running.
There’s a good chance you will also like SPM, our performance monitoring solution, that, like Logsene, offers alerting and anomaly detection on top of all the other benefits. We’re even offering a 20% discount on SPM and Logsene to webinar viewers. Just use these codes when creating new SPM and Logsene apps:
SPM: 201509WNR20S
Logsene: 201509WNR20L
Docker Monitoring Webinar & Slides
Speaking of metrics…for those of you with an interest in Docker Monitoring, we held a webinar on that subject as well. Click here to access the webinar video recording and slides.
The recent Docker Monitoring webinar is ready for consuming! Our DevOps Evangelist, Stefan Thies, took attendees on a tour of Docker monitoring basics, including a number of different Docker monitoring options and their pros and cons, solutions for Docker monitoring, and a brief Q&A session.
If you use Docker you know that these deployments can be very dynamic, not to mention all the ways there are to monitor Docker containers, collect logs from them, etc. etc. And if you didn’t know these things, well, you’ve come to the right place!
Once you’ve checked out some of the Docker content sign up for a free 30-day trial (no credit card required) of SPM for Docker or request a demo to see how easy it is to get up and running.
There’s a good chance you will also like Logsene, our centralized logging solution that, like SPM, offers alerting and anomaly detection on top of all the other benefits. We’re even offering a 20% discount on SPM and Logsene to webinar viewers. Just use these codes when creating new SPM or Logsene apps:
SPM: 201509WNR20S
Logsene: 201509WNR20L
Docker Logging Webinar & Slides
Speaking of logs…for those of you with an interest in Docker Logging, we held a webinar on that subject as well. Click here to access the webinar video recording and slides.
[ Note: Click here for the Docker Monitoring webinar video recording and slides. And click here for the Docker Logging webinar video recording and slides. ]
——-
Good news for Docker fans: we’re running a third Docker Monitoring webinar on Tuesday, October 6 at 2:00 pm Eastern Time / 11:00 am Pacific Time.
If you use Docker you know that these deployments can be very dynamic, not to mention all the ways there are to monitor Docker containers, collect logs from them, etc. etc. And if you didn’t know these things, well, you’ve come to the right place!
The webinar will be presented by Stefan Thies, our DevOps Evangelist, deeply involved in Sematext’s activities around monitoring and logging in Docker and CoreOS. A post-webinar Q&A will take place — in addition to the encouraged attendee interaction during the webinar.
Date/Time
Tuesday, October 6 @ 2:00 pm to 3:00 pm Eastern Time / 11:00 am to 12:00 pm Pacific Time.
“Show, Don’t Tell”
The infographic below will give you a good idea of what Stefan will be showing and discussing in the webinar.
Got Questions, or topics you’d like Stefan to address?
[ Note: Click here for the Docker Monitoring webinar video recording and slides. And click here for the Docker Logging webinar video recording and slides. ]
——-
In the dynamic world of “Microservices” the traditional method of static setups for log routing and parsing doesn’t work very well; in fact, it creates additional complexity and resource usage. This, in turn, reduces the number of microservices that could run on a single server. Sematext has come up with a better method.
The integrated log management functions in SPM for Docker support the microservice approach by reducing setup complexity, startup time and minimizing the utilized resources. SPM Agent for Docker collects metrics, events and logs and runs in a container on every Docker Host. In addition to standard log collection functionality, we recently integrated the automatic log format detection and field extraction for Container Log Messages. The processing is hooked into the stream from the Docker API where logs are collected to the log indexing service of our centralized logging tool, Logsene. This means that — and if you’ve dealt with logs before you’ll know this is huuuge — there’s no set-up of syslog with Docker log drivers, there is no routing to a heavy Logstash process for parsing, and there is no maintenance of Elasticsearch to keep the logs, or even a need to run your own Kibana! SPM for Docker and Logsene provides everything out of the box!
There are many ways to collect logs from Docker (you can learn about that in our Docker Logging Webinar); so what is the advantage of using Logsene for Docker Logs? Let me show you…