Docker Swarm: Collecting Metrics, Events & Logs

Docker Swarm is a cluster manager for Docker.  When accessed via the Docker API by Docker API Clients or Docker command line tools, a Docker Swarm cluster looks just like a single Docker Host.  Docker Swarm distributes containers to multiple nodes using various deployment strategies in the cluster scheduler.

Having in mind that a Swarm cluster looks like a single Docker Host from the API point of view, it should be very easy to monitor Docker Swarm with existing Docker monitoring tools!  Connecting a monitoring agent to the Swarm Master API endpoint should do the job, right? The Sematext Docker Agent could simply collect all container metrics, events and all logs from the Swarm Master – should be a piece of cake. Hm, but could there a gotcha?  It turns out there is more than one:

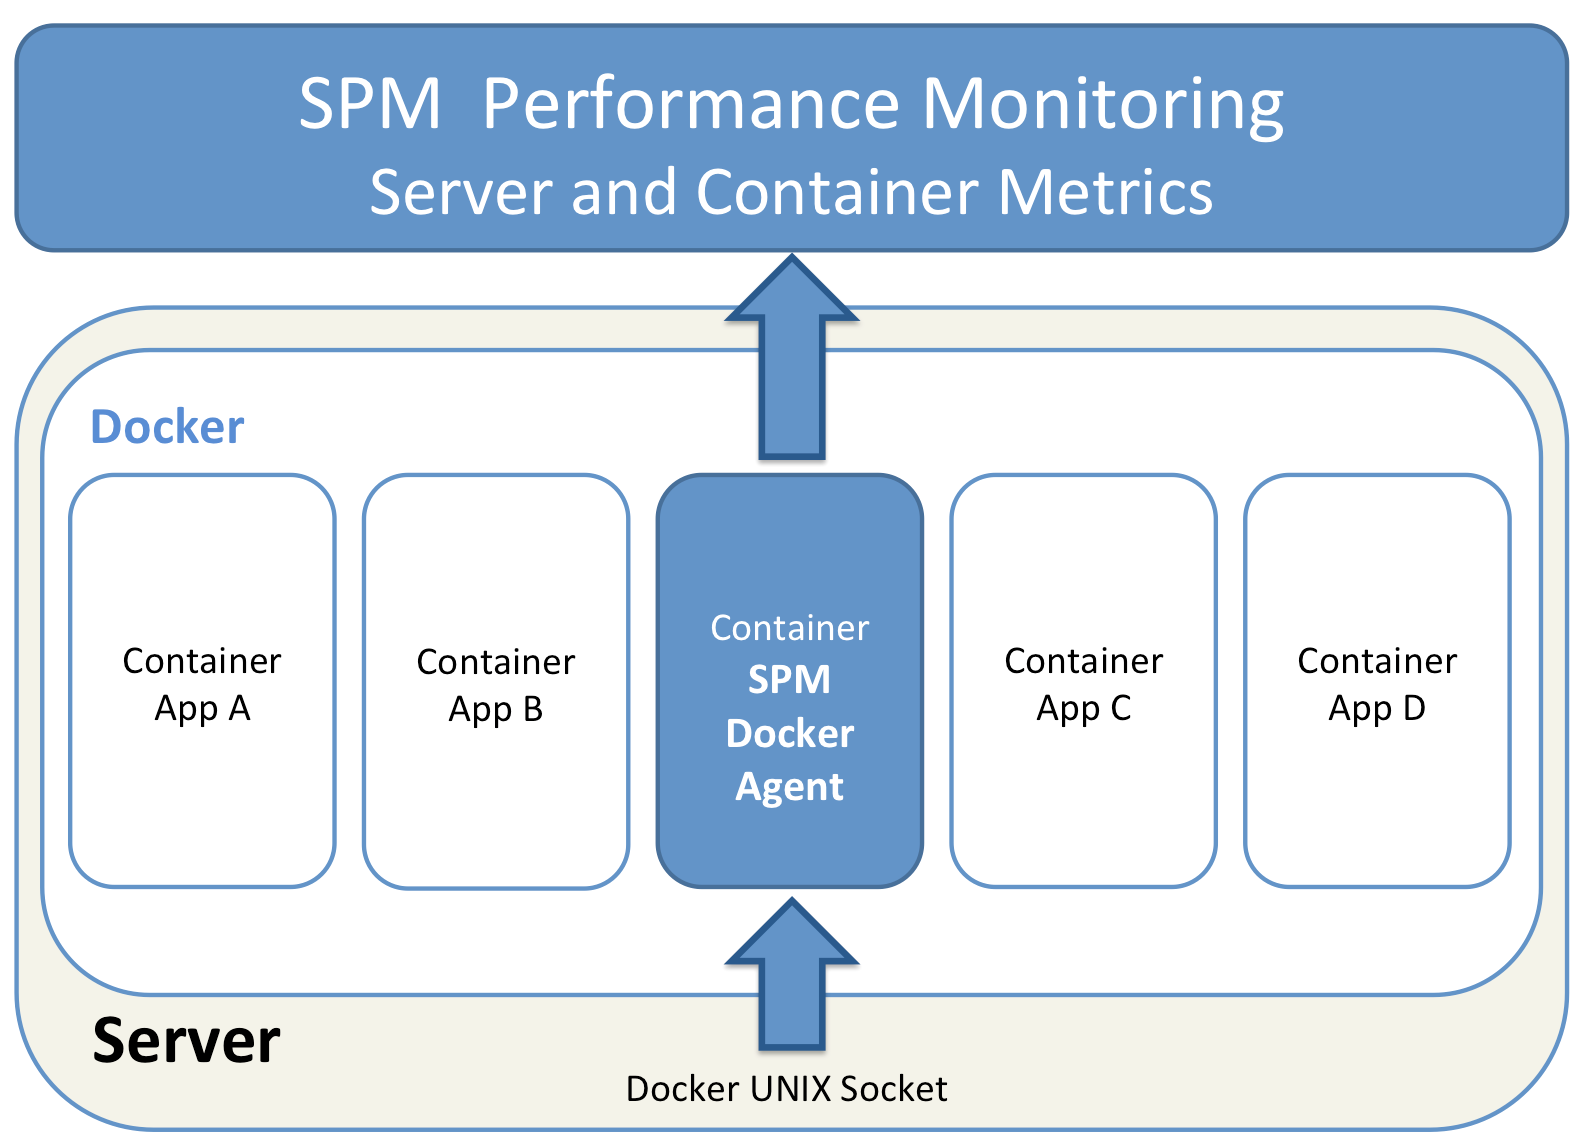
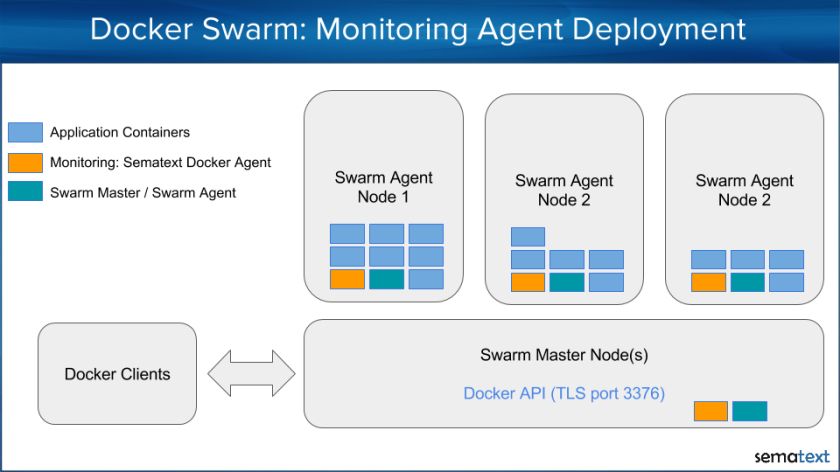
  • If we deploy a single monitoring agent to the master node, it would miss host metrics for all other nodes because the Docker API doesn’t provide any host metrics. We could also not see how much memory, disk space or CPU the Docker Swarm node itself consumes. Solution: deploy the monitoring agents to each node for collecting the metrics locally.
  • Assuming a larger cluster with a high volume of logs, events and metrics to collect, a single monitoring agent connected to the the master node would need to handle all operational data of the cluster.  This would work for a small cluster but such an architecture would obviously be destined for failure on larger clusters.  Guess what the solution is? It’s much better having an agent running on each node and distributing the monitoring and logging work over all nodes. If you do it right from the beginning, there is no need to change the deployment strategy later, when the cluster scales out.
DockerSwarmMonitoring
Monitoring container running on each Docker node

In the following example we assume that the master and agent nodes have the UNIX socket enabled in Docker daemon settings. This can be achieved by using –engine-env ‘DOCKER_OPTS=”-H unix:///var/run/docker.sock”‘ in the docker-machine create command. Use this Github Gist to create a Docker-Swarm Cluster with with enabled UNIX sockets. Later, we will see this helps simplify the deployment of any tool that needs to connect to the local Docker daemon – including monitoring and logging containers.

Let’s see how to deploy Sematext Agent to each node in a Docker Swarm Cluster with UNIX socket enabled in Docker-Daemon as just described.

When we started to work on Swarm Monitoring our first question was “Does Docker Swarm provide a deployment strategy for running exactly one instance of a service on each node?” We checked the documentation, but no dice.  We found strategies like “spread, binpack, and random” (see https://docs.docker.com/swarm/scheduler/strategy/), but none of them would guarantee exactly one instance of a service on each node. The “spread” strategy spreads the containers evenly over all hosts. The “binpack” strategy fills up one node after another with containers, while “random” spreads containers randomly to nodes. There was seemingly no strategy suitable for monitoring services running only once on each node.

So how can we distribute the monitoring container to each host using Docker Swarm instead of bash script iterating over all nodes?  It turns out it’s possible to define an affinity to ensure that containers that should run on the same host are scheduled together. In our case we use “anti-affinity” in the deployment strategy, which instructs Swarm not to deploy the container with Sematext Agent to hosts that already have that container running. In other words, it tells Docker Swarm to run no more than one Sematext Agent container on each Docker host.  To do that we define a docker-compose.yml file with the “anti-affinity” specified in the container environment section:

sematext-agent:
  image: 'sematext/sematext-agent-docker:latest'
  environment:
    - LOGSENE_TOKEN=3b549a2c-653a-4832-xxx
    - SPM_TOKEN=fe31fc3a-4660-47c6-xxx
    - affinity:container!=sematext-agent* 
  privileged: true
  restart: always
  volumes:
    - '/var/run/docker.sock:/var/run/docker.sock'

Finally, we use the docker-compose command to scale out the Sematext Docker Agent and deploy it to all Swarm cluster nodes.  To do that we run:

eval $(docker-machine env swarm-master --swarm)
docker-compose up -d 
# scale is == num nodes
docker-compose scale sematext-agent=$(docker-machine ls | grep swarm | grep Running | wc -l)

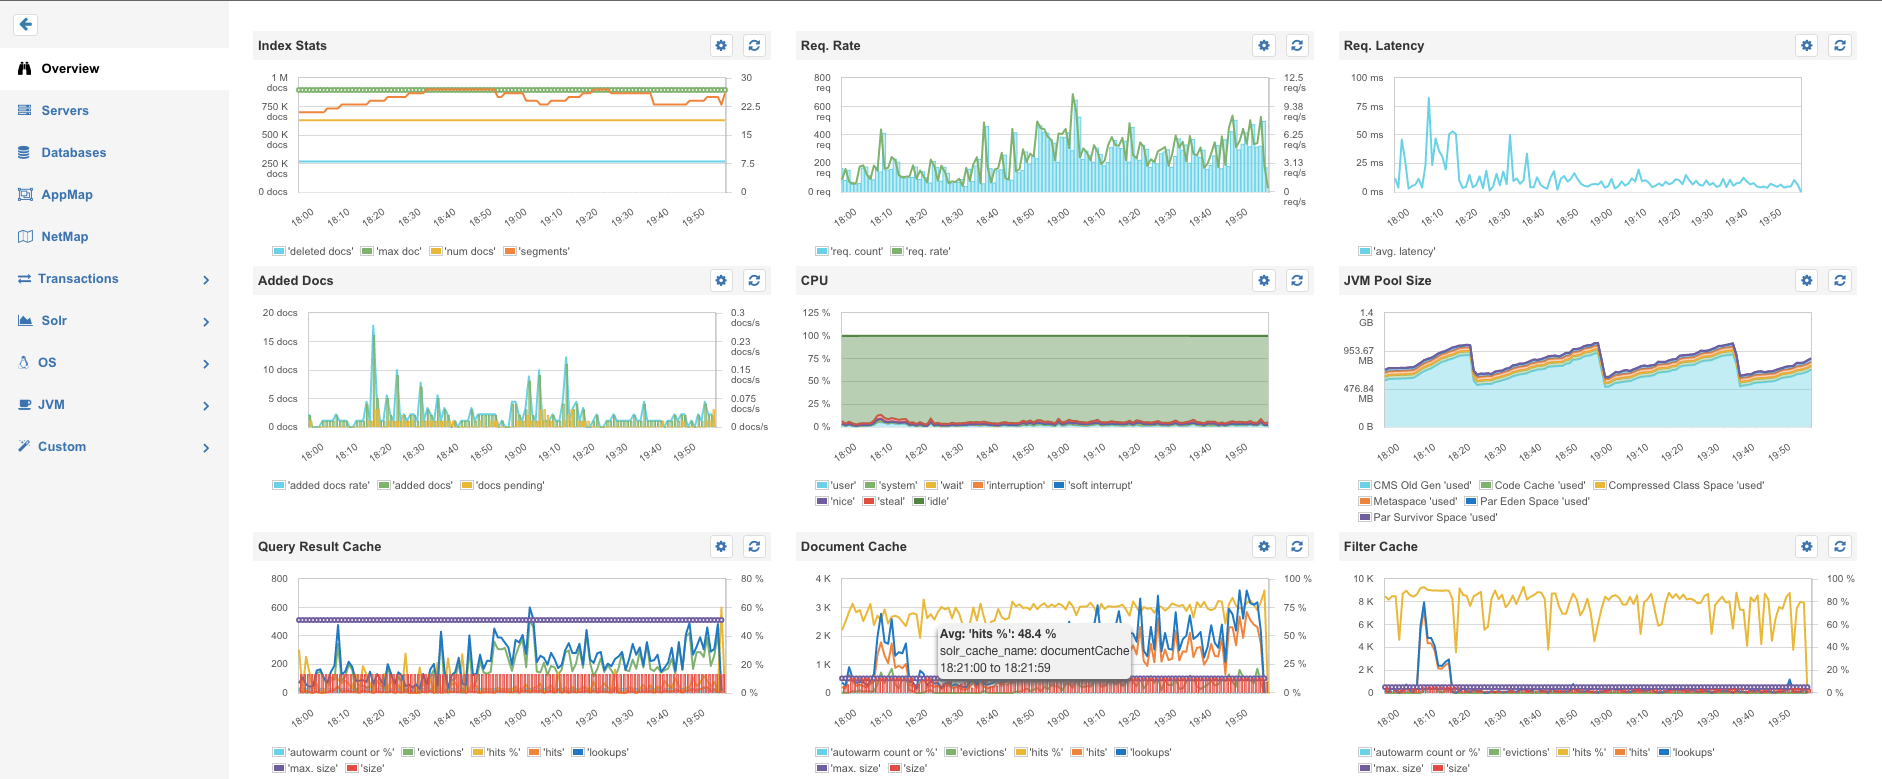
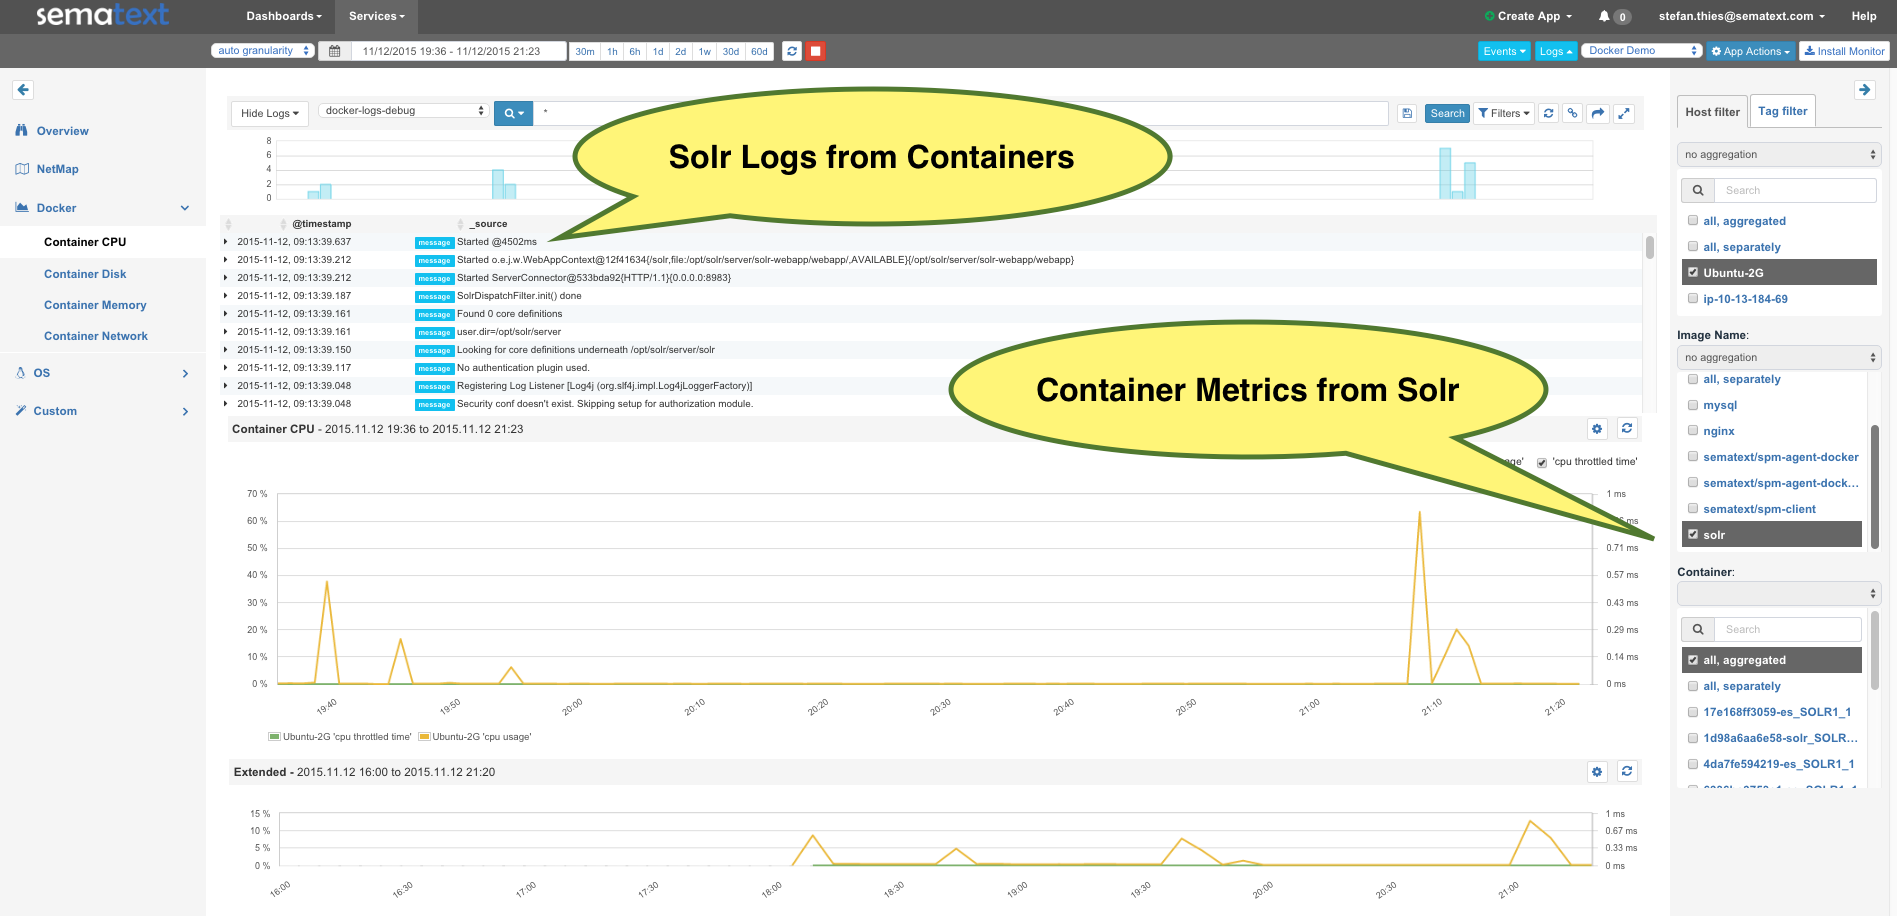
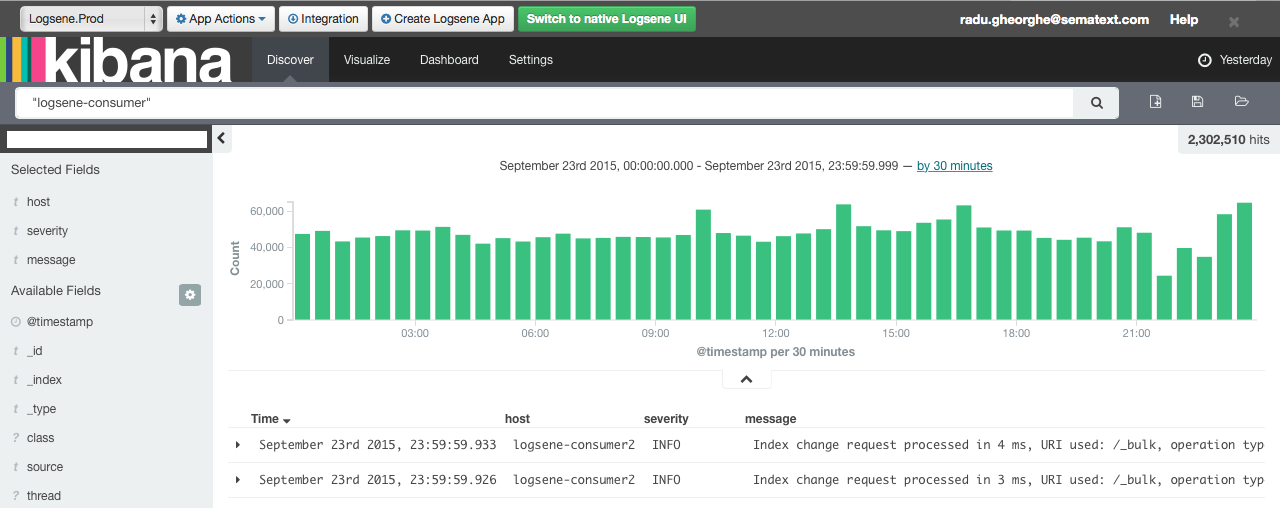
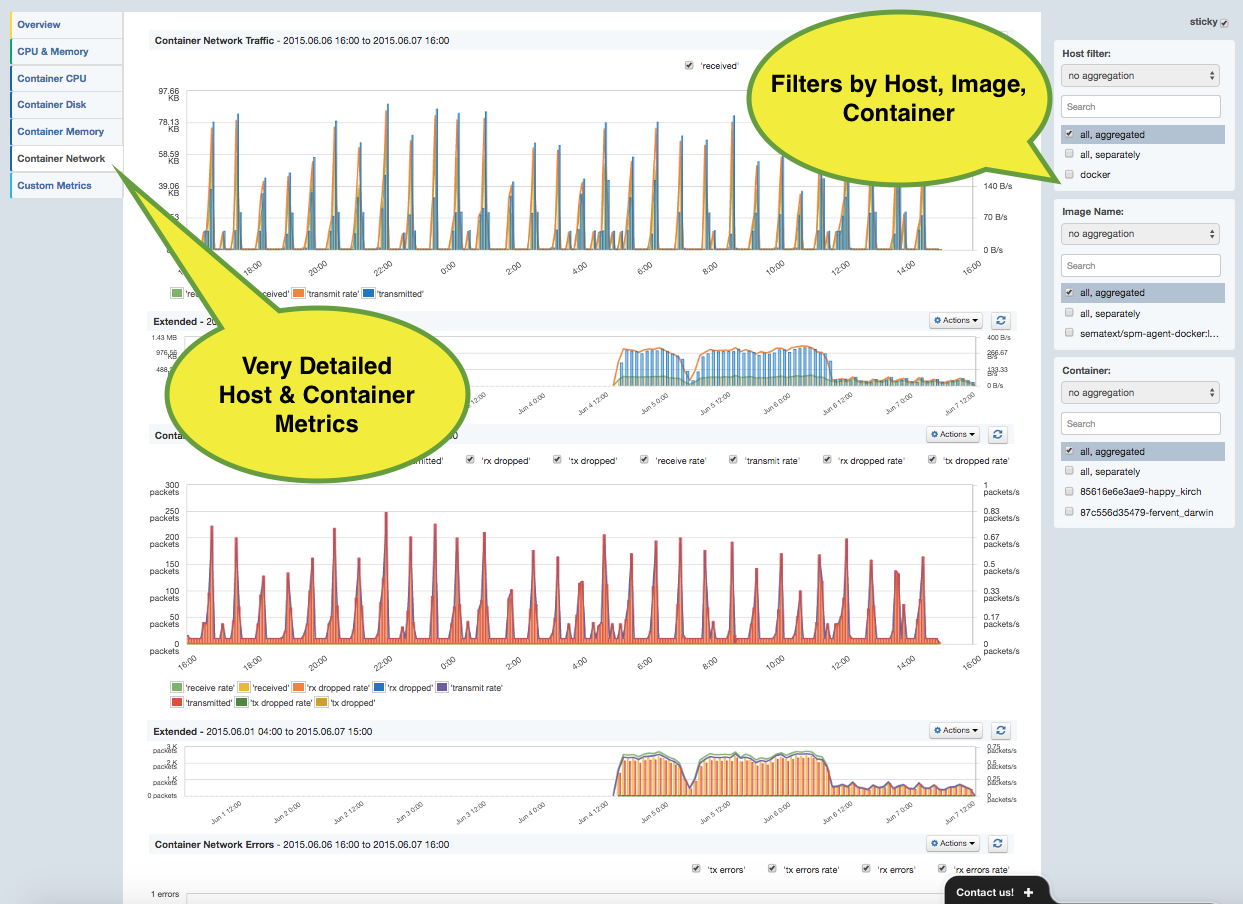
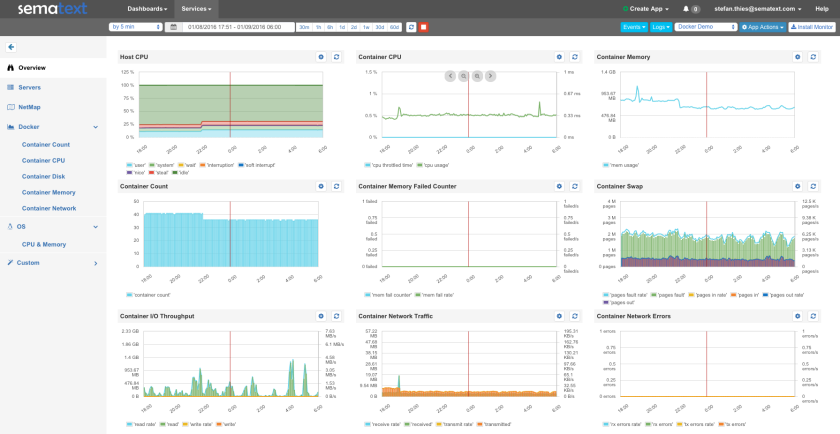
After running the above commands, Sematext Docker Agent will be running on each node and within a minute you will receive Host and Container Metrics for all containers, all their Logs and all Docker events from all nodes in your Docker Swarm cluster.  Complete visibility!

Bildschirmfoto 2016-01-12 um 15.36.01
Aggregated Metrics from all Docker Swarm nodes 

Please note there are many ways to create a Swarm cluster and you might have another setup, such as:

  • TLS secured Docker daemon and no possibility to activate the unix socket: In this situation you have to deal with the existing Docker daemon setup, which typically uses TLS and authentication via certificates (for example, if you followed Docker’s instructions to create Swarm clusters using Docker-Machine). When the Docker socket is secured with TLS, each client – including Sematext Docker Agent – needs the certificates for authentication. This involves a bunch of parameters such as “DOCKER_HOST”, “DOCKER_CERT_PATH”, “DOCKER_TLS_VERIFY” and mounting of the certificate into the container. In addition we should know to which Docker daemon the agent should be connected (typically port 2375 for TCP, 2376 for TLS on each node and port 3376 on Swarm Master nodes for the Swarm API). We made this scenario easy with a deployment script for the Sematext Agent with TLS options provided by Docker-Machine.
  • You use CoreOS to run Docker Swarm: In this case you could use fleet and systemd to distribute the agent to each node (simply install Sematext Agent with these instructions)

The deployment methods above should work for other monitoring tools or logging containers as well because most of such tools need to run on each node to collect the metrics locally.

If you have questions or special needs for monitoring more complex setups feel free to contact us. The Sematext Docker Agent is a turnkey-solution for Docker Logs, Metrics and Events – sign up here and give it a try (30-days free trial, no credit card needed).

Docker + Solr How-to: Monitoring the Official Solr Docker Image

The official Solr Image on Docker Hub was released just a few weeks ago and already has 16K pulls. Why not more? Well, there are more than 200 different Solr images on Docker Hub — probably because no official Image was available!

A rapidly growing number of organizations are using Solr and Docker in production and they are probably happy about the new official Image. Needless to say, monitoring Solr is essential in production. Docker is disruptive in many ways, and there are many things that are slightly different and worth mentioning.  These include:

  1. Changed deployment for Solr and its monitoring tools using Dockerfile, Docker Compose or various Orchestration Tools
  2. There is a new Layer to monitor: Container Metrics and Events, see: Docker Events and Metrics monitoring and SPM for Docker
  3. Logging has changed: containers log to the console and logs need to be retrieved from Docker-Daemon instead getting them from the Solr log file.  Check out our post on the subject: Innovative Docker Log Management
  4. Official Images may not provide options for monitoring (such as JMX).  However, the official Image for Solr provides an option to pass parameters to the Java Runtime Environment.  We we will use this option for Solr monitoring in this post.

Next, I’m going to demonstrate the setup of a Solr node with SPM. The final setup will provide the full Solr & Docker Monitoring and Logging package:

  • Detailed Application Metrics for Solr, deployed on Docker
  • Detailed Container Metrics and Docker Events
  • Centralized Logs for all Containers by SPM for Docker

Let’s first decide on one of the following options to monitor Solr on Docker:

  1. Build your own Solr container with a mix of open-source monitoring/alerting tools. I’m not going to go into detail about this option today because dealing with a mix of open-source DevOps tools and a non-official Solr image doesn’t sound clean; plus, we can do better.
  2. Use a standalone monitoring agent, which queries metrics from the Solr container. This requires a setup for JMX and Docker networking configurations for the monitor and Solr. The metrics gathered by remote agents are limited and, in the Docker context, running an external monitoring process plus Solr processes consumes more resources.  And the next option …
  3. Inject an SPM in-process monitoring agent into Solr. This option has the lowest resource usage and has support for advanced monitoring functions like Transaction Tracing and AppMap.

We’ll go with Option #3 in this blog post, as it provides the best insights into Solr.  Sematext provides the SPM Client (this includes the monitoring agent and metrics sender) pre-installed in a Docker Image.  We refer to this dockerized SPM Client as “SPM Client Image/Container” in the following instructions.  The main trick here is to mount a volume from SPM Client Container into Solr Containers in order to load the monitoring library that’s part of the SPM Client Container.

Let’s have a look at the desired setup and how to get there:

SPM-Solr-Docker-Schema
Monitoring Setup

We’ll use the latest Docker-Compose Version (> v1.5) because we can than use environment variables substitution in Docker-Compose.

1) Configure and start SPM-Client Container

The SPM Token is a unique identifier for monitored applications – if you haven’t created an SPM App for Solr, then create one here first. Should take about 37 seconds.

# Set the SPM Token as Environment Variable
export SPM_TOKEN=4feb144c-4da8-4081-83b5-b0b8e06e743a
# Set the JVM Name, which appears in SPM JVM Metrics Report
# In addition we will use it as Hostname for the Solr container
export JVM_NAME=SOLR1

2) Create SPM Client and Solr service in docker-compose.yml Note: you may copy this file to make changes for additional Solr options; all parameters are set as Environment Variables.

spm-client-solr:
 image: sematext/spm-client
 container_name: spm-client-solr
 hostname: spm-client-solr
 environment:
 - SPM_CONFIG=${SPM_TOKEN} solr javaagent ${JVM_NAME}

SOLR1:
 image: solr
 hostname: solr1
 ports:
 - "8983:8983"
 volumes_from:
 - spm-client-solr
 environment:
 - SOLR_OPTS=-Dcom.sun.management.jmxremote -javaagent:/opt/spm/spm-monitor/lib/spm-monitor-solr.jar=${SPM_TOKEN}::${JVM_NAME}
 command: bin/solr -f

In the Environment variable “SOLR_OPTS” in the Docker-Compose file above we see options for the SPM in-process monitor to inject a .jar file from the SPM Client Volume.  The SOLR_OPTS string is taken from SPM install instructions.  It includes the SPM Token (the ${SPM_TOKEN} part) and provides the JVM name so we can distinguish between multiple Solr instances if we run N of them on the same host (the ::${JVM_NAME} part).

3) Run Solr and SPM Monitor  

We are now ready to fire up Solr:

    docker-compose up -d

Solr_image_code

All done! After about a minute, metrics for the Docker Host, JVMs and Solr nodes will appear in SPM.  Because we chose a consistent naming for Container hostname, and JVM name we can immediately see, in every chart, the relevant filters named “SOLR1”.  This is much better than some random Container IDs.

Solr_image_screen_4

Solr Metrics Overview

But what about my Solr Logs and the Container Metrics?

Simply run SPM for Docker – it collect logs as well as container and host metrics.  It can also parse Solr logs and store them in Logsene (see Logsene 1-Click ELK Stack), which is awesome because it means you can have both Solr/OS/JVM metrics AND Solr logs all in one place!  Or do you maybe like to ssh to your servers and grep log files?

Docker Logs & Metrics Steps:

First we create the SPM App with the type “Docker” for Docker-specific metrics and then we create a Logsene App for our logs. Then we use the generated App Tokens to run Sematext Agent for Docker.

docker run -d -name sematext-agent -e SPM_TOKEN=SPM_DOCKER_APP_TOKEN -e LOGSENE_TOKEN=LOGSENE_APP_TOKEN sematext/sematext-agent-docker

After a few minutes, you will get Host and Container Metrics together with Events and Logs in SPM, as shown here:

Solr_image_screen_2

Please note that logs from the containers are automatically shipped and parsed! No setup for log shippers? That is correct — there is NO complicated setup of syslog, Logstash, Docker log drivers, etc.  All this work is done by SPM for Docker. For example, each log line has a “node_name” field for the Solr node. It takes the timestamp, severity, class, thread and source from the Solr log and each log is automatically tagged with the container ID and image name. Moving from SPM Metrics to detailed Solr Logs including Exceptions and parsed Stack Traces is just another mouse click away! Look:

Solr_image_screen_3
Multi-Line Exception, captured and parsed from Solr container


solr-logsene

The filters next to field stats on the right side of the screen make it easy to identify containers with the most logs by choosing “container_name”.  That’s just a little detail in the Logsene UI – feel free to explore it by creating Alerts or Kibana 4 Dashboards for your container logs.

Like what you saw here? To monitor Docker and Solr with SPM just get a free account here!  And drop us an email or hit us on Twitter with suggestions, questions or comments.  Solr and Docker are topics we enjoy chatting about with the community!

Recipe: rsyslog + Kafka + Logstash

This recipe is similar to the previous rsyslog + Redis + Logstash one, except that we’ll use Kafka as a central buffer and connecting point instead of Redis. You’ll have more of the same advantages:

  • rsyslog is light and crazy-fast, including when you want it to tail files and parse unstructured data (see the Apache logs + rsyslog + Elasticsearch recipe)
  • Kafka is awesome at buffering things
  • Logstash can transform your logs and connect them to N destinations with unmatched ease

There are a couple of differences to the Redis recipe, though:

  • rsyslog already has Kafka output packages, so it’s easier to set up
  • Kafka has a different set of features than Redis (trying to avoid flame wars here) when it comes to queues and scaling

As with the other recipes, I’ll show you how to install and configure the needed components. The end result would be that local syslog (and tailed files, if you want to tail them) will end up in Elasticsearch, or a logging SaaS like Logsene (which exposes the Elasticsearch API for both indexing and searching). Of course you can choose to change your rsyslog configuration to parse logs as well (as we’ve shown before), and change Logstash to do other things (like adding GeoIP info).

Getting the ingredients

First of all, you’ll probably need to update rsyslog. Most distros come with ancient versions and don’t have the plugins you need. From the official packages you can install:

If you don’t have Kafka already, you can set it up by downloading the binary tar. And then you can follow the quickstart guide. Basically you’ll have to start Zookeeper first (assuming you don’t have one already that you’d want to re-use):

bin/zookeeper-server-start.sh config/zookeeper.properties

And then start Kafka itself and create a simple 1-partition topic that we’ll use for pushing logs from rsyslog to Logstash. Let’s call it rsyslog_logstash:

bin/kafka-server-start.sh config/server.properties
bin/kafka-topics.sh --create --zookeeper localhost:2181 --replication-factor 1 --partitions 1 --topic rsyslog_logstash

Finally, you’ll have Logstash. At the time of writing this, we have a beta of 2.0, which comes with lots of improvements (including huge performance gains of the GeoIP filter I touched on earlier). After downloading and unpacking, you can start it via:

bin/logstash -f logstash.conf

Though you also have packages, in which case you’d put the configuration file in /etc/logstash/conf.d/ and start it with the init script.

Configuring rsyslog

With rsyslog, you’d need to load the needed modules first:

module(load="imuxsock")  # will listen to your local syslog
module(load="imfile")    # if you want to tail files
module(load="omkafka")   # lets you send to Kafka

If you want to tail files, you’d have to add definitions for each group of files like this:

input(type="imfile"
  File="/opt/logs/example*.log"
  Tag="examplelogs"
)

Then you’d need a template that will build JSON documents out of your logs. You would publish these JSON’s to Kafka and consume them with Logstash. Here’s one that works well for plain syslog and tailed files that aren’t parsed via mmnormalize:

template(name="json_lines" type="list" option.json="on") {
  constant(value="{")
  constant(value="\"timestamp\":\"")
  property(name="timereported" dateFormat="rfc3339")
  constant(value="\",\"message\":\"")
  property(name="msg")
  constant(value="\",\"host\":\"")
  property(name="hostname")
  constant(value="\",\"severity\":\"")
  property(name="syslogseverity-text")
  constant(value="\",\"facility\":\"")
  property(name="syslogfacility-text")
  constant(value="\",\"syslog-tag\":\"")
  property(name="syslogtag")
  constant(value="\"}")
}

By default, rsyslog has a memory queue of 10K messages and has a single thread that works with batches of up to 16 messages (you can find all queue parameters here). You may want to change:
– the batch size, which also controls the maximum number of messages to be sent to Kafka at once
– the number of threads, which would parallelize sending to Kafka as well
– the size of the queue and its nature: in-memory(default), disk or disk-assisted

In a rsyslog->Kafka->Logstash setup I assume you want to keep rsyslog light, so these numbers would be small, like:

main_queue(
  queue.workerthreads="1"      # threads to work on the queue
  queue.dequeueBatchSize="100" # max number of messages to process at once
  queue.size="10000"           # max queue size
)

Finally, to publish to Kafka you’d mainly specify the brokers to connect to (in this example we have one listening to localhost:9092) and the name of the topic we just created:

action(
  broker=["localhost:9092"]
  type="omkafka"
  topic="rsyslog_logstash"
  template="json"
)

Assuming Kafka is started, rsyslog will keep pushing to it.

Configuring Logstash

This is the part where we pick the JSON logs (as defined in the earlier template) and forward them to the preferred destinations. First, we have the input, which will use to the Kafka topic we created. To connect, we’ll point Logstash to Zookeeper, and it will fetch all the info about Kafka from there:

input {
  kafka {
    zk_connect => "localhost:2181"
    topic_id => "rsyslog_logstash"
  }
}

At this point, you may want to use various filters to change your logs before pushing to Logsene or Elasticsearch. For this last step, you’d use the Elasticsearch output:

output {
  elasticsearch {
    hosts => "logsene-receiver.sematext.com:443" # it used to be "host" and "port" pre-2.0
    ssl => "true"
    index => "your Logsene app token goes here"
    manage_template => false
    #protocol => "http" # removed in 2.0
    #port => "443" # removed in 2.0
  }
}

And that’s it! Now you can use Kibana (or, in the case of Logsene, either Kibana or Logsene’s own UI) to search your logs!

Recipe: Apache Logs + rsyslog (parsing) + Elasticsearch

More than two years ago we posted a recipe on how to centralize syslog in Elasticsearch in order to search and analyze them with Kibana, all by using only rsyslog. This works well, because rsyslog is fast and light, as we shown in later posts and recent presentations.

This recipe is about tailing Apache HTTPD logs with rsyslog, parsing them into structured JSON documents, and forwarding them to Elasticsearch (or our log analytics SaaS, Logsene, which exposes the Elasticsearch API). Having them indexed in a structured way will allow you to do better analytics with tools like Kibana:

Kibana_screenshot

We’ll also cover pushing system logs and how to buffer them properly, so it’s an updated, more complete recipe compared to the old one.

Getting the ingredients

Even though most distros already have rsyslog installed, it’s highly recommended to get the latest stable from the rsyslog repositories. This way you’ll benefit from the last two to five years of development (depending on how conservative your distro is). The packages you’ll need are:

With the ingredients in place, let’s start cooking a configuration. The configuration needs to do the following:

  • load the required modules
  • configure inputs: tailing Apache logs and system logs
  • configure the main queue to buffer your messages. This is also the place to define the number of worker threads and batch sizes (which will also be Elasticsearch bulk sizes)
  • parse common Apache logs into JSON
  • define a template where you’d specify how JSON messages would look like. You’d use this template to send logs to Logsene/Elasticsearch via the Elasticsearch output

Loading modules

Here, we’ll need imfile to tail files, mmnormalize to parse them, and omelasticsearch to send them. If you want to tail the system logs, you’d also need to include imuxsock and imklog (for kernel logs).

# system logs
module(load="imuxsock")
module(load="imklog")
# file
module(load="imfile")
# parser
module(load="mmnormalize")
# sender
module(load="omelasticsearch")

Configure inputs

For system logs, you typically don’t need any special configuration (unless you want to listen to a non-default Unix Socket). For Apache logs, you’d point to the file(s) you want to monitor. You can use wildcards for file names as well. You also need to specify a syslog tag for each input. You can use this tag later for filtering.

input(type="imfile"
      File="/var/log/apache*.log"
      Tag="apache:"
)

NOTE: By default, rsyslog will not poll for file changes every N seconds. Instead, it will rely on the kernel (via inotify) to poke it when files get changed. This makes the process quite realtime and scales well, especially if you have many files changing rarely. Inotify is also less prone to bugs when it comes to file rotation and other events that would otherwise happen between two “polls”. You can still use the legacy mode=”polling” by specifying it in imfile’s module parameters.

Queue and workers

By default, all incoming messages go into a main queue. You can also separate flows (e.g. files and system logs) by using different rulesets but let’s keep it simple for now.

For tailing files, this kind of queue would work well:

main_queue(
  queue.workerThreads="4"
  queue.dequeueBatchSize="1000"
  queue.size="10000"
)

This would be a small in-memory queue of 10K messages, which works well if Elasticsearch goes down, because the data is still in the file and rsyslog can stop tailing when the queue becomes full, and then resume tailing. 4 worker threads will pick batches of up to 1000 messages from the queue, parse them (see below) and send the resulting JSONs to Elasticsearch.

If you need a larger queue (e.g. if you have lots of system logs and want to make sure they’re not lost), I would recommend using a disk-assisted memory queue, that will spill to disk whenever it uses too much memory:

main_queue(
  queue.workerThreads="4"
  queue.dequeueBatchSize="1000"
  queue.highWatermark="500000"    # max no. of events to hold in memory
  queue.lowWatermark="200000"     # use memory queue again, when it's back to this level
  queue.spoolDirectory="/var/run/rsyslog/queues"  # where to write on disk
  queue.fileName="stats_ruleset"
  queue.maxDiskSpace="5g"        # it will stop at this much disk space
  queue.size="5000000"           # or this many messages
  queue.saveOnShutdown="on"      # save memory queue contents to disk when rsyslog is exiting
)

Parsing with mmnormalize

The message normalization module uses liblognorm to do the parsing. So in the configuration you’d simply point rsyslog to the liblognorm rulebase:

action(type="mmnormalize"
  rulebase="/opt/rsyslog/apache.rb"
)

where apache.rb will contain rules for parsing apache logs, that can look like this:

version=2

rule=:%clientip:word% %ident:word% %auth:word% [%timestamp:char-to:]%] "%verb:word% %request:word% HTTP/%httpversion:float%" %response:number% %bytes:number% "%referrer:char-to:"%" "%agent:char-to:"%"%blob:rest%

Where version=2 indicates that rsyslog should use liblognorm’s v2 engine (which is was introduced in rsyslog 8.13) and then you have the actual rule for parsing logs. You can find more details about configuring those rules in the liblognorm documentation.

Besides parsing Apache logs, creating new rules typically requires a lot of trial and error. To check your rules without messing with rsyslog, you can use the lognormalizer binary like:

head -1 /path/to/log.file | /usr/lib/lognorm/lognormalizer -r /path/to/rulebase.rb -e json

NOTE: If you’re used to Logstash’s grok, this kind of parsing rules will look very familiar. However, things are quite different under the hood. Grok is a nice abstraction over regular expressions, while liblognorm builds parse trees out of specialized parsers. This makes liblognorm much faster, especially as you add more rules. In fact, it scales so well, that for all practical purposes, performance depends on the length of the log lines and not on the number of rules. This post explains the theory behind this assuption, and there are already some preliminary tests to prove it as well (some of which we’ll present at Lucene Revolution). The downside is that you’ll lose some of the flexibility offered by regular expressions. You can still use regular expressions with liblognorm (you’d need to set allow_regex to on when loading mmnormalize) but then you’d lose a lot of the benefits that come with the parse tree approach.

Templates and actions

If you’re using rsyslog only for parsing Apache logs (and not system logs) and send your logs to Logsene, this bit is rather simple. Because by the time parsing ended, you already have all the relevant fields in the $!all-json variable, that you’ll use as a template:

template(name="all-json" type="list"){
  property(name="$!all-json")
}

Then you an use this template to send logs to Logsene via the Elasticsearch API and using your Logsene application token as the index name:

action(type="omelasticsearch"
  template="all-json"  # use the template defined earlier
  searchIndex="LOGSENE-APP-TOKEN-GOES-HERE"
  searchType="apache"
  server="logsene-receiver.sematext.com"
  serverport="80"
  bulkmode="on"  # use the bulk API
  action.resumeretrycount="-1"  # retry indefinitely if Logsene/Elasticsearch is unreachable
)

Putting both Apache and system logs together

Finally, if you use the same rsyslog to parse system logs, mmnormalize won’t parse them (because they don’t match Apache’s common log format). In this case, you’ll need to pick the rsyslog properties you want and build an additional JSON template:

template(name="plain-syslog"
  type="list") {
    constant(value="{")
      constant(value="\"timestamp\":\"")     property(name="timereported" dateFormat="rfc3339")
      constant(value="\",\"host\":\"")        property(name="hostname")
      constant(value="\",\"severity\":\"")    property(name="syslogseverity-text")
      constant(value="\",\"facility\":\"")    property(name="syslogfacility-text")
      constant(value="\",\"tag\":\"")   property(name="syslogtag" format="json")
      constant(value="\",\"message\":\"")    property(name="msg" format="json")
    constant(value="\"}")
}

Then you can make rsyslog decide: if a log was parsed successfully, use the all-json template. If not, use the plain-syslog one:

if $parsesuccess == "OK" then {
 action(type="omelasticsearch"
  template="all-json"
  ...
 )
} else {
 action(type="omelasticsearch"
  template="plain-syslog"
  ...
 )
}

And that’s it! Now you can restart rsyslog and get both your system and Apache logs parsed, buffered and indexed into Logsene. If you rolled your own Elasticsearch cluster, there’s one more step on the rsyslog side.

Time-based indices in your own Elasticsearch cluster

Logsene uses time-based indices out of the box, but in a local setup you’ll need to do this yourself. Such a design will give your cluster a lot more capacity due to the way Elasticsearch merges data in the background (we covered this in detail in our presentations at GeeCON and Berlin Buzzwords).

To make rsyslog use daily or other time-based indices, you need to define a template that builds an index name off the timestamp of each log. This is one that names them logstash-YYYY.MM.DD, like Logstash does by default:

template(name="logstash-index"
  type="list") {
    constant(value="logstash-")
    property(name="timereported" dateFormat="rfc3339" position.from="1" position.to="4")
    constant(value=".")
    property(name="timereported" dateFormat="rfc3339" position.from="6" position.to="7")
    constant(value=".")
    property(name="timereported" dateFormat="rfc3339" position.from="9" position.to="10")
}

And then you’d use this template in the Elasticsearch output instead of a static index name (this also requires setting dynSearchIndex to on):

action(type="omelasticsearch"
  template="all-json"
  dynSearchIndex="on"
  searchIndex="logstash-index"
  searchType="apache"
  server="MY-ELASTICSEARCH-SERVER"
  bulkmode="on"
  action.resumeretrycount="-1"
)

And now you’re really done, at least as far as rsyslog is concerned. For tuning Elasticsearch, have a look at our GeeCON and Berlin Buzzwords presentations. If you have additional questions, please let us know in the comments. And if you find this topic exciting, we’re happy to let you know that we’re hiring worldwide.

Recipe: rsyslog + Redis + Logstash

OK, so you want to hook up rsyslog with Logstash. If you don’t remember why you want that, let me give you a few hints:

  • Logstash can do lots of things, it’s easy to set up but tends to be too heavy to put on every server
  • you have Redis already installed so you can use it as a centralized queue. If you don’t have it yet, it’s worth a try because it’s very light for this kind of workload.
  • you have rsyslog on pretty much all your Linux boxes. It’s light and surprisingly capable, so why not make it push to Redis in order to hook it up with Logstash?

In this post, you’ll see how to install and configure the needed components so you can send your local syslog (or tail files with rsyslog) to be buffered in Redis so you can use Logstash to ship them to Elasticsearch, a logging SaaS like Logsene (which exposes the Elasticsearch API for both indexing and searching) so you can search and analyze them with Kibana:

Kibana_search

Continue reading “Recipe: rsyslog + Redis + Logstash”

Processing Metrics, Logs and Traces at Scale – DevOps Talk

If topics like performance monitoring and processing metrics, log management, and distributed transaction tracing — at scale, no less! — interest you, then you’ll want to check out what Sematext founder Otis Gospodnetić had to say at this week’s DevOps Summit in New York City.

Talk Summary

Application metrics, logs, and business KPIs are a goldmine. It’s easy to get started with the ELK stack (Elasticsearch, Logstash and Kibana) — you can see lots of people coming up with impressive dashboards, in less than a day, with no previous experience. Going from proof-of-concept to production tends to be a bit more difficult, unfortunately, and it tends to gobble up our attention, time, and money. In this talk Otis shared the architecture and decisions behind our services for handling large volumes of performance metrics, traces, logs, anomaly detection, alerts, etc.  He followed data from its sources, its collection, aggregation, storage, and visualization. The talk also covered the overview of some of the relevant technologies and their strengths and weaknesses, such as HBase, Elasticsearch and Kafka.


Feedback and Solutions for Monitoring and Logging

Just drop us an email or DM us if you have questions or comments about the presentation — we love feedback!  Or, if you have an interest in chatting about the solutions mentioned in it like SPM performance monitoring and Logsene log management and analytics we’re happy to engage about them as well.

Docker Monitoring Support

[ Note: Click here for the Docker Monitoring webinar video recording and slides. And click here for the Docker Logging webinar video recording and slides. ]

——-

Containers and Docker are all the rage these days.  In fact, containers — with Docker as the leading container implementation — have changed how we deploy systems, especially those comprised of micro-services. Despite all the buzz, however, Docker and other containers are still relatively new and not yet mainstream. That being said, even early Docker adopters need a good monitoring tool, so last month we added Docker monitoring to SPM.  We built it on top of spm-agent – the extensible framework for Node.js-based agents and ended up with sematext-agent-docker.

Monitoring of Docker environments is challenging. Why? Because each container typically runs  a single process, has its own environment, utilizes virtual networks, or has various methods of managing storage. Traditional monitoring solutions take metrics from each server and application they run. These servers and the applications running on them are typically very static, with very long uptimes. Docker deployments are different: a set of containers may run many applications, all sharing the resources of a single host. It’s not uncommon for Docker servers to run thousands of short-term containers (e.g., for batch jobs) while a set of permanent services runs in parallel.  Traditional monitoring tools not used to such dynamic environments are not suited for such deployments. SPM, on the other hand, was built with this in mind.  Moreover, container resource sharing calls for stricter enforcement of resource usage limits, an additional issue you must watch carefully. To make appropriate adjustments for resource quotas you need good visibility into any limits containers have reached or errors they have caused. We recommend using alerts according to defined limits; this way you can adjust limits or resource usage even before errors start happening.

How do we get a detailed metrics of each container?

Docker provides a remote interface for container stats (by default exposed via UNIX domain socket). The SPM agent for Docker uses this interface to collect Docker metrics.

SPM for Docker

SPM Docker Agent monitoring other containers, itself running in a Docker container

How to deploy monitoring for Docker

There are several ways one can run a Docker monitor, including:

  1. run it directly on the host machine (“Server” in the figure above)
  2. run one agent for multiple servers
  3. run agent in a container (along containers it monitors) on each server

SPM uses approach 3), aka the “Docker Way”. Thus, SPM for Docker is provided as a Docker Image. This makes the installation easy, requires no installation of dependencies on the host machine compared to approach 1), and it requires no configuration of a server list to support multiple Docker servers.

How to install SPM for Docker

It’s very simple: Create an SPM App of type “Docker” to get the SPM application token (for $TOKEN, see below), and then run:

  1. docker pull sematext/sematext-agent-docker and
  2. docker run -d  -v /var/run/docker.sock:/var/run/docker.sock -e SPM_TOKEN=$TOKEN sematext/sematext-agent-docker

You’ll see your Docker metrics in SPM after about a minute.

SPM for Docker – Features

If you already know SPM then you’re aware that each SPM integration supports all SPM features.  If, however, you are new to SPM, this summary will help:

  1. Out-of-the-box Dashboards and unlimited custom Dashboards
  2. Multi-user support with role-based access control, application and account sharing
  3. Threshold-based Alerts on all metrics mentioned above including Custom Metrics
  4. Machine learning-based Anomaly Detection on all metrics, including Custom Metrics
  5. Alerting via email, PagerDuty, Nagios and Webhooks  (e.g. Slack, HipChat)
  6. Email subscriptions for scheduled Performance Reports
  7. Secure sharing of graphs and reports with your team, or with the public
  8. Correlation with logs shipped to Logsene
  9. Charting and correlation with arbitrary Events

Let’s continue with the Docker-specific part:

  1. Easy to install docker agent
  2. Monitoring of multiple Docker Hosts and unlimited number of Containers per ‘SPM Docker App’
  3. Predefined Dashboards for all Host and Container metrics
  • OS Metrics of the Docker Host
  • Detailed Container Metrics
    • CPU
    • Memory
    • Network
    • I/O Metrics
  • Limits of Resource Usage
    • CPU throttled times
    • Memory limits
  • Fail counters (e.g., for memory allocation and network packets)
  • Filter and aggregations by Hosts, Images, Container IDs, and Tags

docker-overview-2SPM for Docker – Predefined Dashboard ‘Overview’

Containerized applications typically communicate with other applications via the exposed network ports; that’s why network metrics are definitely on the hot list of metrics to watch for Docker and a reason to provide such detailed Reports in SPM:

Docker-Network-Metrics

Did you enjoy this little excursion on Docker monitoring? Then it’s time to practice it!

We appreciate feedback of early adopters, so please feel free to drop us a line, DM us on Twitter @sematext or chat with us using the web chat in SPM or on our homepage — we are here to get your monitoring up and running.  If you are a startup, get in touch – we offer discounts for startups!

Hiring: Full-stack Java Developers

Sematext is looking for a strong full-stack developers (remote work is cool!) who:

  • Find creative and elegant solutions, build tools, avoid repetition and boilerplate code
  • Take ownership and push forward; want to help build the team and the organization
  • Like working with data-intense applications, continuous data streams (e.g. metrics, logs, events), visualization and data analytics
  • Want to have fun, enjoy building new things and improving existing ones

Some info about our tech:

  • Java in the backend, with a bit of Akka
  • Java and NodeJS for various SPM agents
  • A series of Machine Learning algorithms for Anomaly Detection
  • HBase and Elasticsearch for storing massive volumes of data (many billions of “rows”… stopped counting long ago)
  • Jetty and Kafka that handle hundreds of thousands of events/metrics/logs/messages per second
  • MySQL, ZooKeeper (obviously)
  • Apache Flume, rsyslog, Logstash, and Kibana
  • Lots of JavaScript in the Boostrap-based UI layer – jQuery and various other usual suspects
  • Flot for charting (and looking to replace that with something more modern, yes)
  • Solr, but just for search-lucene.com and search-hadoop.com, which are not related to this opening
  • Everything runs on AWS – we own a total of 2 physical servers

Products / Services you’d be building:

  • SPM – monitoring, alerting, anomaly detection.  A lot has been done, and a lot more is in the queue.
  • Logsene – log collection, indexing, searching, alerting, anomaly detection.  A lot of new features are waiting to be built.
  • Search Analytics – it works, it runs, it has customers, but there is so much more value we can extract from query and click data!
  • NewAppHere – can’t talk about it, but it’s going to be big… and not only in Japan

Good to have skills:

  • Java – for various backend components
  • JavaScript (frameworks/libraries) – if you’re truly full-stack
  • We can teach you or at least help you catch up quickly with everything else mentioned above as well as custom bits not mentioned here

A bit about Sematext:

  • HQ in NYC, with people in North America, Europe, and Asia
  • Developers with strong open-source backgrounds
  • Deep expertise in Solr and Elasticsearch – we are also a leading provider of consulting and support for tons of clients
  • Some of our engineers give talks at conferences around the world and write books
  • We are totally self-funded, financially independent, and profitable
  • Chirping via @sematext

Got more questions?  Send them our way!  Better yet, send your resume!

Custom Elasticsearch Index Templates in Logsene

One of the great things about Logsene, our log management tool, is that you don’t need to care about the back-end – you know, where you store your logs. You just pick a log shipper (here are Top 5 Log Shippers), point it to Logsene (here’s How to Send Logs to Logsene) and you are done. Logsene takes care of everything for you – your logs stop filling up your disk, you don’t have to worry about log compression and rotation, your logs get indexed so when you need to troubleshoot issues you have one place where you get see and search all your logs from all your applications, servers, and environments. This is all nice and dandy, but what if your logs are special and you want them analyzed in a specific way, and not the way Logsene’s predefined index templates and analysis work?  To handle such use cases we’ve recently made it possible for Logsene users to define how their logs are analyzed. Let’s look at an example.

Continue reading “Custom Elasticsearch Index Templates in Logsene”

Integrating SPM Performance Monitoring with Slack

Many distributed DevOps teams rely on Slack,  a platform for team communication providing everything in one place, instantly searchable and available wherever you go.  SPM Performance Monitoring‘s new integration via WebHooks provides the capability to forward alerts to many services, including Slack.

The integration of both services can be achieved by using the WebHook URL from Slack and then configuring this WebHook in SPM.  The SPM Wiki explains how to get this information from Slack and build the WebHook in SPM: Alerts – Slack integration

spm-slack-alert-logo

This whole process only takes a minute or two.  Slack is a tool that is becoming more popular among the DevOps crowd, and here at Sematext we pride ourselves on staying on top of what our users need and expect.

Need some extra help with this setup or another app you might want to integrate?  Have ideas for other integrations we should explore? Please drop us a line, we’re here to help and listen.