How to forward CloudTrail (or other logs from AWS S3) to Logsene

This recipe shows how to send CloudTrail logs (which are .gz logs that AWS puts in a certain S3 bucket) to a Logsene application, but should apply to any kinds of logs that you put into S3. We’ll use AWS Lambda for this, but you don’t have to write the code. We’ve got that covered.

The main steps are:
0. Have some logs in an AWS S3 bucket 🙂
1. Create a new AWS Lambda function
2. Paste the code from this repository and fill in your Logsene Application Token
3. Point the function to your S3 bucket and give it permissions
4. Decide on the maximum memory to allocate for the function and the timeout for its execution
5. Explore your logs in Logsene 🙂

Continue reading “How to forward CloudTrail (or other logs from AWS S3) to Logsene”

Join Sematext at AWS Summit in New York City on July 10

Live, work or occasionally travel to New York City?  Going to be in our sleepy little town next Thursday, July 10th?  If the answer is “yes” (coupled with the fact that you’re reading our blog) then you might be interested to know that Sematext will be exhibiting at the AWS Summit in New York City on Thursday, July 10.  We’ll be in booth 323 AND we’re holding an iPad giveaway!

We encourage you to stop by, say hello, and check out the new goodies in SPM and the new Logsene Log Management and Analytics UI and functionality.   Now that SPM and Logsene are seamlessly integrated, you can not only find out that SOMETHING happened with AWS (or just about any other app), but also exactly WHAT happened.

If you are going to AWS Summit and want to set up a personal demo on site, drop us a line at mick.emmett@sematext.com.  Hope to see you there!

Not Going to AWS Summit in NYC?  You Can Still Try SPM and Logsene for Free

Try Logsene and/or SPM Performance Monitoring for Free for 30 days by registering here.  There’s no commitment and no credit card required.  You can also check out a live demo and see Storm, Kafka, Solr, Elasticsearch, Hadoop, HBase, MySQL, and other types of apps being monitored.

We’re Hiring!

If you are planning to attend AWS Summit New York — and even if you’re not — and you enjoy performance monitoring, log analytics, or search analytics, working with projects like Elasticsearch, Solr, HBase, Hadoop, Kafka, and Storm, then stop by our booth and meet us in person (or drop us a line)!  We’re hiring planet-wide!  Front end and JavaScript Developers, Developer Evangelists, Full-stack Engineers, Mobile App Developers…get in touch!

Announcement: What’s New in SPM Performance Monitoring

A new SPM Performance Monitoring release was just pushed to production and it’s chock full of great new stuff to complement its proactive performance monitoring, alerting, anomaly detection, etc., available in the Cloud or On Premise.  Here is a run-down of the juicier additions. The slightly longer version can be found in the SPM Changelog.

Integration with Logsene Log Management and Analytics

SPM performance monitoring now gives users access to even more metrics by seamlessly integrating with event data and logs via Logsene Log Management and Analytics.  This enables correlation across performance metrics, alerts, anomalies, events, logs, and provides a single pane of glass across any organization’s IT infrastructure.

Monitoring Support for More Applications

We’ve added native monitoring support for the following applications to complement monitoring for Solr, Elasticsearch, Hadoop, HBase, Storm, Redis, Kafka, ZooKeeper and many others.

Screenshots

Eager to see pictures instead of reading content?  Then jump below to see screenshots of these apps being monitored.

UI/UX Improvements

UI/UX improvements include: zooming and panning, client-side caching, wider and simpler metric charts, new filter slide-out panels with search capabilities, quick access to all dashboards and easier dashboard creation, and more.

Event Graphs

Events and event graphs are now integrated into SPM Performance Monitoring.  You can now correlate various types of events, such as alerts, anomalies, application deployments, restarts, releases, server reboots, etc., with performance metrics graphs, as well as with logs and log graphs.  Many of you will also be happy to hear that SPM can now turn Alerts into Events, and graph them as well.  Check out Event Integration if you want to publish your own Events.

More Powerful Storm Monitoring

SPM Storm monitoring now serves up more metrics, more graphs and provides more granular details.  This includes the addition of metric filters and the ability to monitor not just Spouts and Bolts, but also monitor Storm Workers.

Dashboard Enhancements

Creating and working with dashboards just got a lot more intuitive and flexible.  This includes:

  • creating new dashboards via an intuitive “build your own dashboard” tool
  • easier navigation via Miller Columns (think column-oriented view in OSX Finder)
  • adding whatever graphs you want to an existing or brand new dashboard from within that dashboard
  • a pull down menu to select specific dashboards for much quicker access to a specific dashboard

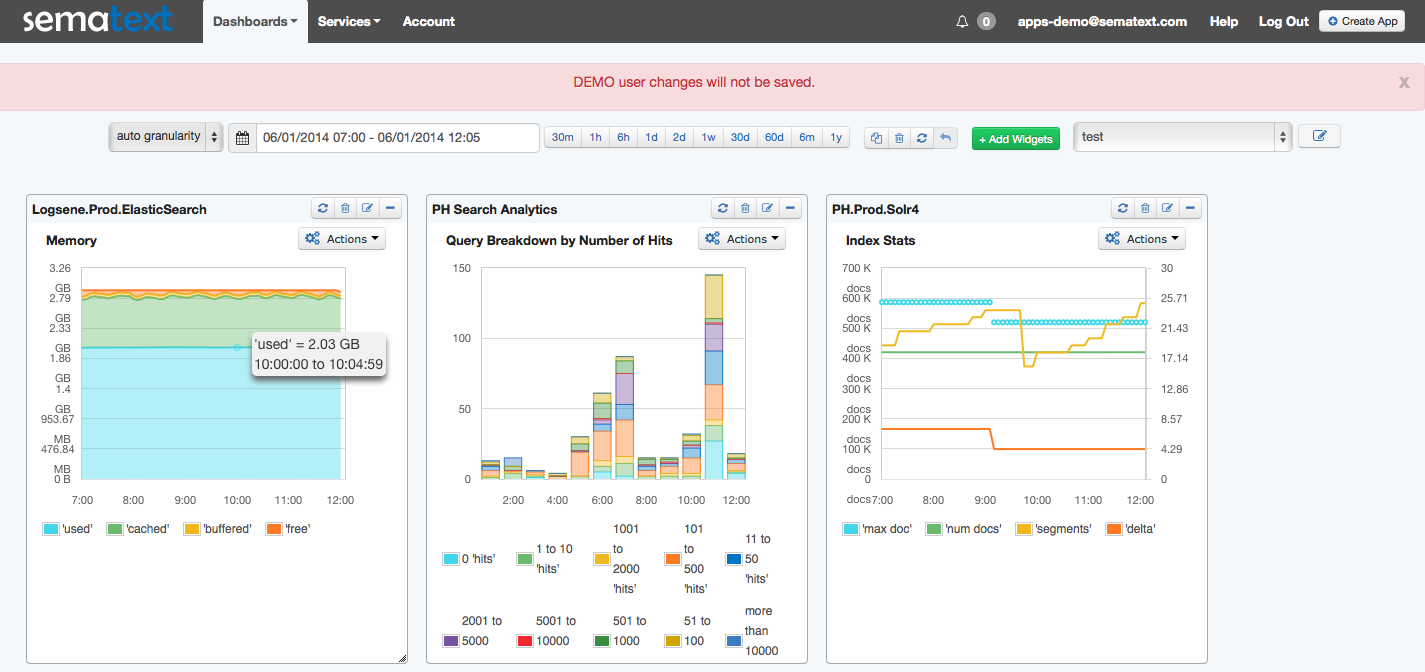
Screenshot – SPM Dashboard (one of many possible views; click to enlarge)

Dashboard_test

Screenshot – Cassandra Overview  (click to enlarge)

cassandra_overview

Screenshot – MySQL Overview  (click to enlarge)

MySQL Overview

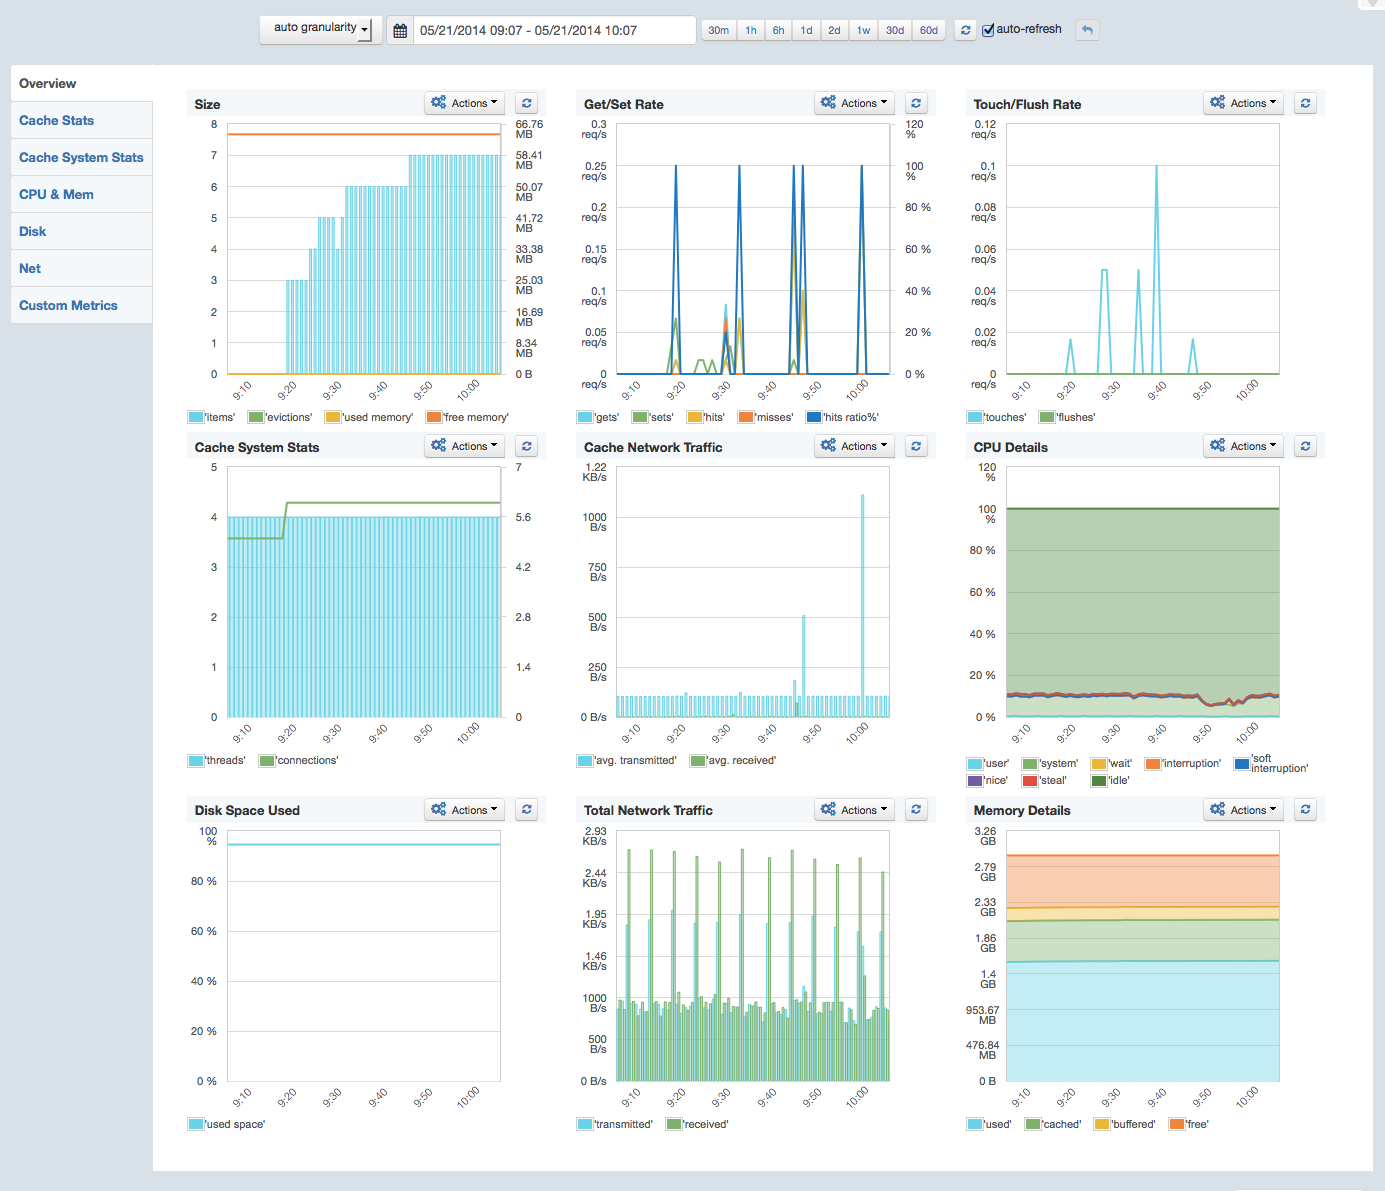
Screenshot – Memcached Overview  (click to enlarge)

memcached-overview

Screenshot – Apache Monitoring Overview  (click to enlarge)

Apache Overview

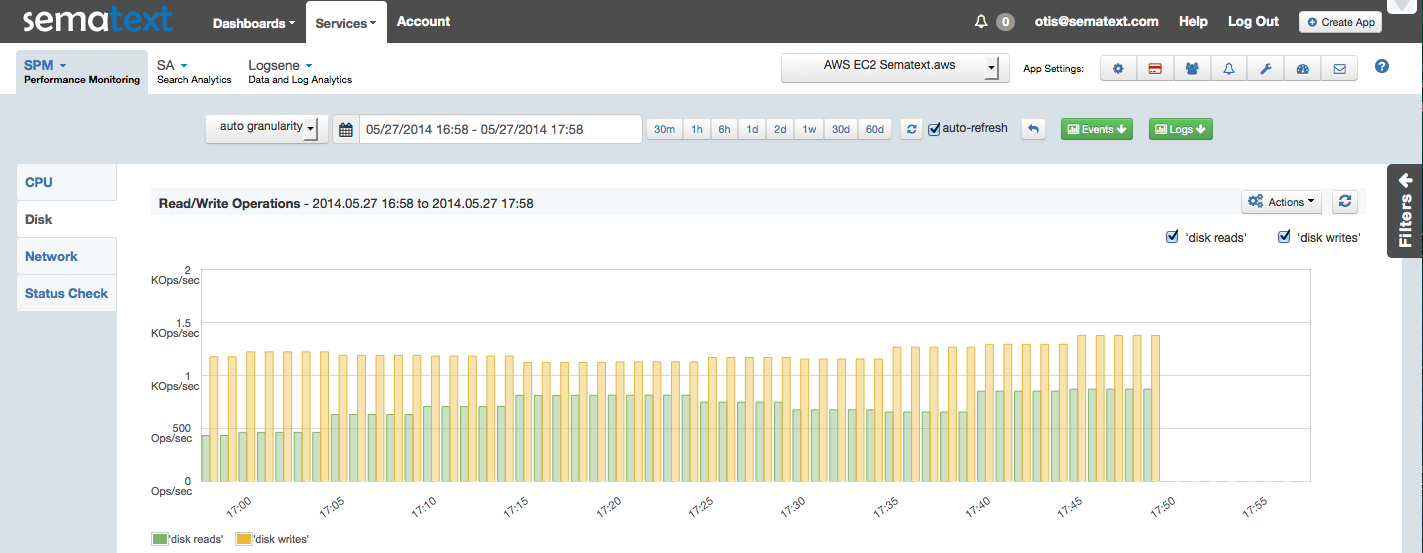
Screenshot – AWS CloudWatch EBS Read/Write Bandwidth  (click to enlarge)

AWS_EBS Read:Write Bandwidth

Live Demo

Check out SPM’s live demo to see it for yourself.  You won’t find any demo apps showing Cassandra or Memcached metrics because we don’t use them at Sematext yet, but you’ll be able to poke around and see other types of apps being monitored — like Solr, Kafka, Hadoop and HBase, for example — along with MySQL, AWS, and Apache.

Consolidate Your App Monitoring — It’s Easy!

Many organizations tackle performance monitoring with a mish-mash of different monitoring and alerting tools cobbled together in an uneasy coexistence that is often far from seamless. SPM takes all that hassle away and makes it easy and comprehensive in one step.

Try SPM for Free for 30 Days

Try SPM Performance Monitoring for Free for 30 days by registering here.  There’s no commitment and no credit card required.

We’re Hiring!

If you enjoy performance monitoring, log analytics, or search analytics, working with projects like Elasticsearch, Solr, HBase, Hadoop, Kafka, and Storm, then drop us a line.  We’re hiring planet-wide!  Front end and JavaScript Developers, Developer Evangelists, Full-stack Engineers, Mobile App Developers…get in touch!

Announcement: AWS CloudWatch Metrics in SPM

Wouldn’t it be great to have metrics for your AWS resources captured in one place?  And beyond just capturing them, to also have the ability to do useful things with those metrics like create custom dashboards, detect and get alerted on metric anomalies, correlate them with other application events and logs, etc., all in a single pane of glass?  Well…you can!  SPM Performance Monitoring Alerting and Anomaly Detection now captures metrics about your AWS resources via AWS CloudWatch.  This includes system-wide visibility into resource utilization, application performance, and operational health.

Why is this important?

AWS shows metrics for various AWS resources in CloudWatch available via AWS Management Console.  This is nice, but it is not very practical if you already use and prefer SPM for your non-AWS resources (e.g. servers and applications running in your data center) or if you are already shipping your logs to Logsene.  Do you really want to use another, separate UI for monitoring just your AWS resources?  It’s also not practical to use alerting in CloudWatch if you already use alerting and anomaly detection functionality in SPM. Now that SPM gathers metrics for your AWS resources you can have a single place to see all your metrics, alerts, and anomalies.

Today we are exposing all Elastic Cloud Compute (EC2), Elastic Load Balancer (ELB), and Elastic Block Store (EBS) metrics in SPM.  We will continue to add other AWS services to this list.  Having AWS metrics in SPM means that you can apply not only threshold-based alerting to your AWS metrics, which AWS itself provides, but also SPM Anomaly Detection which is much more useful and which AWS CloudWatch does not offer.

Headache-relieving and Time-saving Benefits for Your Organization

Major benefits to using SPM to monitor AWS CloudWatch include:

  • there is nothing to install (i.e., it’s all agentless)
  • AWS cost and performance optimization
  • increase in transparency (i.e., now that AWS metrics are in a common monitoring app more people in your organization can see what you have running in AWS)

Have a look at a few of the screenshots to see some of the AWS metrics SPM graphs.  You can also check out SPM’s live demo. Or, if you prefer to see the full list of AWS metrics SPM captures, just jump down past the screenshots to see them listed below.

EBS Read/Write Bandwidth  (click to enlarge)

AWS_EBS Read:Write Bandwidth


EBS Read/Write Latency  (click to enlarge)

AWS_EBS Read:Write Latency


EC2 CPU Utilization  (click to enlarge)

AWS_EC2 CPU Utilization


EC2 Read/Write Operations per Second  (click to enlarge)

AWS_EC2 Read:Write Operations


EC2 Network In/Out  (click to enlarge)

AWS_EC2 Network In:Out


ELB Backend 2XX/3XX/4XX/5XX Response Counts  (click to enlarge)

AWS_ELB Backend Responses


ELB Healthy and Unhealthy Instance Counts  (click to enlarge)

AWS_ELB Healthy:Unhealthy Instances


ELB Request Count  (click to enlarge)

AWS_ELB Requests Count

AWS Metrics List

Here is the complete list of AWS metrics that SPM gathers as of today:

EC2:

  • CPU Utilization
  • Disk Read Operations
  • Disk Write Operations
  • Disk Read Bytes
  • Disk Write Bytes
  • Network In
  • Network Out
  • Status Check Failed
  • Status Check Failed (Instance)
  • Status Check Failed (System)

ELB:

  • Healthy Host Count
  • UnHealthy Host Count
  • Request Count
  • Latency
  • ELB 4XX Responses Count
  • ELB 5XX Responses Count
  • Backend 2XX Responses Count
  • Backend 3XX Responses Count
  • Backend 4XX Responses Count
  • Backend 5XX Responses Count
  • Backend Connection Errors Count
  • Surge Queue Length
  • Spillover Count

EBS:

  • Volume Read Bytes
  • Volume Write Bytes
  • Volume Read Ops
  • Volume Write Ops
  • Volume Total Read Time
  • Volume Total Write Time
  • Volume Idle Time
  • Volume Queue Length

Metrics available for IOPS provisioned instances:

  • VolumeThroughputPercentage
  • VolumeConsumedReadWriteOps

Please tell us what you think – @sematext is always listening!  Is there something SPM Performance Monitoring doesn’t monitor that you would really like to monitor?

Try SPM for Free for 30 Days

Try SPM Performance Monitoring for Free for 30 days by registering here.  There’s no commitment and no credit card required.

We’re Hiring!

If you enjoy performance monitoring, log analytics, or search analytics, working with projects like Elasticsearch, Solr, HBase, Hadoop, Kafka, and Storm, then drop us a line.  We’re hiring planet-wide!  Front end and JavaScript Developers, Developer Evangelists, Full-stack Engineers, Mobile App Developers…get in touch!

EC2 Neighbour Caught Stealing CPU

We run all our services (SPM, Search Analytics, and Logsene) on top of AWS.  We like the flexibility and the speed of provisioning and decommissioning instances.  Unfortunately, this “new age” computing comes at a price.  Once in a while we hit an EC2 instance that has a loud, noisy neighbour.  Kind of like this:

Noisy Jack Nicholson

Unlike in real life, you can’t really hear your noisy neighours in virtualized worlds.  This is kind of good – if you don’t hear them, they won’t bother you, right? Wrong! Oh yes, they will bother you, it’s just that without proper tools you won’t really realize when they’ve become load, how loud they got, and how much their noise is hurting you! So while it’s true you can’t hear these neighbours, you can see them!  Have a look at this graph from SPM:

Noisy neighbour(s) stealing your CPU
Noisy neighbour(s) stealing your CPU. Click for a larger and sharper image.

What we see here is a graph for CPU “steal time” for one of our HBase servers.  Luckily, this happens to be one of our HBase masters, which doesn’t do a ton of CPU intensive work.  What we see is that somebody, some other VM(s) sharing the same underlying host, is stealing about 30% of the CPU that really belongs to us.  Sounds bad, doesn’t it?  What exactly does that mean?  It means that about 30% of the time, applications on this instance (i.e., in our VM) try to use the CPU and the CPU is not available.  Bummer. Of course, this happens at a very, very low level, so from the outside, without this sort of insight, everything looks OK — it’s impossible to tell whether applications are not getting the CPU cycles when they need them by just looking at applications themselves.

So, do you know how noisy your virtual neighbours are?  Do you know how much they steal from you?

If you want to see what your neighbour situation is, whether on AWS or in some other virtualized environment, this is what you can do:

  1. Get SPM (pick “Java” for your SPM Application type once you get in even if you don’t need to monitor any Java apps, yes)
  2. Run the installer, but don’t bother with the “monitor” (aka SPM Monitor) piece – all you need to know are your CPU metrics and for that we don’t need the monitor piece to be running at all actually.
  3. Go to http://apps.sematext.com/ and look at the “CPU & Mem” tab
  4. Unselect all metrics other than “steal”, as show in the image above.  Select each server you want to check in the filter right of that graph (not shown in the image) to check one server at a time.
  5. Make use of SPM alerts and set them up so you get notified when the CPU steal percentage goes over a certain threshold that you don’t want to tolerate. This way you’ll know when it’s time to consider moving to a new VM/instance.

What do you do if you find out you do have noisy neighbours?

There are a couple of options:

  • Be patient and hope they go to sleep or move out
  • Pack your belongings, launch a new EC2 instance, and move there after ensuring it doesn’t suffer from the same problem
  • Create more noise than your neighbour and drive him/her out instead. Yes, I just made this up.

In this particular case, we’ll try the patient option first and move out only when the noise starts noticeably hurting us or we run out of patience.  Happy monitoring!