There has been a “storm” brewing here at Sematext recently. Fortunately this has nothing to do with the fierce winter weather many of us are experiencing in different parts of the globe — it’s actually a good kind of storm! We’ve gotten a lot of requests to add Apache Storm support to SPM and we’re please to say that is now a reality. SPM can already monitor Kafka, ZooKeeper, Hadoop, Elasticsearch, and more. As a matter of fact, we’ve just announced Redis monitoring, too!
Here’s why you should care:
- SPM users can see different Storm metrics in dynamic , real-time graphs, a big improvement from the standard Storm UI which only allows some time-specific snapshots. Isn’t it better to see trends as opposed to static snapshots? We certainly think so.
- SPM users can create an external link and share their charts with others (like a Mailing List or in a blog post) to get insight into problems without having to provide login credentials. Here’s an example (you will see the chart even though you don’t know UN/PW): https://apps.sematext.com/spm-reports/s/aQjuv5GdC1
- SPM also provides its users with common System and JVM-related metrics like CPU usage, memory usage, JVM heap size and pool utilization, among others. This lets you troubleshoot performance issues better by allowing you to correlate Storm-specific metrics with common System and JVM metrics.
- …
Here are the Storm metrics SPM can now monitor:
- Supervisors count
- Topologies count
- Supervisor total/free/used slots count
- Topology workers/executors/tasks count
- Topology spouts/bolts/state spouts count
- Bolt emitted/transferred events
- Bolt acked/executed/failed events
- Bolt executed/processed latencies
- Spout emitted/transferred events
- Spout acked/failed events
- Spout complete latency
Also important to note — users can add alerting rules for all metrics, including Algolerts and heartbeat alerts, as well as receive daily, weekly, and monthly performance reports via email.
Here are some of the graphs — click on them to see larger versions:
Overview

For observing the general state of the system
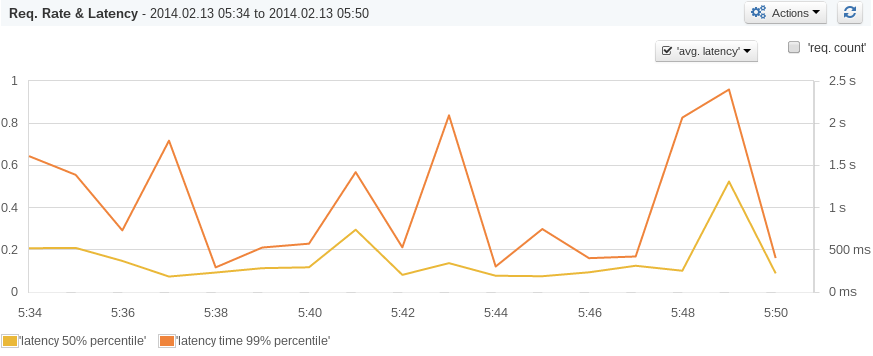
Acked-Failed Decrease

Do you see how “acked” (blue line) decreased? It may be related to some problems with resources (e.g., CPU load)
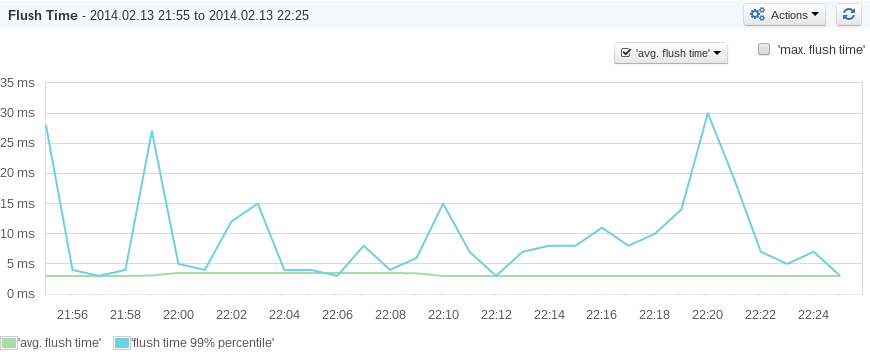
Timing-Increased

Check out this “Timing” chart: see the spike at ~13:21? It seems that something is up with the CPU (again); it might be the “pressure” from Java GC (Garbage Collector)
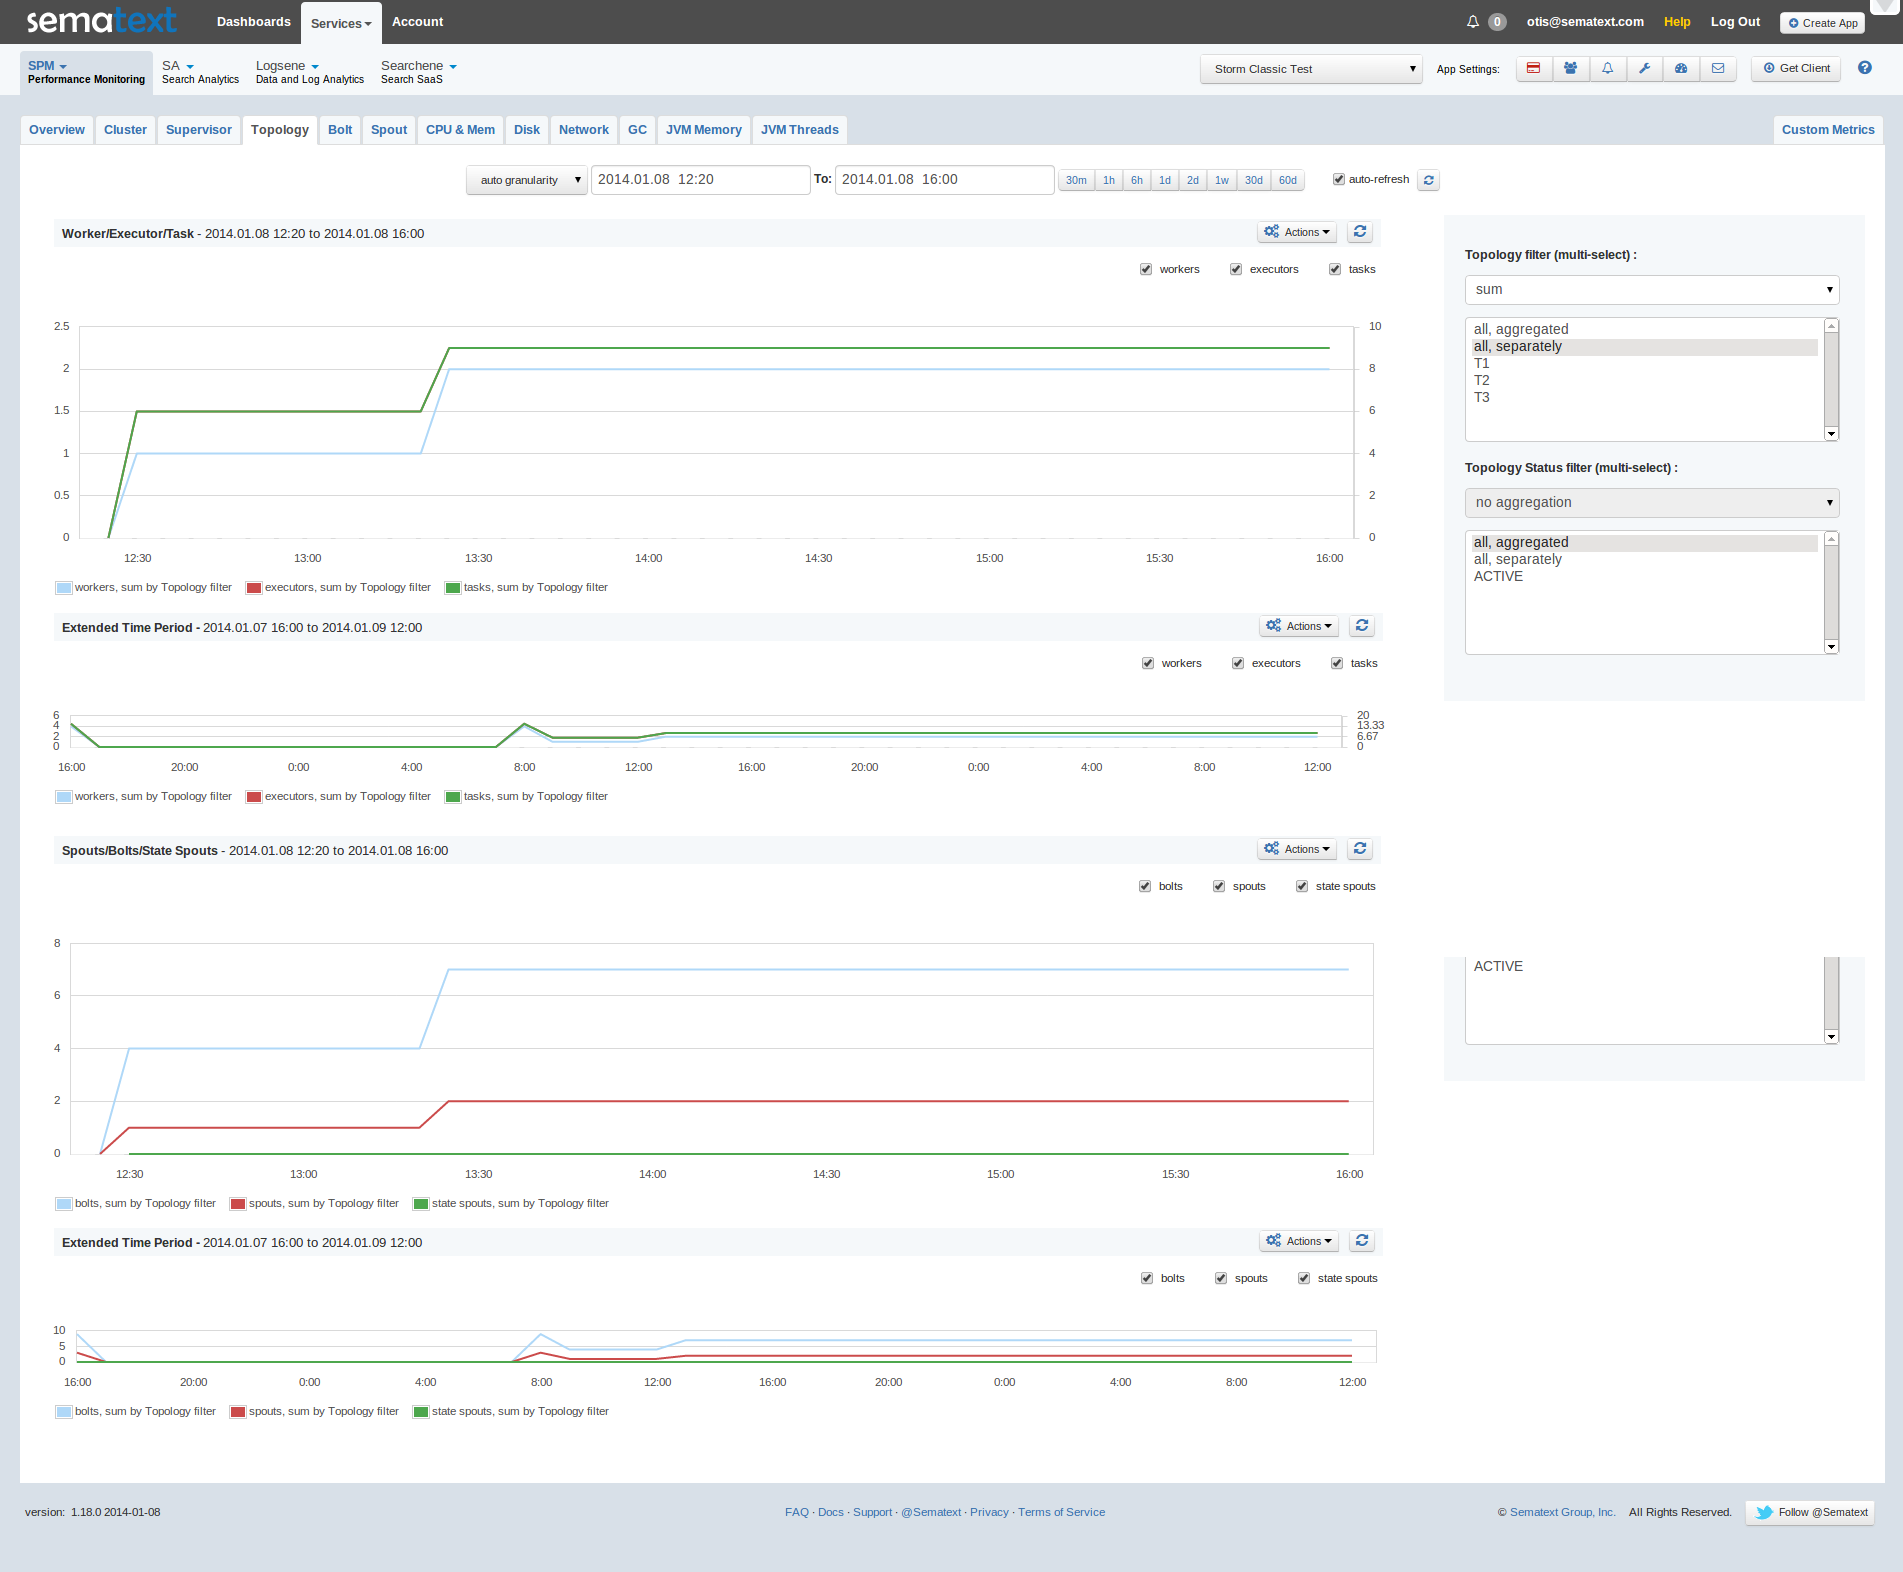
Start-Topology-Workers

On the first chart you can see how the counts of tasks and workers grew. It is because a new topology (“job” in Storm terminology) started at 12:25.
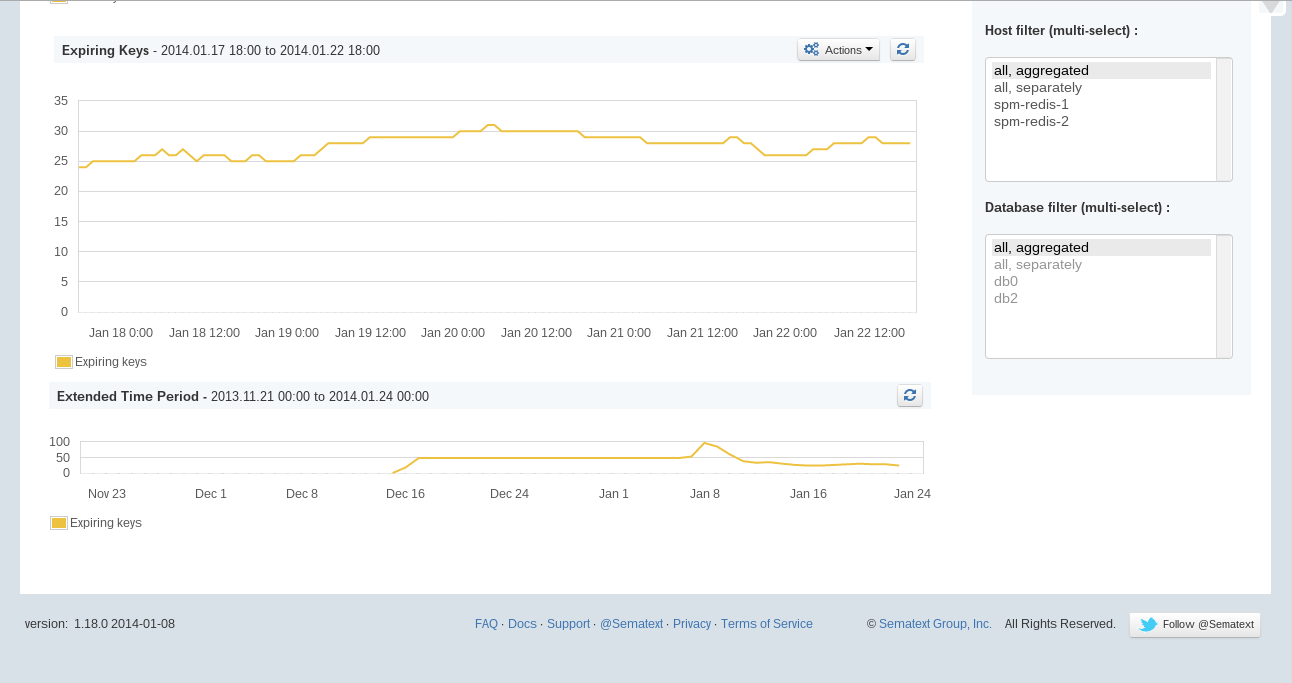
Start-Topology

The same as above: you can see that between 12:00 and 12:30 Storm Supervisor was restarted (something that works on each machine inside the cluster) and topology was added after restarting.
Give SPM a spin – it’s free to get going and you’ll have it up and running, graphing all your Storm metrics in 5 minutes!
If you enjoy performance monitoring, log analytics, or search analytics, working with projects like Elasticsearch, Solr, HBase, Hadoop, Kafka, Storm, we’re hiring planet-wide!