Great news for for those of us who use PagerDuty and manage — or are considering managing — logs with Logsene: PagerDuty and Logsene are now integrated!
This integration is a huge time- and aggravation-saver for DevOps professionals who wouldn’t mind dramatically reducing the frequent “noise” from log-generated monitoring alarms.
In case you’re not familiar, Logsene is an enterprise-class log management solution. Logsene can receive logs from a wide array of logs shippers, such as Fluentd, Logstash, and Syslog, and supports many logging frameworks for programming languages such as: Java, Scala, Go, Node.js, Ruby, Python, .Net, Perl, and more. Among other capabilities, Logsene exposes the Elasticsearch API, works with Kibana and with Grafana (video), and has built-in alerts and anomaly detection. It is available both in the Cloud (SaaS) and On Premises.
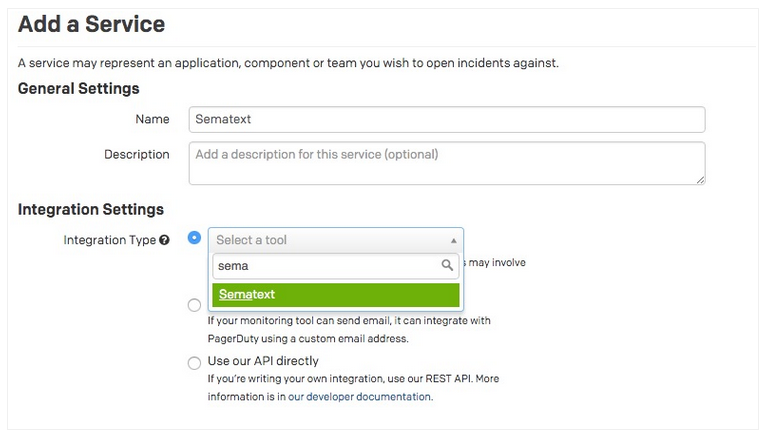
1) In your account, go to Services click +Add New Service
2) Enter in a name for your new service
3) Start typing “Sematext” for the Integration Type, which will narrow your filtering
4) Select an escalation policy. Then, adjust the incident settings to your liking, then click Add Service.
5) Once the service is created, you’ll be taken to the service page. On this page, you’ll see the Service Integration Key, which you will need when you configure Sematext products to send events to PagerDuty. Copy the Service Integration Key to the clipboard.
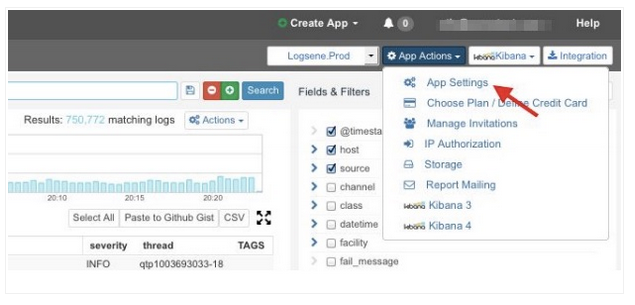
In Logsene
1) Navigate to App Actions of your Logsene App by clicking the App Settings menu item.
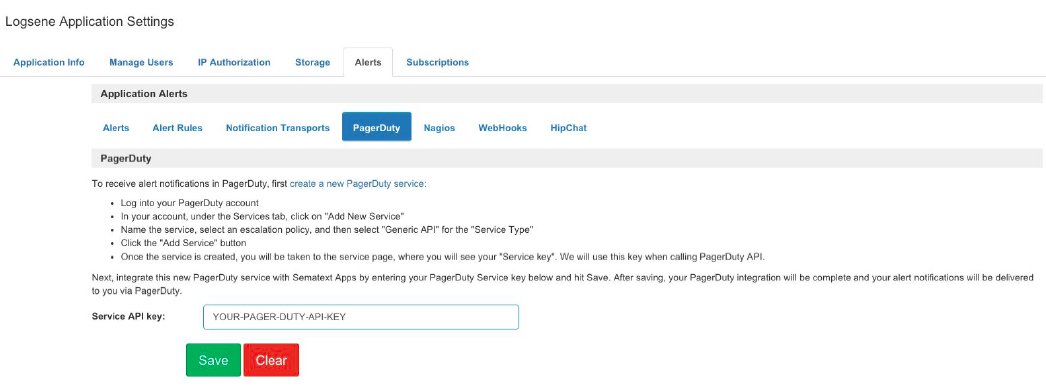
2) Navigate to Alerts / PagerDuty
3) Enter the API key from PagerDuty in the field Service API key.
4) Press Save
5) To enable PagerDuty Notifications, navigate to Alerts /Notification Transports
6) Select PagerDuty
Done. Every alert from your Logsene app will be forwarded to PagerDuty, where you can manage escalation policies and configure notifications to other services like HipChat, Slack, Zapier, Flowdock, and more.
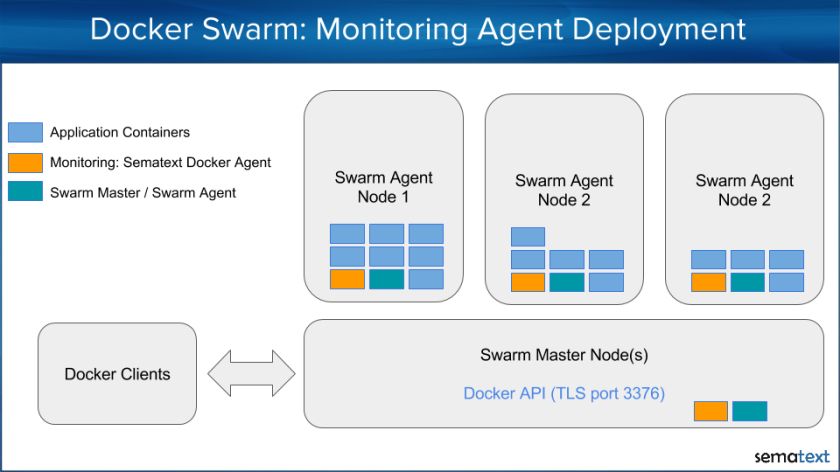
Docker Swarm is a cluster manager for Docker. When accessed via the Docker API by Docker API Clients or Docker command line tools, a Docker Swarm cluster looks just like a single Docker Host. Docker Swarm distributes containers to multiple nodes using various deployment strategies in the cluster scheduler.
Having in mind that a Swarm cluster looks like a single Docker Host from the API point of view, it should be very easy to monitor Docker Swarm with existing Docker monitoring tools! Connecting a monitoring agent to the Swarm Master API endpoint should do the job, right? The Sematext Docker Agent could simply collect all container metrics, events and all logs from the Swarm Master – should be a piece of cake. Hm, but could there a gotcha? It turns out there is more than one:
If we deploy a single monitoring agent to the master node, it would miss host metrics for all other nodes because the Docker API doesn’t provide any host metrics. We could also not see how much memory, disk space or CPU the Docker Swarm node itself consumes. Solution: deploy the monitoring agents to each node for collecting the metrics locally.
Assuming a larger cluster with a high volume of logs, events and metrics to collect, a single monitoring agent connected to the the master node would need to handle all operational data of the cluster. This would work for a small cluster but such an architecture would obviously be destined for failure on larger clusters. Guess what the solution is? It’s much better having an agent running on each node and distributing the monitoring and logging work over all nodes. If you do it right from the beginning, there is no need to change the deployment strategy later, when the cluster scales out.
Monitoring container running on each Docker node
In the following example we assume that the master and agent nodes have the UNIX socket enabled in Docker daemon settings. This can be achieved by using –engine-env ‘DOCKER_OPTS=”-H unix:///var/run/docker.sock”‘ in the docker-machine create command. Use this Github Gist to create a Docker-Swarm Cluster with with enabled UNIX sockets. Later, we will see this helps simplify the deployment of any tool that needs to connect to the local Docker daemon – including monitoring and logging containers.
Let’s see how to deploy Sematext Agent to each node in a Docker Swarm Cluster with UNIX socket enabled in Docker-Daemon as just described.
When we started to work on Swarm Monitoring our first question was “Does Docker Swarm provide a deployment strategy for running exactly one instance of a service on each node?” We checked the documentation, but no dice. We found strategies like “spread, binpack, and random” (see https://docs.docker.com/swarm/scheduler/strategy/), but none of them would guarantee exactly one instance of a service on each node. The “spread” strategy spreads the containers evenly over all hosts. The “binpack” strategy fills up one node after another with containers, while “random” spreads containers randomly to nodes. There was seemingly no strategy suitable for monitoring services running only once on each node.
So how can we distribute the monitoring container to each host using Docker Swarm instead of bash script iterating over all nodes? It turns out it’s possible to define an affinity to ensure that containers that should run on the same host are scheduled together. In our case we use “anti-affinity” in the deployment strategy, which instructs Swarm not to deploy the container with Sematext Agent to hosts that already have that container running. In other words, it tells Docker Swarm to run no more than one Sematext Agent container on each Docker host. To do that we define a docker-compose.yml file with the “anti-affinity” specified in the container environment section:
Finally, we use the docker-compose command to scale out the Sematext Docker Agent and deploy it to all Swarm cluster nodes. To do that we run:
eval $(docker-machine env swarm-master --swarm)
docker-compose up -d # scale is == num nodesdocker-compose scale sematext-agent=$(docker-machine ls | grep swarm | grep Running | wc -l)
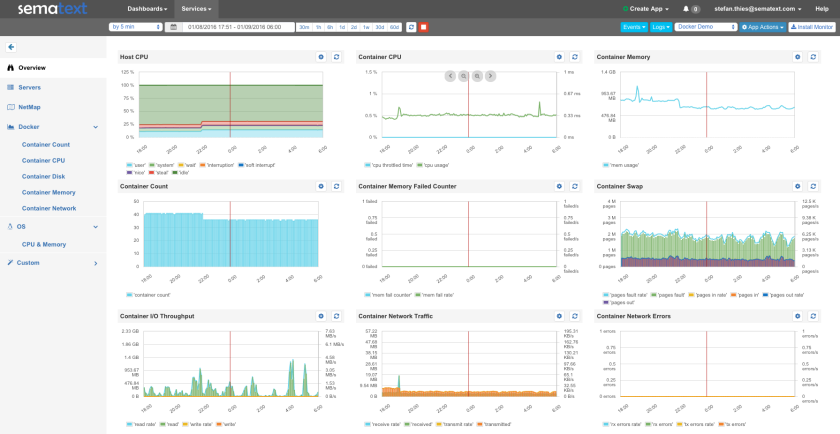
After running the above commands, Sematext Docker Agent will be running on each node and within a minute you will receive Host and Container Metrics for all containers, all their Logs and all Docker events from all nodes in your Docker Swarm cluster. Complete visibility!
Aggregated Metrics from all Docker Swarm nodes
Please note there are many ways to create a Swarm cluster and you might have another setup, such as:
TLS secured Docker daemon and no possibility to activate the unix socket: In this situation you have to deal with the existing Docker daemon setup, which typically uses TLS and authentication via certificates (for example, if you followed Docker’s instructions to create Swarm clusters using Docker-Machine). When the Docker socket is secured with TLS, each client – including Sematext Docker Agent – needs the certificates for authentication. This involves a bunch of parameters such as “DOCKER_HOST”, “DOCKER_CERT_PATH”, “DOCKER_TLS_VERIFY” and mounting of the certificate into the container. In addition we should know to which Docker daemon the agent should be connected (typically port 2375 for TCP, 2376 for TLS on each node and port 3376 on Swarm Master nodes for the Swarm API). We made this scenario easy with a deployment script for the Sematext Agent with TLS options provided by Docker-Machine.
You use CoreOS to run Docker Swarm: In this case you could use fleet and systemd to distribute the agent to each node (simply install Sematext Agent with these instructions)
The deployment methods above should work for other monitoring tools or logging containers as well because most of such tools need to run on each node to collect the metrics locally.
If you have questions or special needs for monitoring more complex setups feel free to contact us. The Sematext Docker Agent is a turnkey-solution for Docker Logs, Metrics and Events – sign up here and give it a try (30-days free trial, no credit card needed).
New Year, New Feature in SPM! We are happy to announce the immediate availability of NetMaps in SPM! Check out why they are useful or watch the short video below.
Ever wondered how different components of distributed apps are actually connected over the network? When it comes to troubleshooting of distributed application stacks like Apache Kafka, Spark, Hadoop, Cassandra, Solr, or Elasticsearch — not to mention Microservice architectures or Docker Containers — information about the deployed infrastructure becomes critical. That architecture diagram you drew N months ago? It’s probably out of date. Apps we run today are often very dynamic. Instances, nodes, and containers come and go, whether because of elastic up/down scaling or other reasons.
Discovering This Dynamic Infrastructure
Watching the actual network traffic on all nodes could quickly answer many questions for DevOps engineers doing troubleshooting or planning setup changes. For example:
Which nodes are online and active?
How nodes are connected to other nodes?
What are the dependencies between network services?
What is the consumed bandwidth between nodes?
Which applications run on a specific network node?
Visualize Network Connections
Designed to visualize network connections and answer the above questions instantly, NetMaps also include:
Automatic Discovery of network nodes and applications
Filtering by application and host name
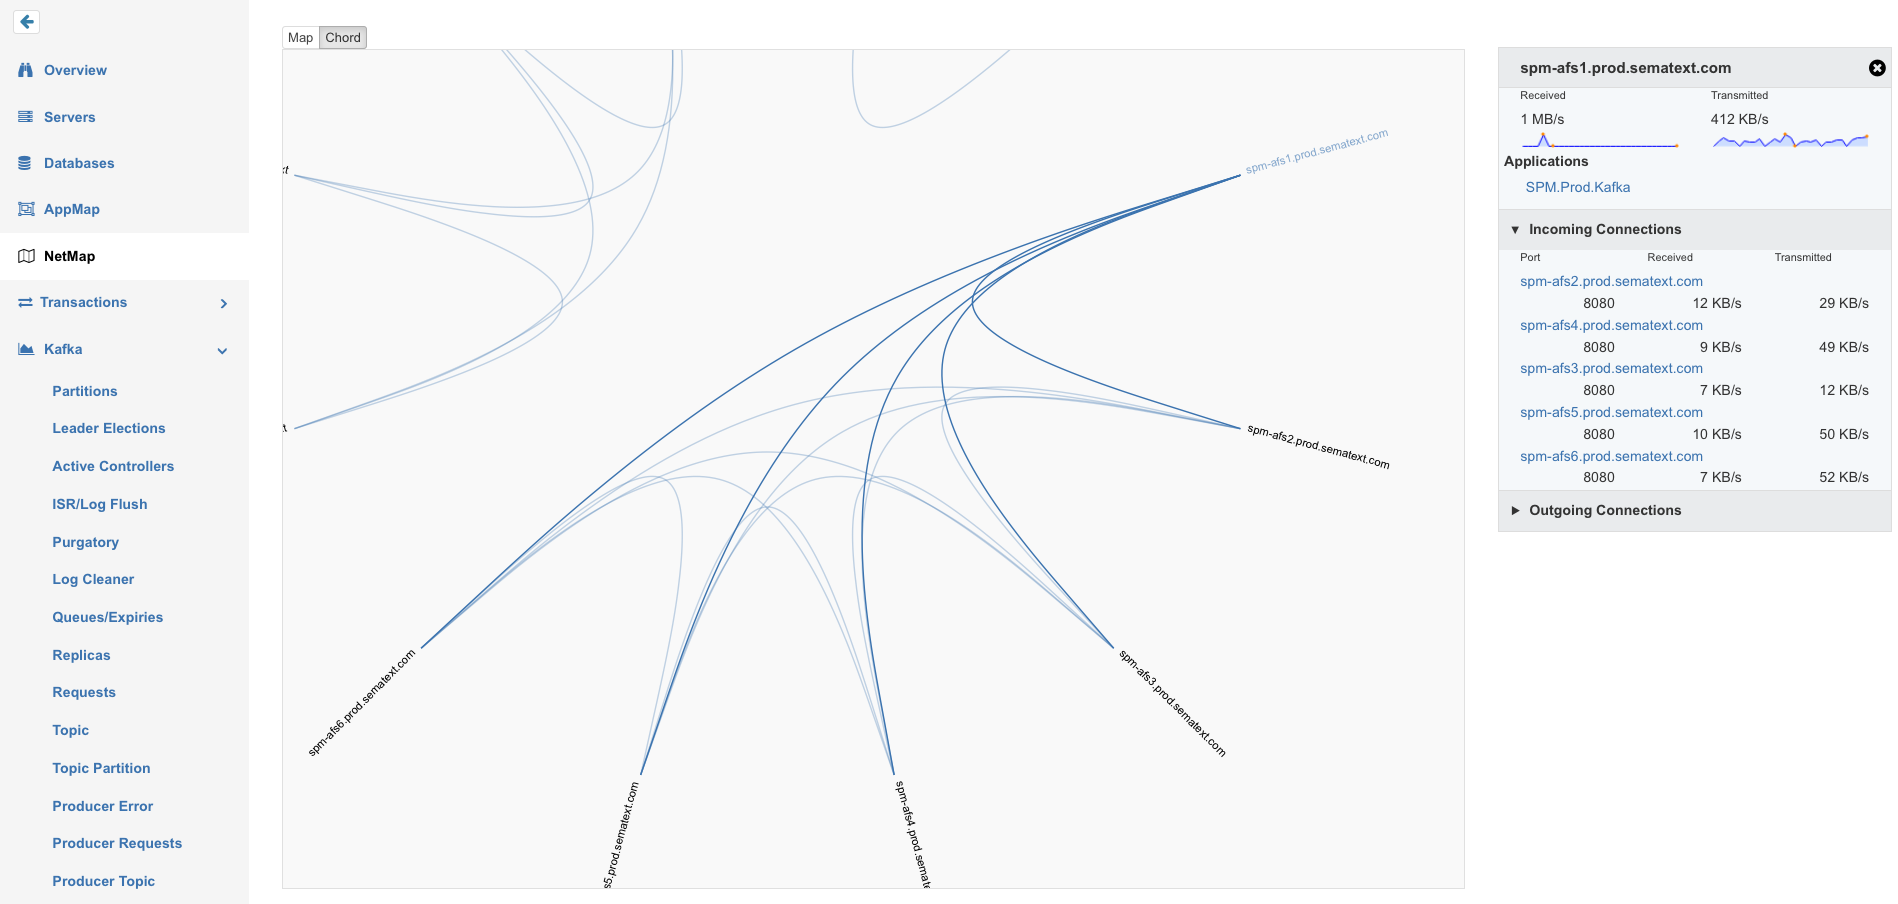
Automatic Visualizations as Network Map and Chord Diagrams
Interactive Explorer for following network links for each application node
Bandwidth consumption for all incoming and outgoing network connections
Navigation from the NetMap to all nodes and related performance metrics of the monitored App
The best practice is to activate network monitoring on all application server nodes, which communicate with databases, message brokers, search engines etc. in that way it is easy to see how client applications communicate with backend servers.
NetMap “Map” View
NetMap “Chord” View
It is very easy to activate Network Monitoring in SPM Client, a collector for Host and Application Metrics. Intelligent network filters ensure that the resource usage for the network monitoring stays low while capturing all relevant packets to explore your infrastructure using the “NetMap” Tab in SPM. If you find network maps interesting, you might also be interested in SPM’s AppMap feature for JVM applications to discover relationships between monitored JVM applications such as Elasticsearch, Solr, Cassandra, Spark or Kafka, …
We hope you like this new addition to SPM. Got ideas how we could make it more useful for you? Let us know via comments, email or @sematext.
Not using SPM yet? Check out the free 30-day SPM trial by registering here. There’s no commitment and no credit card required.
This recipe shows how to send CloudTrail logs (which are .gz logs that AWS puts in a certain S3 bucket) to a Logsene application, but should apply to any kinds of logs that you put into S3. We’ll use AWS Lambda for this, but you don’t have to write the code. We’ve got that covered.
The main steps are:
0. Have some logs in an AWS S3 bucket 🙂
1. Create a new AWS Lambda function
2. Paste the code from this repository and fill in your Logsene Application Token
3. Point the function to your S3 bucket and give it permissions
4. Decide on the maximum memory to allocate for the function and the timeout for its execution
5. Explore your logs in Logsene 🙂
Another year is behind us, and it’s been another good year for us at Sematext. Here are the highlights in the chronological order. If you prefer looking non-chronological overview, look further below.
January
We started the year by doing a ton of publishing on the blog – about Solr-Redis, about SPM and Slack, about Solr vs. Elasticsearch – always a popular topic, Spark, Kafka, Cassandra, Solr, etc. Logsene being ELK as a Service means we made sure users have the freedom and flexibility to create custom Elasticsearch Index Templates in Logsene.
February
We added Account Sharing to all our products, thus making it easier to share SPM, Logsene, and Site Search Analytics apps by teams. We made a big contribution to Kafka 0.8.2 by reworking pretty much all Kafka metrics and making them much more useful and consumable by Kafka monitoring agents. We also added support for HAProxy monitoring to SPM.
March
We announced Node.js / io.js monitoring. This was a release of our first Node.js-based monitoring monitoring agent – spm-agent-nodejs, and our first open-source agent. The development of this agent resulted in creation of spm-agent – an extensible framework for Node.js-based monitoring agents. HBase is one of those systems with tons of metrics and with metrics that change a lot from release to release, so we updated our HBase monitoring support for HBase 0.98.
April
The SPM REST API was announced in April, and a couple of weeks later thespm-metrics-js npm module for sending custom metrics from Node.js apps to SPM was released on Github.
May
A number of us from several different countries gathered in Krakow in May. The excuse was to give a talk about Tuning Elasticsearch Indexing Pipeline for Logs at GeeCon and give away our eBook – Log Management & Analytics – A Quick Guide to Logging Basics while sponsoring GeeCon, but in reality it was really more about Żubrówka and Vișinată, it turned out. Sematext grew a little in May with 3 engineers from 3 countries joining us in a span of a couple of weeks. We were only dozen people before that, so this was decent growth for us.
Logsene users got Live Tail in November, while SPM users welcomed the new Top Database Operations report. Live Tail comes in very handy when you want to semi-passively watch out for errors (or other types of logs) without having to constantly search for them. While most SPM users have SPM monitoring agents on their various backend components, Top Database Operations gives them the ability to gain more insight in performance between the front-end/web applications and backend servers like Solr, Elasticsearch, or other databases by putting the monitoring agents on applications that act as clients for those backend services. We worked with O’Reilly and produced a 3-hour Working with Elasticsearch Training Video.
Lucene/Solr Revolution, Austin, TX – Large Scale Log Analytics with Solr
Velocity Conference, NYC, NY – Log Analysis with Elasticsearch
Berlin Buzzwords, Berlin, Germany – Side by Side with Elasticsearch and Solr: Performance and Scalability
GeeCon, Krakow, Poland – Tuning Elasticsearch Indexing Pipeline for Logs
DevOps Days, Warsaw, Poland – Running High Performance and Fault Tolerant Elasticsearch Clusters on Docker
DevOps Expo, NYC, NY – Process Metrics, Logs, and Traces at Scale
Trends:
All numbers are up – our SPM and Logsene signups are up, product revenue is up a few hundred percent from last year, we’ve nearly doubled our blogging volume, our site traffic is up,we’ve made several UI-level facelifts for both apps.sematext.com and www.sematext.com, our team has grown, we’ve increased the number of our Solr and Elasticsearch Production Support customers, and we’ve added Solr and Elasticsearch Training to the list of our professional services.
If you’ve found your way to this post then chances are high that you’re having second thoughts about diving into a New Relic APM subscription. You’re not alone. In fact, we hear from many fellow DevOps engineers looking at performance monitoring solutions who check out New Relic APM — or who are already using it — because it is so widely known, but wonder if there is a better tool, specifically with traits like:
Better pricing
On Premises deployment (not just SaaS)
Integration of metrics, logs and events in a single UI
So why not give SPM a try? You can check out a free 30-day trial by registering here. There’s no commitment and no credit card required. Even better — combine SPM with Logsene to make the integration of performance metrics, logs, events and anomalies more robust for those looking for a single pane of glass.
For many of us in the DevOps field, MongoDB is a critical part of our IT stack. With today’s acquisition of WiredTiger, MongoDB is further establishing itself as the NoSQL DB built to support massive data processing and storage. It would be an understatement to say that MongoDB does a lot, with many organizations using it as their backend storage framework, analytics backend, and so on.
So your MongoDB cluster really, really needs to be in tip-top shape. All the time. And if it’s not then you need to know asap — or better yet — prevent problems before they kick in and make your life difficult. That’s where SPM comes in — with MongoDB monitoring, alerting and anomaly detection. MongoDB exposes a boatload of metrics, but instead of just throwing all of them on endless charts, we’ve taken the time to cherry pick what we think are the top 50 most valuable MongoDB metrics to monitor. We have furthermore made it possible to filter the MongoDB metrics by server, as well as a database and table where possible.
The key metric groups we track are:
Database Operations
Database Memory
Database Storage
Documents
Locks
Network
Database Journal
Background Flushes
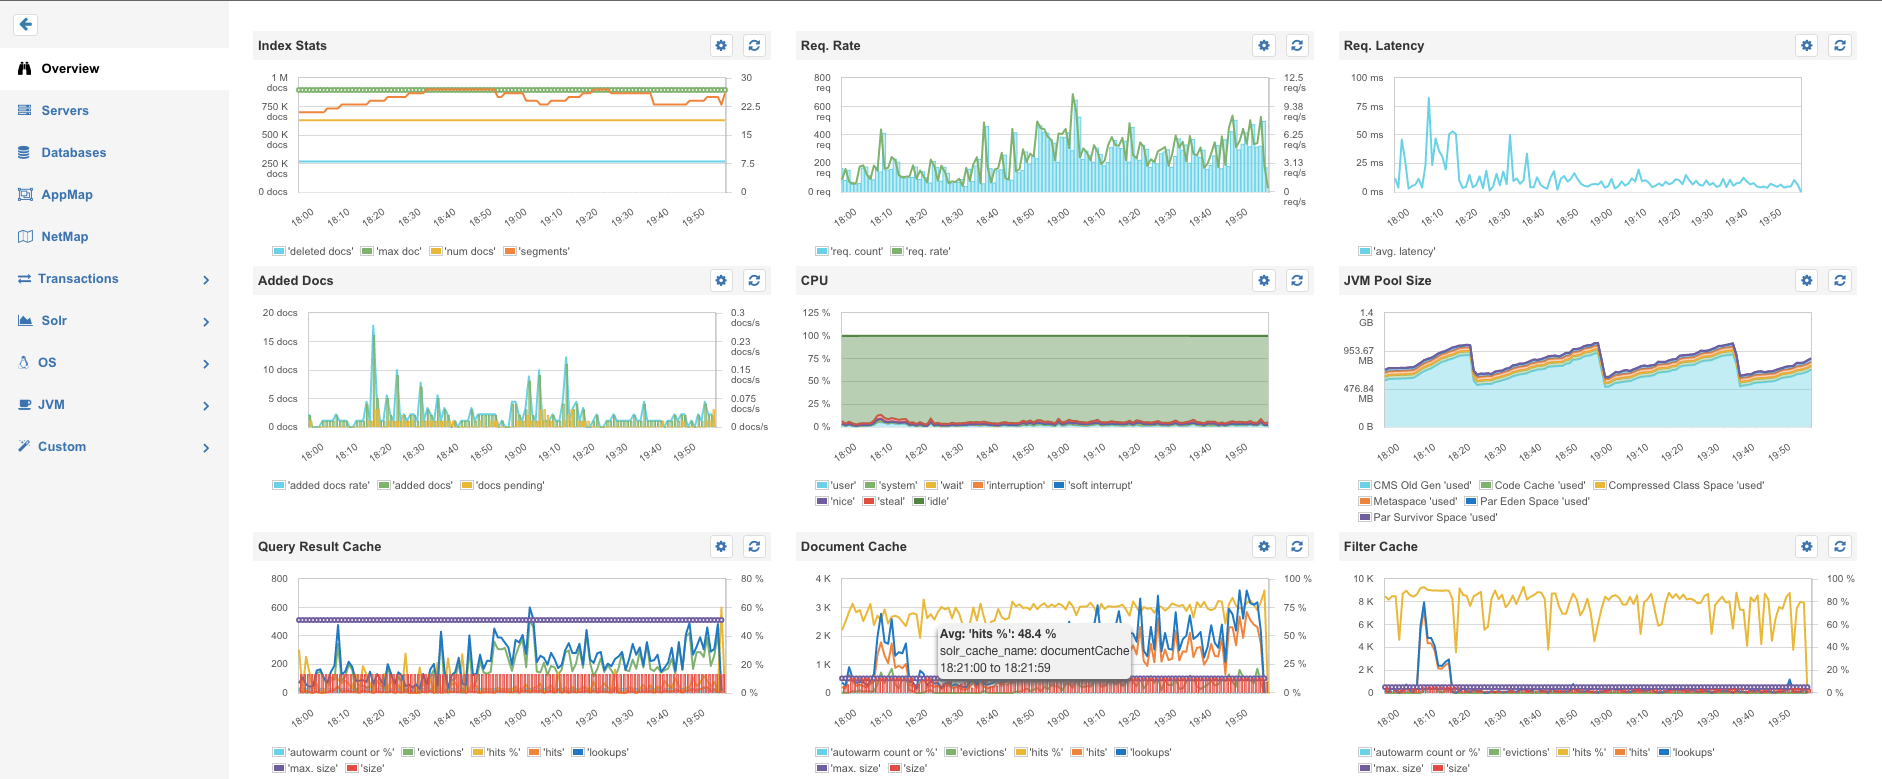
The Overview chart below provides 9 charts with MongoDB key metrics:
Row 3 adds Collection/Document Metrics, Locks, and wait times; followed by Network Metrics for MongoDB
SPM for MongoDB Overview
In case you monitor a MongoDB cluster, the Server Tab provides a quick overview for the Health of each node:
SPM Server View
The Reports on the left side of the screen below provide detailed information for each group of metrics. Let’s have a quick look at them.
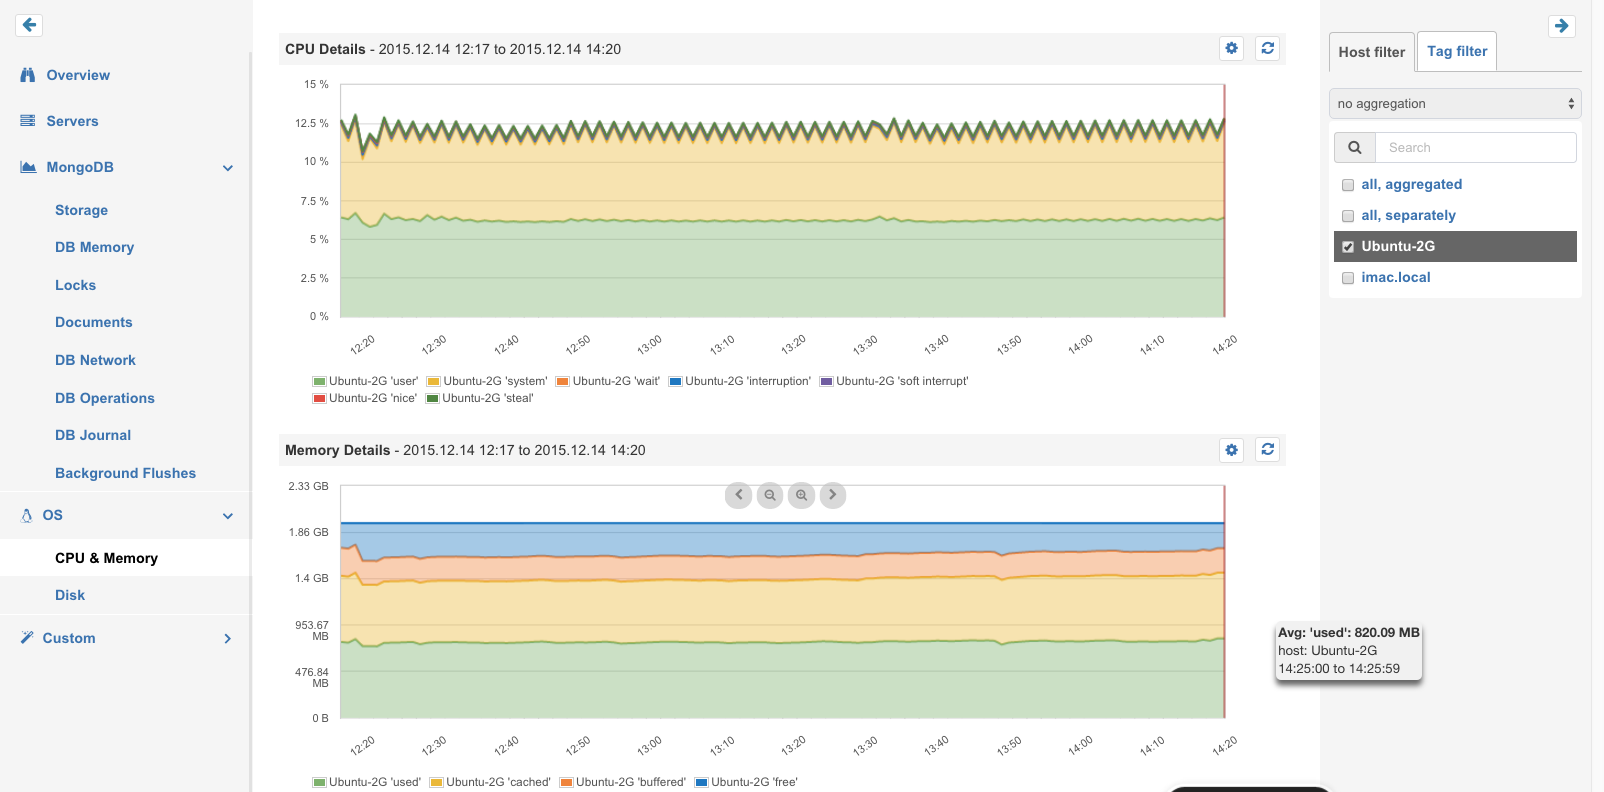
OS Metrics: CPU Metrics, Memory Usage, Disk Space and I/O
Below is an example of some of the key MongoDB Metrics found in SPM:
Database Operations: Counters for Queries, Insert, Update, Delete and other commands for the main database plus replica operations
Database Memory: Resident-, Virtual-, Mapped-, and Journal Memory
Database Storage: Size of Data Files, Namespace Files, DB Files etc., plus Size of Objects, Number of Collections and Objects
MongoDB Storage & Collections
The screenshot below shows:
Documents: Counters for Documents inserted, updated or returned by queries
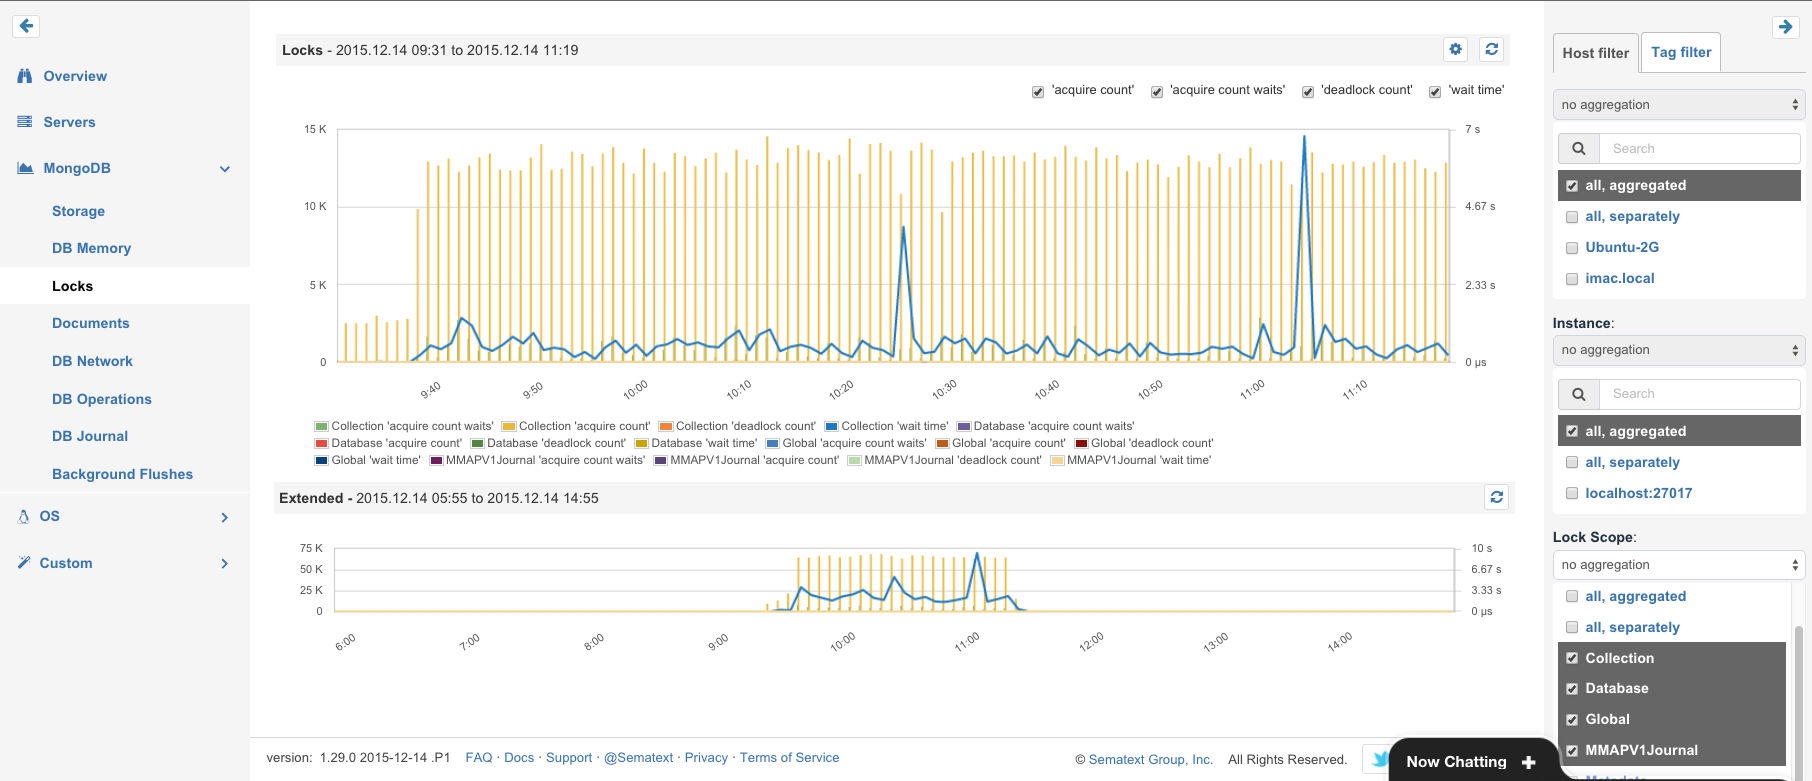
Locks: Lock counters and lock acquisition wait times for Global, Database, Collection and Journal level. Since MongoDB 3.x Locks are not always global. SPM shows a breakdown for all lock types. These metrics are good candidates for alerting, when anomalies are detected. Simply add an alert from the menu in the top-left corner in each chart.
Metrics for all MongoDB Locks
Other key MongoDB metrics that SPM displays are:
Network: Number of client connections, Received and transmitted data, Request rate
Database Journal: Commits, Early Commits, Commit times and lock times
MongoDB Journal Metrics
In case you like to see MongoDB metrics together with the Top Node.js Metrics, you might like the idea of putting MongoDB and Node.js metrics from SPM for Node.js in a custom dashboard:
SPM Custom Dashboard with MongoDB Locks and Node.js Event Loop Latency
We hope you like this new addition to SPM. Got ideas how we could make it more useful for you? Let us know via comments, email or @sematext.
Not using SPM yet? Check out the free 30-day trial by registering here. There’s no commitment and no credit card required. Even better — combine SPM with Logsene to make the integration of performance metrics, logs, events and anomalies more robust for those looking for a single pane of glass.
Sematext has just been recognized by Docker as an Ecosystem Technology Partner (ETP) for logging. This designation indicates that Logsene has contributed to the logging driver and is available to users and organizations that seek solutions to capture logging data for monitoring their Dockerized distributed applications.
Log Management for Docker
“Sematext brings years of logging and monitoring expertise to the Docker community,” said Nick Stinemates, Head of Business Development and Technical Alliances at Docker. “As an active participant in the Docker community, Sematext has provided logging solutions like Logsene and SPM for Docker, and contributed valuable user education and resources through informative webinars and blogs.”
Logsene & Docker
Logsene is a centralized logging, alerting and anomaly detection solution, available in the Cloud and On Premises. Logsene delivers critical operational and business insights from data generated by Docker containers, applications and servers, and other devices. Some DevOps engineers even think of Logsene as “ELK Stack on steroids.” Logsene also integrates seamlessly with SPM, a performance monitoring, alerting and anomaly detection tool for Docker and many other platforms used by DevOps teams.
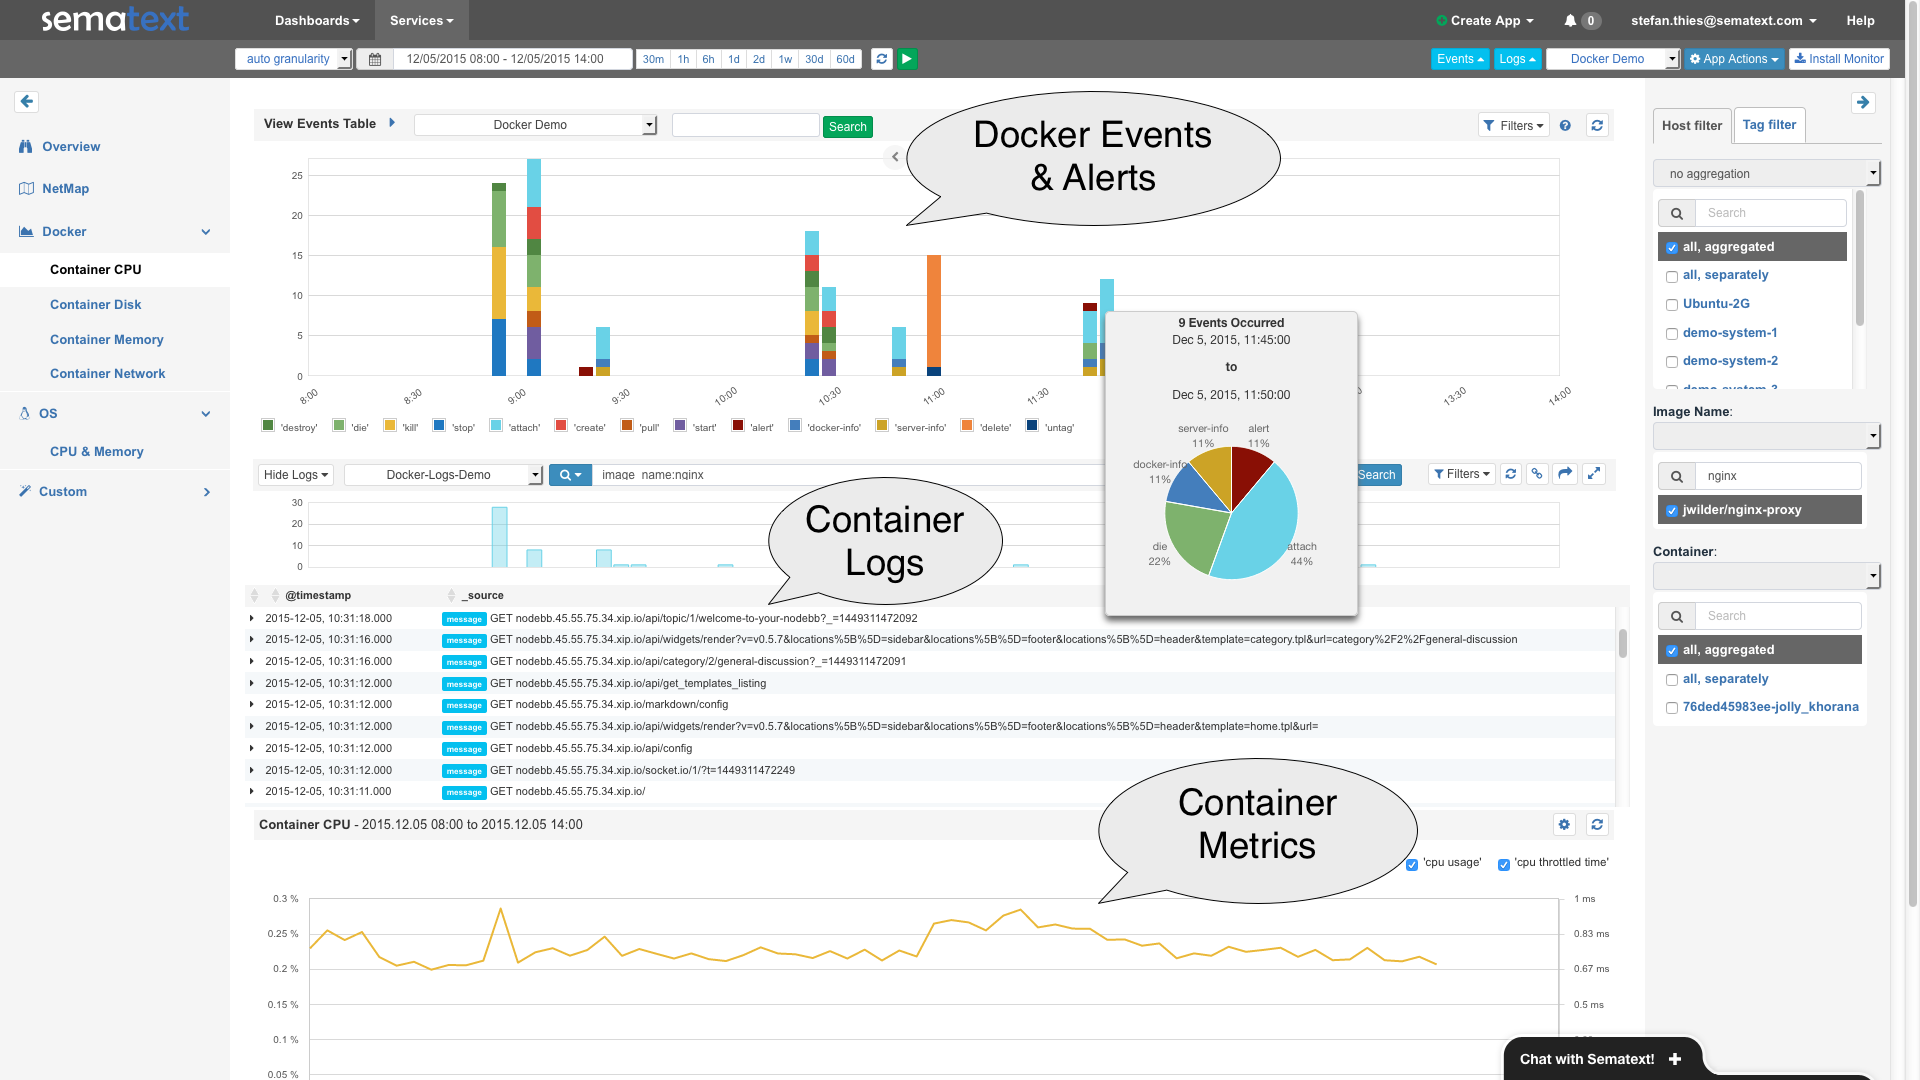
The following screenshot shows expanded views for Docker Events and Alerts (top), Container Logs (middle) and Container Metrics (bottom):
Sematext SPM, showing Docker Events, Logs and Metrics
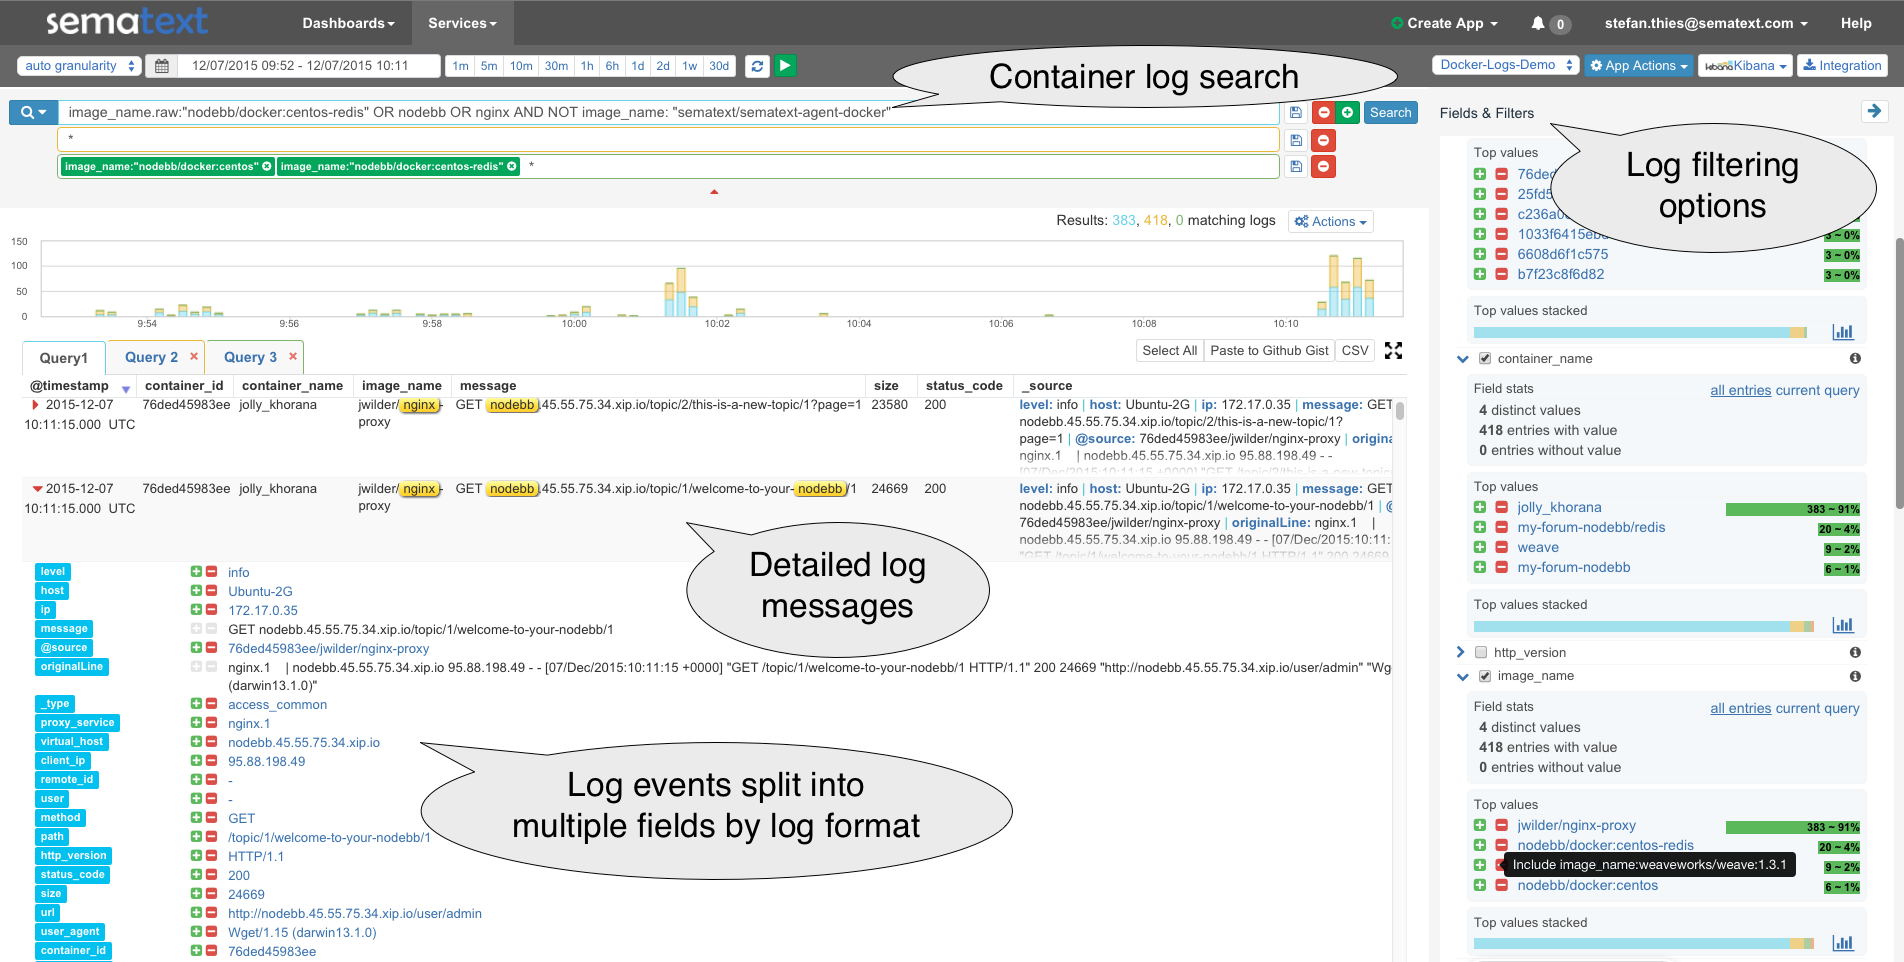
If you need more functionality to slice and dice logs then move to the Logsene UI shown below. The screenshot shows Container Log search (top) and detailed log messages tagged with container information and parsed fields (middle). Both the detail view in the middle and the Fields & Filters on the right side contain buttons to drill down into logs – e.g., to filter for the logs of a specific Docker Image or Docker Container.
Logsene User Interface – showing Docker log search, filtering options, log messages, & log events sorted by format
1-Minute Deployment in Tutum
One of the benefits of using SPM and Logsene for Docker monitoring, logging, and events is how easily they can be launched on Tutum. It’s basically one minute: click-click-done! For Docker users this means a single solution, a single container that captures not just logs or just metrics, but both container metrics and logs, plus Docker events, plus Docker host metrics and its logs.
Sematext Docker Agent on Docker Hub
Sematext Docker Agent image is available on Docker Hub, and we shared the Tutum Stackfile for Sematext Docker Agent on Stackfiles.io – but the easiest way is to go via Sematext UI, which generates the stackfiles for you, including Application Tokens, as demonstrated in the video.
Sematext Docker Agent Stackfile in Tutum Cloud, ready to deploy
Docker’s ETP Program
Docker’s ETP program recognizes ecosystem partners like Sematext that have demonstrated integration with the Docker platform. As part of the program, Docker will highlight a capability area within the application lifecycle, validate integration and communicate the availability of the partner’s solution to the community and the market. The goal of the program is to ensure that logging tools like Logsene have been working with Docker to ensure the highest degree of availability and performance of distributed applications. Like the other partners in this program, Sematext has proven integration with the Docker platform and has demonstrated that Logsene is able to record logging data for dockerized applications.
“Sematext has been on the forefront of Docker monitoring, along with Docker event collection, charting and correlation with metrics,” said Otis Gospodnetić, Sematext’s Founder and CEO. “So it was a natural next step to incorporate Docker logging via our Logsene log management solution. The combination of SPM and Logsene not only allows for correlation of Docker metrics and logs, but also metrics and logs of applications running inside containers, along with anomaly detection and alerting. All this makes it much easier to troubleshoot performance and other issues much faster and with a lot less hassle than using more traditional or siloed solutions.”
Not using Logsene yet? Check out the free 30-day trial by registering here (ping us if you’re a startup, a non-profit, or educational institution – we’ve got special pricing for you!). There’s no commitment and no credit card required.
Grafana is an open-source alternative to Kibana. Grafana is best known as a visualization / dashboarding tool focused on graphing metrics from various data sources, such as InfluxDB. Even though Grafana started its life as a Kibana fork, it didn’t originally support using Elasticsearch as a Data Source. Starting with version 2.5 Grafana added support for Elasticsearch as a Data Source — good news that we at Sematext got very excited about. Elasticsearch is typically not used to store pure metrics. It is used more often for storing time series data like logs and other types of events (think IoT). Grafana 2.5 was limited to the display of numerical values, but as of version 2.6 Grafana supports tabular display of textual data as well. Of course, most logs include numerical data, too, which means we can now use Grafana to render both logs and metrics from those logs stored in Logsene – perfect!
The Logsene API is compatible with Elasticsearch, which means you can use Grafana (from v2.6 and up) with your data in Logsene simply by using Grafana’s Elasticsearch Data Source and pointing it to Logsene. You only need to do two things:
Create a Data Source
Add a Table Panel to a Dashboard
Watch this short video to see Grafana and Logsene together in action:
We hope you like this new, alternative way to derive insight from your data in Logsene. Got ideas how we could make it more useful for you? Let us know via comments, email or @sematext.
Not using Logsene yet? Check out the free 30-day trial by registering here (ping us if you’re a startup, a non-profit, or educational institution – we’ve got special pricing for you!). There’s no commitment and no credit card required. Even better — combine Logsene with SPM to make the integration of performance metrics, logs, events and anomalies more robust for those looking for a single pane of glass.
The official Solr Image on Docker Hub was released just a few weeks ago and already has 16K pulls. Why not more? Well, there are more than 200 different Solr images on Docker Hub — probably because no official Image was available!
A rapidly growing number of organizations are using Solr and Docker in production and they are probably happy about the new official Image. Needless to say, monitoring Solr is essential in production. Docker is disruptive in many ways, and there are many things that are slightly different and worth mentioning. These include:
Changed deployment for Solr and its monitoring tools using Dockerfile, Docker Compose or various Orchestration Tools
Logging has changed: containers log to the console and logs need to be retrieved from Docker-Daemon instead getting them from the Solr log file. Check out our post on the subject: Innovative Docker Log Management
Official Images may not provide options for monitoring (such as JMX). However, the official Image for Solr provides an option to pass parameters to the Java Runtime Environment. We we will use this option for Solr monitoring in this post.
Next, I’m going to demonstrate the setup of a Solr node with SPM. The final setup will provide the full Solr & Docker Monitoring and Logging package:
Detailed Application Metrics for Solr, deployed on Docker
Detailed Container Metrics and Docker Events
Centralized Logs for all Containers by SPM for Docker
Let’s first decide on one of the following options to monitor Solr on Docker:
Build your own Solr container with a mix of open-source monitoring/alerting tools. I’m not going to go into detail about this option today because dealing with a mix of open-source DevOps tools and a non-official Solr image doesn’t sound clean; plus, we can do better.
Use a standalone monitoring agent, which queries metrics from the Solr container. This requires a setup for JMX and Docker networking configurations for the monitor and Solr. The metrics gathered by remote agents are limited and, in the Docker context, running an external monitoring process plus Solr processes consumes more resources. And the next option …
Inject an SPM in-process monitoring agent into Solr. This option has the lowest resource usage and has support for advanced monitoring functions like Transaction Tracing and AppMap.
We’ll go with Option #3 in this blog post, as it provides the best insights into Solr. Sematext provides the SPM Client (this includes the monitoring agent and metrics sender) pre-installed in a Docker Image. We refer to this dockerized SPM Client as “SPM Client Image/Container” in the following instructions. The main trick here is to mount a volume from SPM Client Container into Solr Containers in order to load the monitoring library that’s part of the SPM Client Container.
Let’s have a look at the desired setup and how to get there:
The SPM Token is a unique identifier for monitored applications – if you haven’t created an SPM App for Solr, then create one here first. Should take about 37 seconds.
# Set the SPM Token as Environment Variable
export SPM_TOKEN=4feb144c-4da8-4081-83b5-b0b8e06e743a
# Set the JVM Name, which appears in SPM JVM Metrics Report
# In addition we will use it as Hostname for the Solr container
export JVM_NAME=SOLR1
2) Create SPM Client and Solr service in docker-compose.yml Note: you may copy this file to make changes for additional Solr options; all parameters are set as Environment Variables.
In the Environment variable “SOLR_OPTS” in the Docker-Compose file above we see options for the SPM in-process monitor to inject a .jar file from the SPM Client Volume. The SOLR_OPTS string is taken from SPM install instructions. It includes the SPM Token (the ${SPM_TOKEN} part) and provides the JVM name so we can distinguish between multiple Solr instances if we run N of them on the same host (the ::${JVM_NAME} part).
3) Run Solr and SPM Monitor
We are now ready to fire up Solr:
docker-compose up -d
All done! After about a minute, metrics for the Docker Host, JVMs and Solr nodes will appear in SPM. Because we chose a consistent naming for Container hostname, and JVM name we can immediately see, in every chart, the relevant filters named “SOLR1”. This is much better than some random Container IDs.
Solr Metrics Overview
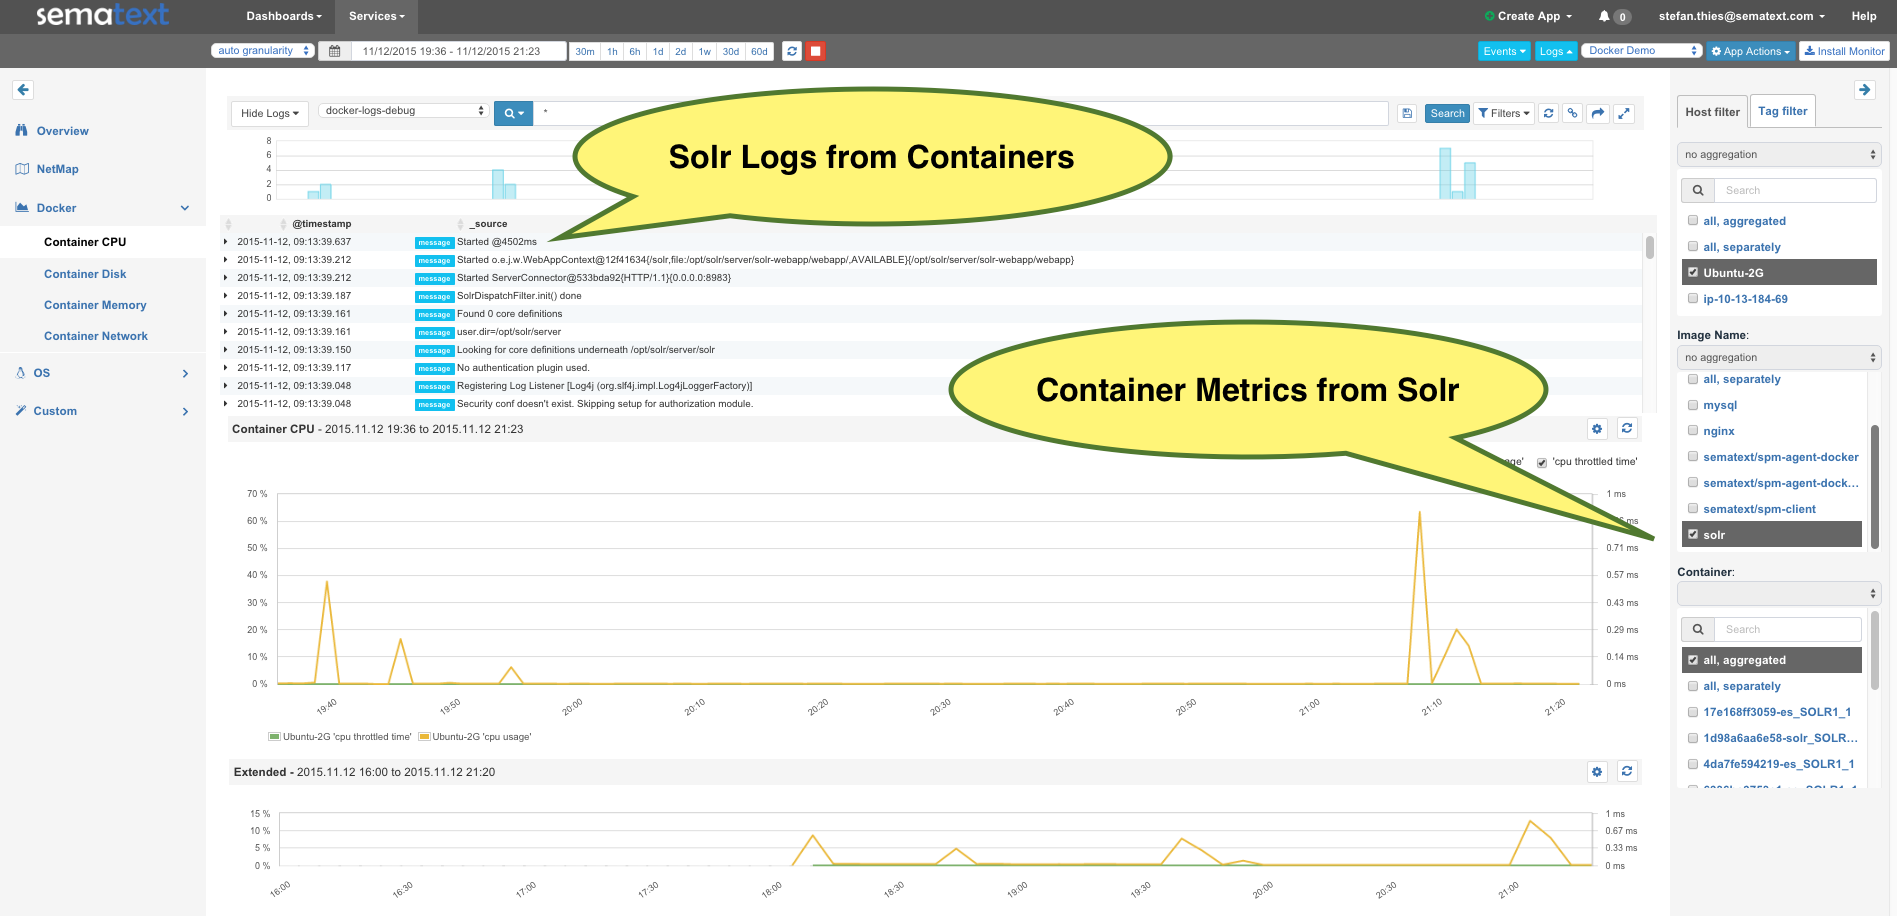
But what about my Solr Logs and the Container Metrics?
Simply run SPM for Docker – it collect logs as well as container and host metrics. It can also parse Solr logs and store them in Logsene (see Logsene 1-Click ELK Stack), which is awesome because it means you can have both Solr/OS/JVM metrics AND Solr logs all in one place! Or do you maybe like to ssh to your servers and grep log files?
docker run -d -name sematext-agent -e SPM_TOKEN=SPM_DOCKER_APP_TOKEN -e LOGSENE_TOKEN=LOGSENE_APP_TOKEN sematext/sematext-agent-docker
After a few minutes, you will get Host and Container Metrics together with Events and Logs in SPM, as shown here:
Please note that logs from the containers are automatically shipped and parsed! No setup for log shippers? That is correct — there is NO complicated setup of syslog, Logstash, Docker log drivers, etc. All this work is done by SPM for Docker. For example, each log line has a “node_name” field for the Solr node. It takes the timestamp, severity, class, thread and source from the Solr log and each log is automatically tagged with the container ID and image name. Moving from SPM Metrics to detailed Solr Logs including Exceptions and parsed Stack Traces is just another mouse click away! Look:
Multi-Line Exception, captured and parsed from Solr container
The filters next to field stats on the right side of the screen make it easy to identify containers with the most logs by choosing “container_name”. That’s just a little detail in the Logsene UI – feel free to explore it by creating Alerts or Kibana 4 Dashboards for your container logs.
Like what you saw here? To monitor Docker and Solr with SPM just get a free account here! And drop us an email or hit us on Twitter with suggestions, questions or comments. Solr and Docker are topics we enjoy chatting about with the community!