Coming to you from the recent DevOps Days event in Warsaw and delivered by Sematext engineer Rafal Kuć, “Running High Performance and Fault Tolerant Elasticsearch Clusters on Docker” is chock full of practical information that will no doubt answer many of the questions you might have about this process.
For many of us in the DevOps field, MongoDB is a critical part of our IT stack. With today’s acquisition of WiredTiger, MongoDB is further establishing itself as the NoSQL DB built to support massive data processing and storage. It would be an understatement to say that MongoDB does a lot, with many organizations using it as their backend storage framework, analytics backend, and so on.
So your MongoDB cluster really, really needs to be in tip-top shape. All the time. And if it’s not then you need to know asap — or better yet — prevent problems before they kick in and make your life difficult. That’s where SPM comes in — with MongoDB monitoring, alerting and anomaly detection. MongoDB exposes a boatload of metrics, but instead of just throwing all of them on endless charts, we’ve taken the time to cherry pick what we think are the top 50 most valuable MongoDB metrics to monitor. We have furthermore made it possible to filter the MongoDB metrics by server, as well as a database and table where possible.
The key metric groups we track are:
Database Operations
Database Memory
Database Storage
Documents
Locks
Network
Database Journal
Background Flushes
The Overview chart below provides 9 charts with MongoDB key metrics:
Row 3 adds Collection/Document Metrics, Locks, and wait times; followed by Network Metrics for MongoDB
SPM for MongoDB Overview
In case you monitor a MongoDB cluster, the Server Tab provides a quick overview for the Health of each node:
SPM Server View
The Reports on the left side of the screen below provide detailed information for each group of metrics. Let’s have a quick look at them.
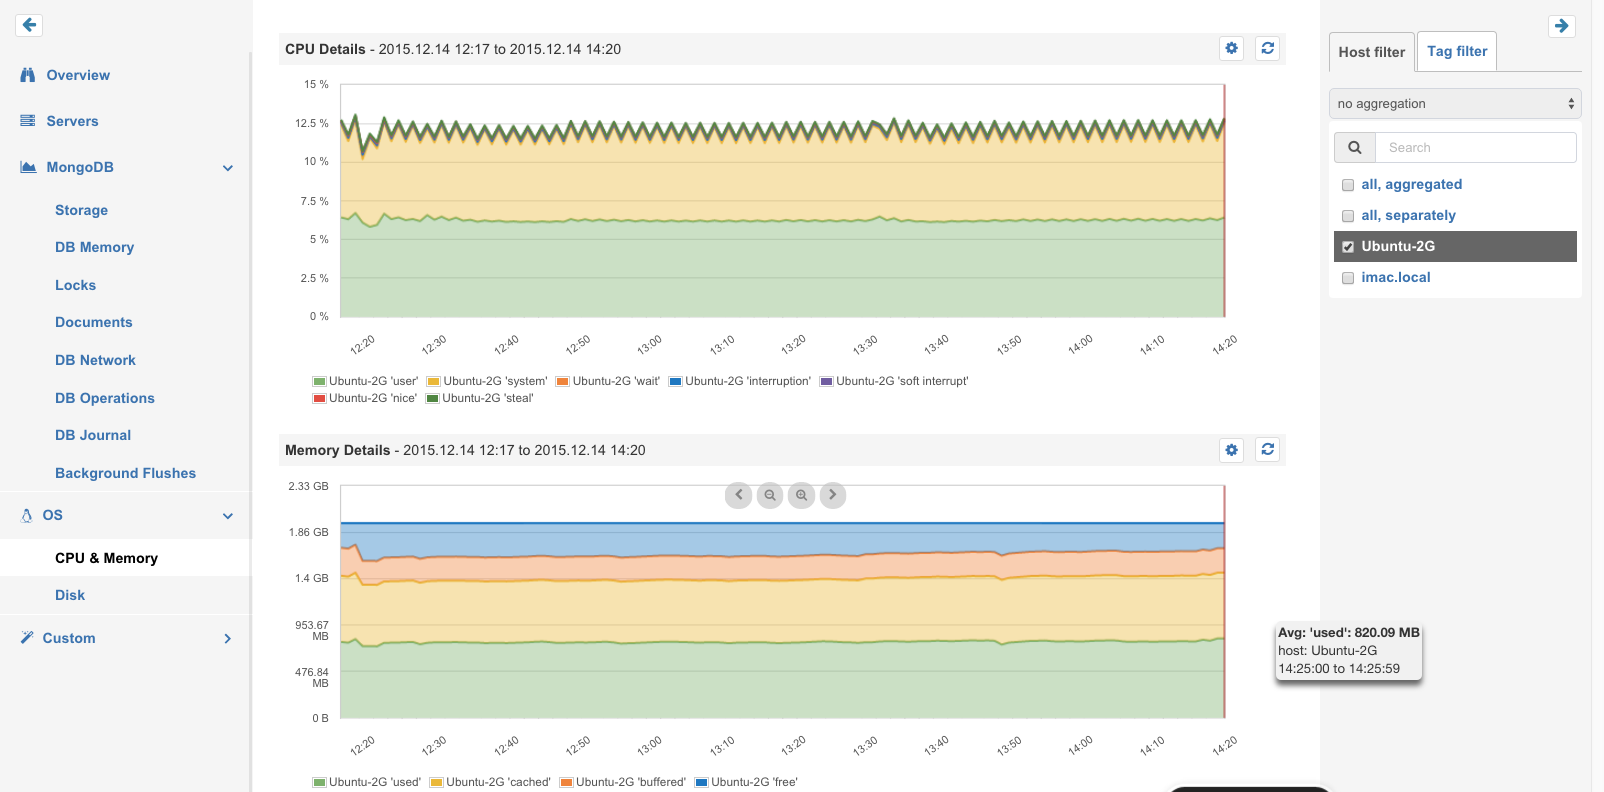
OS Metrics: CPU Metrics, Memory Usage, Disk Space and I/O
Below is an example of some of the key MongoDB Metrics found in SPM:
Database Operations: Counters for Queries, Insert, Update, Delete and other commands for the main database plus replica operations
Database Memory: Resident-, Virtual-, Mapped-, and Journal Memory
Database Storage: Size of Data Files, Namespace Files, DB Files etc., plus Size of Objects, Number of Collections and Objects
MongoDB Storage & Collections
The screenshot below shows:
Documents: Counters for Documents inserted, updated or returned by queries
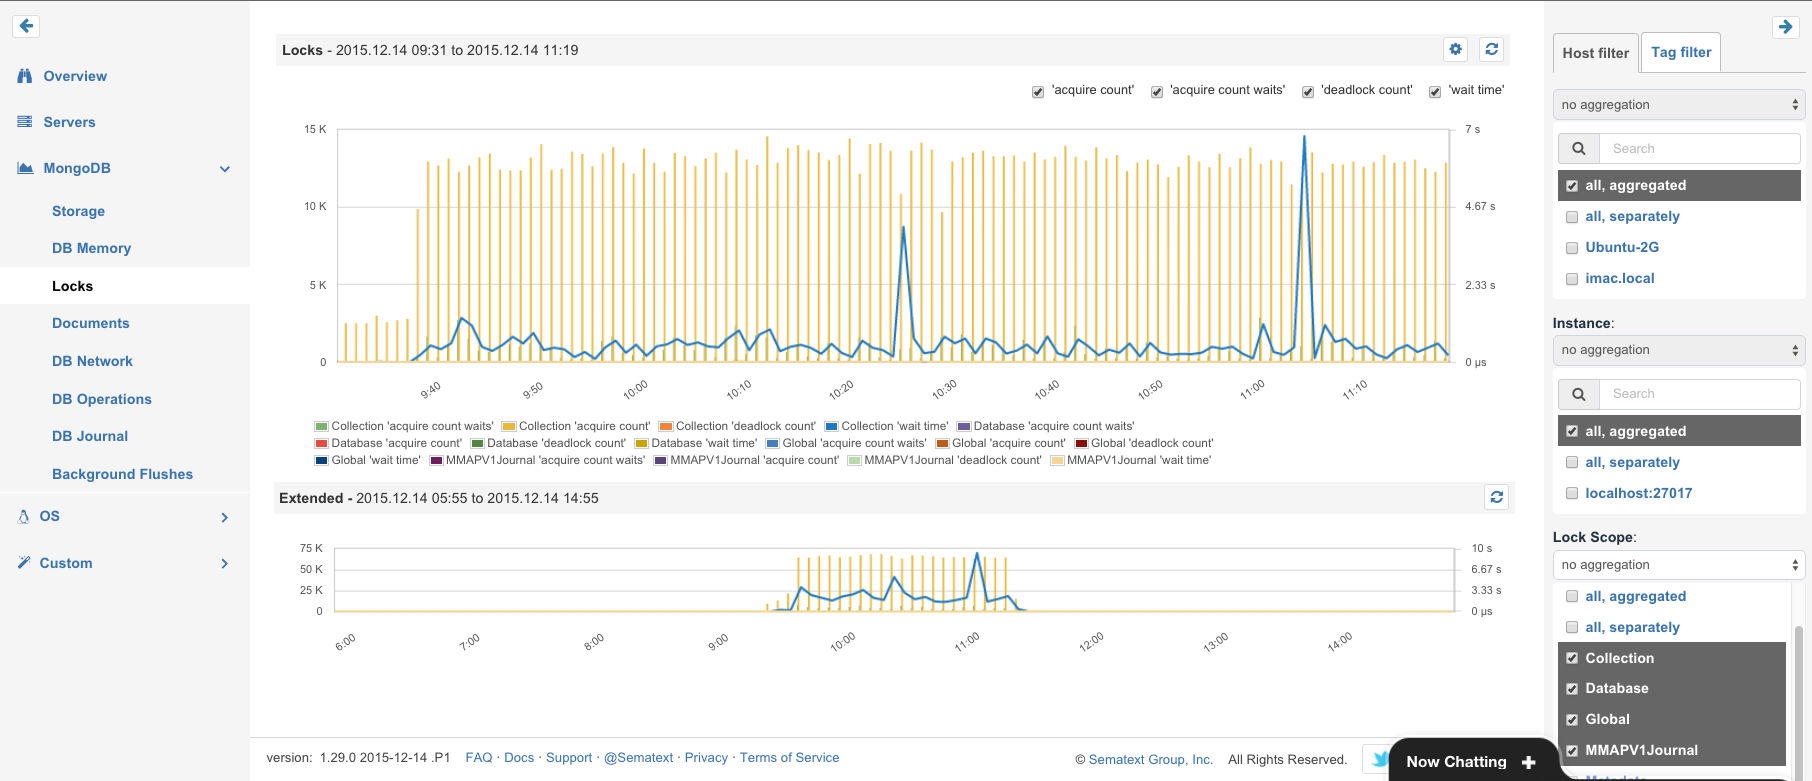
Locks: Lock counters and lock acquisition wait times for Global, Database, Collection and Journal level. Since MongoDB 3.x Locks are not always global. SPM shows a breakdown for all lock types. These metrics are good candidates for alerting, when anomalies are detected. Simply add an alert from the menu in the top-left corner in each chart.
Metrics for all MongoDB Locks
Other key MongoDB metrics that SPM displays are:
Network: Number of client connections, Received and transmitted data, Request rate
Database Journal: Commits, Early Commits, Commit times and lock times
MongoDB Journal Metrics
In case you like to see MongoDB metrics together with the Top Node.js Metrics, you might like the idea of putting MongoDB and Node.js metrics from SPM for Node.js in a custom dashboard:
SPM Custom Dashboard with MongoDB Locks and Node.js Event Loop Latency
We hope you like this new addition to SPM. Got ideas how we could make it more useful for you? Let us know via comments, email or @sematext.
Not using SPM yet? Check out the free 30-day trial by registering here. There’s no commitment and no credit card required. Even better — combine SPM with Logsene to make the integration of performance metrics, logs, events and anomalies more robust for those looking for a single pane of glass.
Sematext has combined the power of SPM and Logsene in a single pane of glass – a unified view into all the key bits of operational intelligence every DevOps engineer needs: server and application performance metrics, logs, events, anomalies, alerts, ChatOps integrations, etc. In other words, the whole is greater than the sum of its parts.
Metrics + Logs Correlation using SPM and Logsene Together in One UI
This video demonstrates how the SPM + Logsene combination solves the problems of having too much data to manage yourself and the disconnect when metrics and logs are siloed. We address two of the most common problems — and their solutions — below the video.
Problem 1 – Big Data, Big Burden: Servers, Containers, Apps, and Devices spew out more and more data: more metrics, more logs, more events. Collecting and storing all this data is a challenge and is often not cheap both in terms of time invested in building large-scale data collection, storage, and retrieval systems, maintaining them, as well as providing the adequate infrastructure to run them.
Solution: Focus on your organization’s core business, your core strength, and outsource needlessly painful or expensive parts to those who specialize in them. We already outsource all the time, except we don’t call it “outsourcing”: we buy food, we don’t grow or raise it. We buy cars and don’t build them. Most of us don’t buy physical servers any more. Why? Because others do that better, faster, cheaper.
Problem 2 – Metrics vs. Log Silos: Collecting and visualizing performance metrics and getting alerts when things go awry is great, but performance charts can tell us only so much. Code instrumentation, like SPM’s Transaction Tracing, goes deeper and provides more insight, but still doesn’t tell us the whole story. Similarly, collecting logs and being able to search them is very valuable. Unfortunately, oftentimes APM and log management solutions live in separate silos that don’t really talk to each other.
Solution: Don’t waste your time jumping between multiple disconnected solutions, be they open-source or commercial. Time is the most precious thing each of us has, and our time as DevOps engineers is very expensive. Use a tool or service that gives you access to as many bits of operational information that you need as possible. Not only is this more efficient, and thus cheaper, it’s also much more pleasant than jumping between solutions for browser and terminal, top, vmstat, dstat, less, grep, etc. which are needlessly manual and get boring.
Troubleshooting Doesn’t Need To Take Over Your Life
Troubleshooting production performance issues, dealing with APM alerts and even looking at logs (don’t even think about grepping!) isn’t that hard or time consuming. Well, as long as you have the right tools, that is.
Cloud & On Premises Deployments
Unlike most monitoring and logging solutions, Sematext offers both Cloud and On Premises deployments for SPM and Logsene. We’re happy to discuss package pricing if you’d like to combine both products.
Got ideas how we could make metrics and logs correlation more useful for you? Let us know via comments, email or @sematext.
Not using SPM and/or Logsene yet? Check out the free 30-day trial by registering here (ping us if you’re a startup, a non-profit, or educational institution – we’ve got special pricing for you!). There’s no commitment and no credit card required.
Docker Logging has been a very popular topic of late in our internal and external discussions. So much so that we decided to hold webinars on the topic (and Docker Monitoring as well) and now we’re making them available to everyone.
The webinars were presented by Sematext’s DevOps Evangelist, Stefan Thies. Stefan discussed Docker logging basics, including: the different log collection options Docker users have; the pros and cons of each option; specific and existing Docker logging solutions; log shipping to ELK Stack; and more.
Once you’ve checked out some of the Docker content sign up for a free 30-day trial (no credit card required) of Logsene or request a demo to see how easy it is to get up and running.
There’s a good chance you will also like SPM, our performance monitoring solution, that, like Logsene, offers alerting and anomaly detection on top of all the other benefits. We’re even offering a 20% discount on SPM and Logsene to webinar viewers. Just use these codes when creating new SPM and Logsene apps:
SPM: 201509WNR20S
Logsene: 201509WNR20L
Docker Monitoring Webinar & Slides
Speaking of metrics…for those of you with an interest in Docker Monitoring, we held a webinar on that subject as well. Click here to access the webinar video recording and slides.
The recent Docker Monitoring webinar is ready for consuming! Our DevOps Evangelist, Stefan Thies, took attendees on a tour of Docker monitoring basics, including a number of different Docker monitoring options and their pros and cons, solutions for Docker monitoring, and a brief Q&A session.
If you use Docker you know that these deployments can be very dynamic, not to mention all the ways there are to monitor Docker containers, collect logs from them, etc. etc. And if you didn’t know these things, well, you’ve come to the right place!
Once you’ve checked out some of the Docker content sign up for a free 30-day trial (no credit card required) of SPM for Docker or request a demo to see how easy it is to get up and running.
There’s a good chance you will also like Logsene, our centralized logging solution that, like SPM, offers alerting and anomaly detection on top of all the other benefits. We’re even offering a 20% discount on SPM and Logsene to webinar viewers. Just use these codes when creating new SPM or Logsene apps:
SPM: 201509WNR20S
Logsene: 201509WNR20L
Docker Logging Webinar & Slides
Speaking of logs…for those of you with an interest in Docker Logging, we held a webinar on that subject as well. Click here to access the webinar video recording and slides.
If you’re an avid Solr user you’ll want to check out these Lucene / Solr Revolution videos from two of Sematext’s Solr experts: Rafal Kuc and Radu Gheorghe.
Tuning Solr for Logs
Radu talked about Solr performance tuning, which is always nice for keeping your applications snappy and your costs down. This is especially true for logs, social media and other stream-like data that can easily grow into terabyte territory.
(note: there’s no audio between 3:30 and 4:30; we hope to have this fixed soon and it doesn’t materially affect the talk)
Solr Anti-Patterns
Rafal points out common mistakes and roads that should be avoided at all costs when dealing with Solr.