How to Ship Heroku Logs to Logsene / Managed ELK Stack

Heroku is a cloud platform based on a managed container system, with integrated data services and a powerful ecosystem for deploying and running modern apps.  In this post we’ll show how you can ship logs from Heroku to Logsene, where you can then search your logs, get alerts based on log data, share log dashboards with your team, etc.

Watching Heroku logs in real-time in the terminal is easy using the “heroku logs” command, which is fine for ad-hoc log checks, but not for a serious production system.  For production, you want to collect, parse, and ship logs to a log management system, where rich reporting and troubleshooting can be done.  To do that the Heroku Log Drain setup is a must. What is a Heroku Log Drain and what does it do? In short, a Heroku Log Drain streams logs of your applications deployed on Heroku, either to a syslog or an HTTPS server.

When you have to deal with a large log volume a scalable log storage is required.  This is where Logsene comes into play. Logsene provides a hosted ELK Stack and is available On Premises and in the Cloud. Logagent-js is a smart log parser written in node.js, taking advantage of async I/O to receive, parse and ship logs – including routing different application logs to different full text indices. We made the Logagent-js deployment on Heroku very easy and scaling out for a very high log volume is just one “heroku scale web=N” command away.

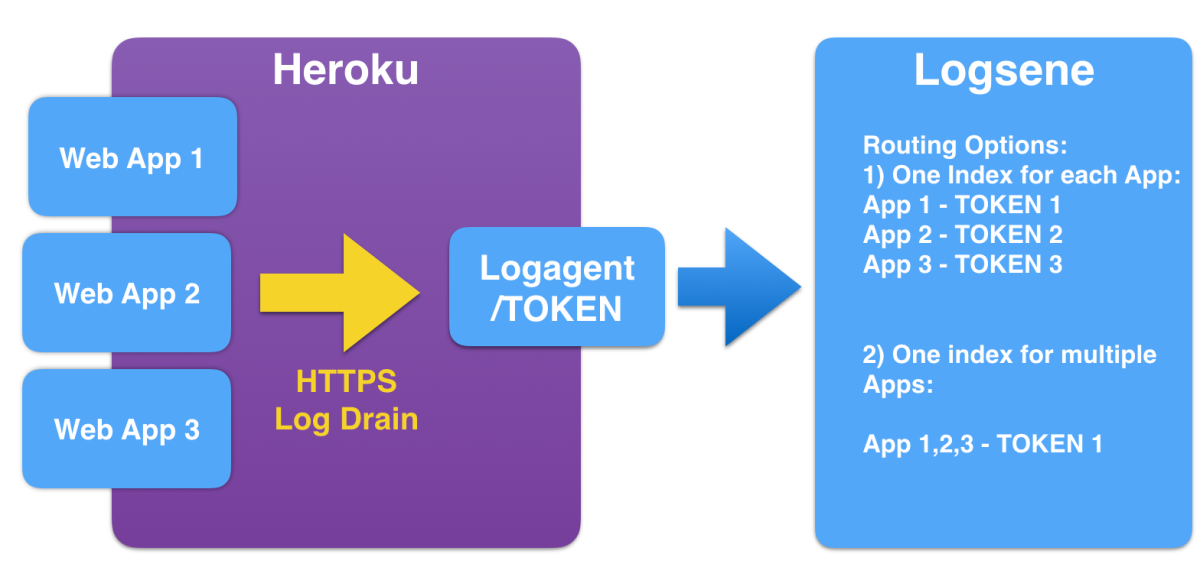
Let’s have a look at the architecture of this setup:

  1. Heroku Apps configured with a Heroku Log Drain
  2. logagent-js to receive, parse and ship logs
  3. Logsene as backend to store all your logs


Step 1 – Create your Logsene App

If you don’t have a Logsene account already simply get a free account and create a Logsene App. This will get you a Logsene Application Token, which we’ll use in Step 3.

Step 2 – Deploy Logagent-js to Heroku

heroku-button.png

We’ve prepared a  “Deploy to Heroku” button – just click on it and enter a name for the deployed log agent in the Heroku UI:

heroku-screenshot

Remember this name because we’ll need it later as the URL for the Log Drain.
Logagent-js can handle multiple Logsene tokens, which means it could be used for more than 1 Logsene app, simply addressed by /LOGSENE_TOKEN in the URL.

To run a short test without deploying logagent-js feel free to use the one we deployed for demos with the name “logsene-test”, reachable via https://logsene-test.herokuapp.com.

Step 3 – Configure Log Drain for your App

To configure the Heroku Log Drain we need the following information:

  1. The Logsene App Token
  2. The URL for the deployed logagent-js (e.g. logsene-app1.herokuapp.com)
  3. The Heroku App ID or name of your Application on Heroku (e.g. web-app-1 in the example below)

Then we can use the Heroku command line tool, for example like this:

heroku drains:add –app web-app-1 https://logsene-app1.herokuapp.com/25560d7b-ef59-4345-xxx-xxx

Or we could use the Heroku API to activate the Log Drain:

curl -n -X POST https://api.heroku.com/apps/web-app-1/log-drains \
-d '{"url": "https://logsene-app1.herokuapp.com/25560d7b-ef59-4345-xxx-xxx"}' \
-H "Content-Type: application/json" \
-H "Accept: application/vnd.heroku+json; version=3"

Step 4 – Watch your Logs in Logsene

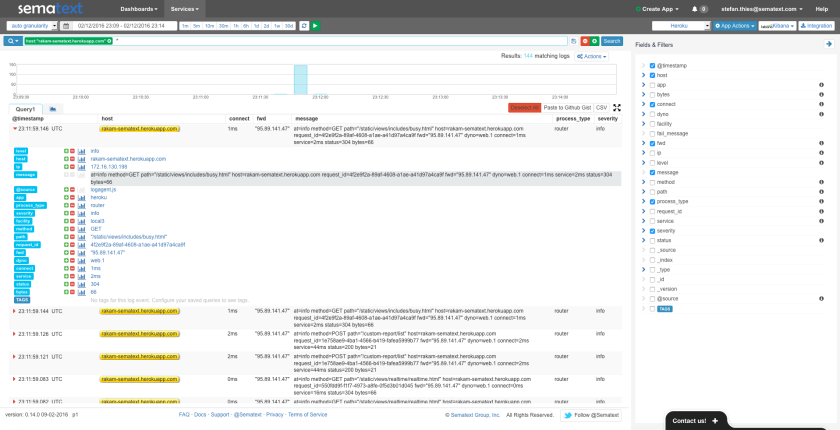
If you now access your App, Heroku should log your HTTP request and a few seconds later the logs will be visible in Logsene. And not in just any format!  You’ll see PERFECTLY STRUCTURED HEROKU LOGS:

heroku-logs-in-logsene.png

Enjoy!

Like what you saw here? To start with Logsene get a free account here or drop us an email, hit us on Twitter.  Logagent-js is open-source – if you find any bugs please create an issue on Github with suggestions, questions or comments.


Elasticsearch Training in London

3 Elasticsearch Classes in London


es-training-240x187

Elasticsearch for Developers ……. April 4-5

Elasticsearch for Logging ……… April 6

Elasticsearch Operations …….  April 6

All classes cover Elasticsearch 2.x

Hands-on — lab exercises follow each class section

Early bird pricing until February 29

Add a second seat for 50% off

Register_Now_2

Course overviews are on our Elasticsearch Training page.

Want a training in your city or on-site?  Let us know!

Attendees in all three workshops will go through several sequences of short lectures followed by interactive, group, hands-on exercises. There will be Q&A sessions in each workshop after each such lecture-practicum block.

Got any questions or suggestions for the course? Just drop us a line or hit us @sematext!

Lastly, if you can’t make it…watch this space or follow @sematext — we’ll be adding more Elasticsearch training workshops in the US, Europe and possibly other locations in the coming months.  We are also known worldwide for Elasticsearch Consulting Services, and Elasticsearch Production Support.
We hope to see you in London in April!

2015 in Review

Another year is behind us, and it’s been another good year for us at Sematext.  Here are the highlights in the chronological order.  If you prefer looking non-chronological overview, look further below.

January

We started the year by doing a ton of publishing on the blog – about Solr-Redis, about SPM and Slack, about Solr vs. Elasticsearch – always a popular topic, Spark, Kafka, Cassandra, Solr, etc.  Logsene being ELK as a Service means we made sure users have the freedom and flexibility to create custom Elasticsearch Index Templates in Logsene.

February

We added Account Sharing to all our products, thus making it easier to share SPM, Logsene, and Site Search Analytics apps by teams.  We made a big contribution to Kafka 0.8.2 by reworking pretty much all Kafka metrics and making them much more useful and consumable by Kafka monitoring agents.  We also added support for HAProxy monitoring to SPM.

March

We announced Node.js / io.js monitoring.  This was a release of our first Node.js-based monitoring monitoring agent – spm-agent-nodejs, and our first open-source agent.  The development of this agent resulted in creation of spm-agent an extensible framework for Node.js-based monitoring agents.  HBase is one of those systems with tons of metrics and with metrics that change a lot from release to release, so we updated our HBase monitoring support for HBase 0.98.

April

The SPM REST API was announced in April, and a couple of weeks later the spm-metrics-js npm module for sending custom metrics from Node.js apps to SPM was released on Github.

May

A number of us from several different countries gathered in Krakow in May.  The excuse was to give a talk about Tuning Elasticsearch Indexing Pipeline for Logs at GeeCon and give away our eBook – Log Management & Analytics – A Quick Guide to Logging Basics while sponsoring GeeCon, but in reality it was really more about Żubrówka and Vișinată, it turned out.  Sematext grew a little in May with 3 engineers from 3 countries joining us in a span of a couple of weeks.  We were only dozen people before that, so this was decent growth for us.

Right after Krakow some of us went to Berlin to give another talk: Solr and Elasticsearch – Side by Side with Elasticsearch and Solr: Performance and Scalability.  While in Berlin we held our first public Elasticsearch training and, following that, quickly hopped over to Hamburg to give a talk at a local search meetup.

June

In June we gave a talk on the other side of the Atlantic – in NYC – Beyond POC: Processing Metrics, Logs and Traces … at Scale.  We were conference sponsors there as well and took part in the panel about microservices.  We published our second eBook – Elasticsearch Monitoring Essentials eBook.  The two most important June happenings were the announcement of Docker monitoring – SPM for Docker – our solution for monitoring Docker containers, as well as complete, seamless integration of Kibana 4 into Logsene.  We’ve added Servers View to SPM and Logsene got much needed Alerting and Anomaly Detection, as well as Saved Searches and Scheduled Reporting.

July

In July we announced public Solr and Elasticsearch trainings, both in New York City, scheduled for October.  We built and open-sourced Logsene Command Line Interfacelogsene-cli – and we added Tomcat monitoring integration to SPM.

August

At Sematext we use Akka, among other things, and in August we introduced Akka monitoring integration for SPM and open-sourced the Kamon backend for SPM.  We also worked on and announced Transaction Tracing that lets you easily find slow transactions and bottlenecks that caused their slowness, along with AppMaps, which are a wonderful way to visualize all your infrastructure along applications running on it and see, in real-time, which apps and servers are communicating, how much, how often there are errors in each app, and so on.

September

In September we held our first 2 webinars on Docker Monitoring and Docker Logging.  You can watch them both in Sematext’s YouTube channel.

October

We presented From zero to production hero: Log Analysis with Elasticsearch at O’Reilly’s Velocity conference in New York and then Large Scale Log Analytics with Solr at Lucene/Solr Revolution in Austin.  After Texas we came back to New York for our Solr and Elasticsearch trainings.

November

Logsene users got Live Tail in November, while SPM users welcomed the new Top Database Operations report.  Live Tail comes in very handy when you want to semi-passively watch out for errors (or other types of logs) without having to constantly search for them.  While most SPM users have SPM monitoring agents on their various backend components, Top Database Operations gives them the ability to gain more insight in performance between the front-end/web applications and backend servers like Solr, Elasticsearch, or other databases by putting the monitoring agents on applications that act as clients for those backend services.  We worked with O’Reilly and produced a 3-hour Working with Elasticsearch Training Video.

December

We finished off 2015 by adding MongoDB monitoring to SPM, joining Docker’s ETP Program for Logging, further integrating monitoring and logging, ensuring Logsene works with Grafana, writing about monitoring Solr on Docker, publishing the popular Top 10 Node.js Metrics to Watch, as well as a SPM vs. New Relic APM comparison.  

Pivoting the above and grouping it by our products and services:

Logsene:

  • Live Tail
  • Alerting
  • Anomaly Detection
  • logsene-cli + logsene.js + logagent-js
  • Saved Searches
  • Scheduled Email Reporting
  • Integrated Kibana
  • Compatibility with Grafana
  • Search AutoComplete
  • Powerful click-and-filter
  • Native charting of numerical fields
  • Account Sharing
  • REST API


SPM:

  • Transaction Tracing
  • SPM Tracing API
  • AppMap
  • NetMap
  • On Demand Profiling
  • Integration with Logsene
  • Expanded monitoring for Elasticsearch, Solr, HBase, and Kafka
  • Added monitoring for Docker, Node.js, Akka, MongoDB, HAProxy, and Tomcat
  • Birds Eye Servers View
  • Account Sharing
  • REST API


Webinars:

  • Docker Monitoring
  • Docker Logging


Trainings:

  • Elasticsearch training in Berlin
  • Solr and Elasticsearch trainings in New York


eBooks:

  • Elasticsearch Monitoring Essentials
  • Log Management & Analytics – A Quick Guide to Logging Basics


Talks / Presentations / Conferences:

  • Lucene/Solr Revolution, Austin, TX – Large Scale Log Analytics with Solr
  • Velocity Conference, NYC, NY – Log Analysis with Elasticsearch
  • Berlin Buzzwords, Berlin, Germany – Side by Side with Elasticsearch and Solr: Performance and Scalability
  • GeeCon, Krakow, Poland – Tuning Elasticsearch Indexing Pipeline for Logs
  • DevOps Days, Warsaw, Poland – Running High Performance and Fault Tolerant Elasticsearch Clusters on Docker
  • DevOps Expo, NYC, NY – Process Metrics, Logs, and Traces at Scale


Trends:

All numbers are up  – our SPM and Logsene signups are up, product revenue is up a few hundred percent from last year, we’ve nearly doubled our blogging volume, our site traffic is up,we’ve made several UI-level facelifts for both apps.sematext.com and www.sematext.com, our team has grown, we’ve increased the number of our Solr and Elasticsearch Production Support customers, and we’ve added Solr and Elasticsearch Training to the list of our professional services.

 

Beyond POC: Processing Metrics, Logs and Traces … at Scale

For those of you attending next week’s DevOps Summit event in New York City (part of the larger Cloud Computing Expo) with an interest in topics like performance monitoring and processing metrics, log management, and distributed transaction tracing — at scale, no less! — then Sematext founder Otis Gospodnetić will be speaking your language on Wednesday, June 10.

Talk Summary

Application metrics, logs, and business KPIs are a goldmine. It’s easy to get started with the ELK stack (Elasticsearch, Logstash and Kibana) — you can see lots of people coming up with impressive dashboards, in less than a day, with no previous experience. Going from proof-of-concept to production tends to be a bit more difficult, unfortunately, and it tends to gobble up our attention, time, and money. In this talk Otis will share the architecture and decisions behind our services for handling large volumes of performance metrics, traces, logs, anomaly detection, alerts, etc. Attendees will follow data from its sources, its collection, aggregation, storage, and visualization. The talk will also cover the overview of some of the relevant technologies and their strengths and weaknesses, such as HBase, Elasticsearch, and Kafka.

  • Date: Wednesday, June 10
  • Time: 3:30 pm to 4:30 pm

Panel Discussion: Microservices and IoT Power

Otis will also be participating in a lunchtime panel discussion, also on June 10 (from 12:45 pm to 1:45 pm) with other tech industry experts called “Microservices and IoT Power” that dives deep into the important architectural principles behind implementing IoT solutions for the enterprise. Let’s face it, as remote IoT devices and sensors become increasingly intelligent, they become part of our distributed cloud environment, and we must architect and code accordingly.  It promises to contain buzzwords galore!

DevOps_Summit

Let’s Talk About Elasticsearch, ELK Stack, Solr, Spark, Kafka, APM, Centralized Log Management, and…

We’ll be at Booth #230 in the DevOps Summit section of the floor, so stop by and say hello.  We’ll be demo-ing SPM performance monitoring, Logsene Log Management and Analytics and Site Search Analytics, along with our usual interest in discussing Search and Big Data consulting topics and more.  Or just drop us an email or DM us if you’re not going to be in the Big Apple from June 9-11 but have interest in chatting.

Hope to see you in NYC next week!

Elasticsearch Training in Berlin – Wednesday, June 3

For those of you interested in some comprehensive Elasticsearch training taught by experts from Sematext who know it inside and out, we’re running an Elasticsearch Intro workshop in Berlin on Wednesday, June 3 (the day after Berlin Buzzwords ends). This full-day, hands-on training workshop will be taught by Sematext engineer — and author of several Elasticsearch booksRafal Kuc.  The workshop is open to anyone, not just folks who attended Berlin Buzzwords.

ES_intro_2

Here are the details:

  • Date:  Wednesday, June 3
  • Time:  9:00 a.m. to 5:00 p.m.
  • Location:  idealo internet GmbH, Ritterstraße 11, 10969 Berlin, Germany (less than 2 km from Buzzwords site)
  • Cost:  EUR 400 (early bird rate, valid through May 25) – EUR 500 afterward – 50% off 2nd seat!
  • Food/Drinks:  Light breakfast, lunch and post-workshop snacks & beverages

Register_Now_2 In this training workshop attendees will go through a series of short lectures followed by exercises and Q&A sessions covering the many aspects of Elasticsearch.  There will also be plenty of opportunities to get production tips & tricks that make things smoother. We are also considering an Elasticsearch Advanced class to be taught simultaneously at the same location.  If this is of interest to you and/or your colleagues, please drop us a line and it could happen! Lastly, if you can’t make it…watch this space.  We’ll be adding more Elasticsearch training workshops in the US, Europe and possibly other locations in the coming months.  We are also known worldwide for our Elasticsearch consulting services and production support if you need help asap. Hope to see you in Berlin!

Elasticsearch Training at GeeCON 2015

[Note: Early Bird pricing ends on Tuesday, May 5!]

For those of you interested in some comprehensive Elasticsearch training taught by experts (and authors of several Elasticsearch books!) who know it inside and out, you are in luck if you are attending — or considering — the GeeCON conference taking place in Krakow from May 13-15.

There will be two full-day training workshops held on May 12 — Elasticsearch Intro and Elasticsearch Advanced — run by Sematext engineers Radu Gheorghe and Rafał Kuć.

You can find the details for each session here, including costs and topics covered:

Elasticsearch Intro

ES_intro_2

Elasticsearch Advanced

ES_advanced_2

In both training workshops attendees will go through a series of short lectures followed by exercises and Q&A sessions covering the many aspects of Elasticsearch.  There will also be plenty of opportunities to get production tips & tricks that make things smoother.

If you can’t make it…watch this space.  We’ll be adding more Elasticsearch training workshops in the US, Europe and possibly other locations in the coming months.  We are also known worldwide for our Elasticsearch consulting services and production support if you need help asap.

Hope to see you in Krakow!

Poll Results: HBase Version Distribution

The results for HBase version distribution poll are in.  Thanks to everyone who took the time to vote!

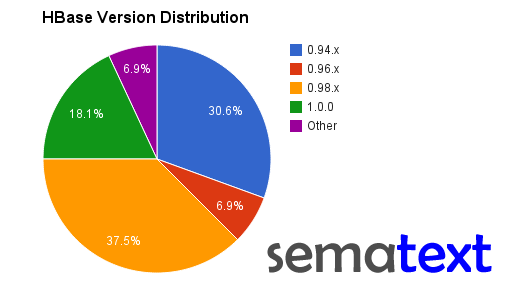
The distribution pie chart is below, but we could summarize it as follows:

  • A big chunk of HBase clusters, about 30%, are still “stuck” on HBase 0.94.x
  • Over 37% of the HBase clusters are on 0.98.x that, until very recently, was the latest stable version
  • Only about 7% of clusters are on the 0.96.x and we can assume these clusters will soon migrate to either 0.98.x or 1.0.x
  • Somewhat surprisingly, almost 20% of HBase clusters are already on HBase 1.0.0 even though 1.0.0 was released only a few weeks ago

It’s great to see so many clusters moving to 1.0.0 so quickly! As for why there are still so many clusters using 0.94.x, which is several years old, see this comment on the HBase mailing list.  Here at Sematext we make heavy use of HBase and were on 0.94.x version for a long time, too.  A few months ago we’ve moved to 0.98.x and have been enjoying all its benefits.  Furthermore, we’ve recently updated SPM for HBase to monitor a pile of new HBase metrics that provide interesting new insights about our HBase clusters though some of the new metric charts.  For example, we are now able to see the dramatic impact of major compactions on data locality (and thus HBase performance!) — see for yourself – https://apps.sematext.com/spm-reports/s/VhOltU14Cy, or the number and size of HLog files over time — https://apps.sematext.com/spm-reports/s/7LU1qvs7ur.

HBase version distribution
Apache HBase Version Distribution

You may also want to check out the results of our other polls about big data technologies.

HBase Poll: Version You Run?

We are updating SPM for HBase to make sure SPM collects all the key HBase metrics that were added in 0.98, we thought it would be good to see which HBase versions are being used in the wild.  We’re on 0.98 after being on 0.94 for a long time.  How about you?

Please tweet this poll and help us spread the word, so we can get a good, statistically significant results.  We’ll publish the results here and via @sematext (follow us!) in a week.

Please tweet this poll and help us spread the word, so we can get a good, statistically significant results.  We’ll publish the results here and via @sematext (follow us!) in a week.

Poll Results: Kafka Version Distribution

The results for Apache Kafka version distribution poll are in.  Thanks to everyone who took the time to vote!

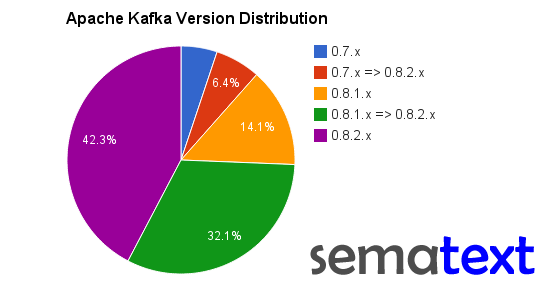
The distribution pie chart is below, but we could summarize it as follows:

  • Only about 5% of Kafka 0.7.x users didn’t indicate they will upgrade to 0.8.2.x in the next 2 months
  • Only about 14% of Kafka 0.8.1.x users didn’t indicate they will upgrade to 0.8.2.x in the next 2 months
  • Over 42% of Kafka users are already using 0.8.2.x!
  • Over 80% of Kafka users say they will be using 0.8.2.x within the next 2 months!

It’s great to see Kafka users being so quick to migrate to the latest version of Kafka!  We’re extra happy to see such quick 0.8.2 adoption because we put a lot of effort into improving Kafka metric, as well as making all 100+ Kafka metrics available via SPM Kafka 0.8.2 monitoring a few weeks ago, right after Kafka 0.8.2 was released.

Apache Kafka Version Distribution


You may also want to check out the results of our recent Kafka Producer/Consumer language poll.


Kafka Poll: Version You Use?

UPDATE: Poll Results!

With Kafka 0.8.2 and 0.8.2.1 being released and with the updated SPM for Kafka monitoring over 100 Kafka metrics, we thought it would be good to see which Kafka versions are being used in the wild.  Kafka 0.7.x was a strong and stable release used by many.  The 0.8.1.x release has been out since March 2014.  Kafka 0.8.2.x has been out for just a little while, but…. are there any people who are either already using it (we are!) or are about to upgrade to it? Please tweet this poll and help us spread the word, so we can get a good, statistically significant results.  We’ll publish the results here and via @sematext (follow us!) in a week.

Please tweet this poll and help us spread the word, so we can get a good, statistically significant results.  We’ll publish the results here and via @sematext (follow us!) in a week.