SolrCloud Rebalance API

This is a post of the work done at BloomReach on smarter index & data management in SolrCloud.  

Authors: Nitin Sharma – Search Platform Engineer & Suruchi Shah –  Engineering Intern


Nitin_intro

Introduction

In a multi-tenant search architecture, as the size of data grows, the manual management of collections, ranking/search configurations becomes non-trivial and cumbersome. This blog describes an innovative approach we implemented at BloomReach that helps with an effective index and a dynamic config management system for massive multi-tenant search infrastructure in SolrCloud.

Problem

The inability to have granular control over index and config management for Solr collections introduces complexities in geographically spanned, massive multi-tenant architectures. Some common scenarios, involving adding and removing nodes, growing collections and their configs, make cluster management a significant challenge. Currently, Solr doesn’t offer a scaling framework to enable any of these operations. Although there are some basic Solr APIs to do trivial core manipulation, they don’t satisfy the scaling requirements at BloomReach.

Innovative Data Management in SolrCloud

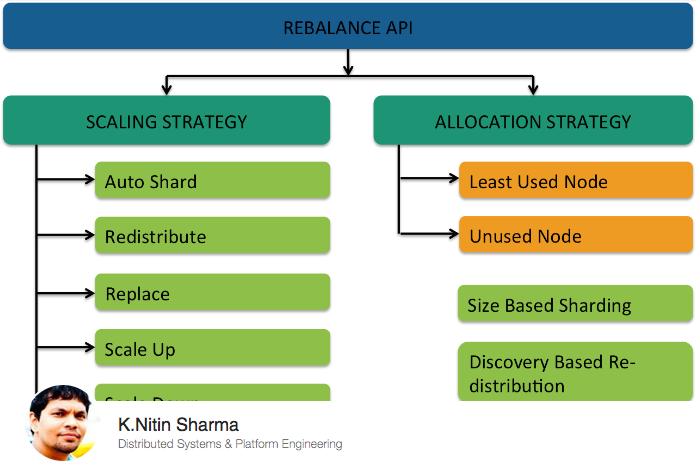
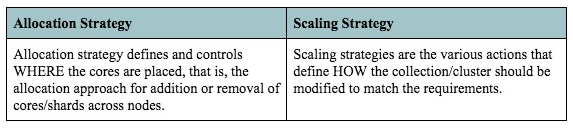
To address the scaling and index management issues, we have designed and implemented the Rebalance API, as shown in Figure 1. This API allows robust index and config manipulation in SolrCloud, while guaranteeing zero downtime using various scaling and allocation strategies. It has  two dimensions:

Nitin_strategy

The seven scaling strategies are as follows:

  1. Auto Shard allows re-sharding an entire collection to any number of destination shards. The process includes re-distributing the index and configs consistently across the new shards, while avoiding any heavy re-indexing processes.  It also offers the following flavors:
    • Flip Alias Flag controls whether or not the alias name of a collection (if it already had an alias) should automatically switch to the new collection.
    • Size-based sharding allows the user to specify the desired size of the destination shards for the collection. As a result, the system defines the final number of shards depending on the total index size.
  2. Redistribute enables distribution of cores/replicas across unused nodes. Oftentimes, the cores are concentrated within a few nodes. Redistribute allows load sharing by balancing the replicas across all nodes.
  3. Replace allows migrating all the cores from a source node to a destination node. It is useful in cases requiring replacement of an entire node.
  4. Scale Up adds new replicas for a shard. The default allocation strategy for scaling up is unused nodes. Scale up also has the ability to replicate additional custom per-merchant configs in addition to the index replication (as an extension to the existing replication handler, which only syncs the index files)
  5. Scale Down removes the given number of replicas from a shard.
  6. Remove Dead Nodes is an extension of Scale Down, which allows removal of the replicas/shards from dead nodes for a given collection. In the process, the logic unregisters the replicas from Zookeeper. This in-turn saves a lot of back-and-forth communication between Solr and Zookeeper in their constant attempt to find the replicas on dead nodes.
  7. Discovery-based Redistribution allows distribution of all collections as new nodes are introduced into a cluster. Currently, when a node is added to a cluster, no operations take place by default. With redistribution, we introduce the ability to rearrange the existing collections across all the nodes evenly.

Continue reading “SolrCloud Rebalance API”

Top 10 Mistakes Made While Learning Solr

Top_10_Solr

  1. Upgrading to the new major version right after its release without waiting for the inevitable .1 release
  2. Explaining your, “I don’t need backups, I can always reindex” statement to your manager during an 8-hour reindexing session
  3. Taking down the whole Data Center with a single rows=1000000000000000 request while singing, “I want it all / I want it now”
  4. In a room full of Solr users wondering out loud why you’re not using Elasticsearch instead
  5. Splitting shards like it’s 1999
  6. Giving Solr’s JVM all the memory you’ve got and getting paged in the middle of the night
  7. Running hundreds of queries with facet.mincount=0 and facet.limit=-1 and wondering why the YouTube videos you’re trying to watch are being buffered
  8. Using shards=1 and replicationFactor=1 and wondering why only a single node in your hundred nodes cluster is being used
  9. Optimizing after commits, hard committing every 5 seconds, using openSearcher=true and still wondering why your terminal is all slow
  10. …and last but not least: not taking Sematext Solr guru @kucrafal’s upcoming Solr Training course in October in NYC!  [Note: since this workshop has already taken place, stay up to date with future workshops at our Solr Training page]

Solr Training in New York City — October 19-20

[Note: since this workshop has already taken place, stay up to date with future workshops at our Solr Training page]

——-

For those of you interested in some comprehensive Solr training taught by an expert from Sematext who knows it inside and out, we’re running a super hands-on training workshop in New York City from October 19-20.

This two-day workshop will be taught by Sematext engineer — and author of Solr books — Rafal Kuc.

Target audience:

Developers and Devops who want to configure, tune and manage Solr at scale.

What you’ll get out of it:

In two days of training Rafal will help:

  • bring Solr novices to the level where he/she would be comfortable with taking Solr to production
  • give experienced Solr users proven and practical advice based on years of experience designing, tuning, and operating numerous Solr clusters to help with their most advanced and pressing issues

* See the Course Outline at the bottom of this post for details

When & Where:

  • Dates:        October 19 & 20 (Monday & Tuesday)
  • Time:         9:00 a.m. — 5:00 p.m.
  • Location:     New Horizons Computer Learning Center in Midtown Manhattan (map)
  • Cost:         $1,200 “early bird rate” (valid through September 1) and $1,500 afterward.  And…we’re also offering a 50% discount for the purchase of a 2nd seat!
  • Food/Drinks: Light breakfast and lunch will be provided

Register_Now_2

Attendees will go through several sequences of short lectures followed by interactive, group, hands-on exercises. There will be a Q&A session after each such lecture-practicum block.

Got any questions or suggestions for the course? Just drop us a line or hit us @sematext!

Lastly, if you can’t make it…watch this space or follow @sematext — we’ll be adding more Solr training workshops in the US, Europe and possibly other locations in the coming months.  We are also known worldwide for our Solr Consulting Services and Solr Production Support.

Hope to see you in the Big Apple in October!

——-

Solr Training Workshop – Course Outline

  • Introduction to Solr
  1. What is Solr and use – cases
  2. Solr master – slave architecture
  3. SolrCloud architecture
  4. Why & When SolrCloud
  5. Solr master – slave vs SolrCloud
  6. Starting Solr with schema-less configuration
  7. Indexing documents
  8. Retrieving documents using URI request
  9. Deleting documents
  • Indexing data

Continue reading “Solr Training in New York City — October 19-20”

Elasticsearch Training in New York City — October 19-20

[Note: since this workshop has already taken place, stay up to date with future workshops at our Elasticsearch / ELK Stack Training page]

——-

For those of you interested in some comprehensive Elasticsearch and ELK Stack (Elasticsearch / Logstash / Kibana) training taught by experts from Sematext who know them inside and out, we’re running a super hands-on training workshop in New York City from October 19-20.

This two-day, hands-on workshop will be taught by experienced Sematext engineers — and authors of Elasticsearch booksRafal Kuc and Radu Gheorghe.

Target audience:

Developers and DevOps who want to configure, tune and manage Elasticsearch and ELK Stack at scale.

What you’ll get out of it:

In two days with training run by two trainers we’ll:

  • bring Elasticsearch novices to the level where he/she would be comfortable with taking Elasticsearch to production
  • give experienced Elasticsearch users proven and practical advice based on years of experience designing, tuning, and operating numerous Elasticsearch clusters to help with their most advanced and pressing issues

When & Where:

  • Dates:        October 19 & 20 (Monday & Tuesday)
  • Time:         9:00 a.m. — 5:00 p.m.
  • Location:     New Horizons Computer Learning Center in Midtown Manhattan (map)
  • Cost:         $1,200 “early bird rate” (valid through September 1) and $1,500 afterward.  And…we’re also offering a 50% discount for the purchase of a 2nd seat!
  • Food/Drinks: Light breakfast and lunch will be provided

Register_Now_2

Attendees will go through several sequences of short lectures followed by interactive, group, hands-on exercises. There will be a Q&A session after each such lecture-practicum block.

Course outline:

  1. Basic flow of data in Elasticsearch
    1. what is Elasticsearch and typical use-cases
    2. installation
    3. index
    4. get
    5. search
    6. update
    7. delete
  2. Controlling how data is indexed and stored
    1. mappings and mapping types
    2. strings, integers and other core types
    3. _source, _all and other predefined fields
    4. analyzers
    5. char filters
    6. tokenizers
    7. token filters
  3. Searching through your data
    1. selecting fields, sorting and pagination
    2. search basics: term, range and bool queries
    3. performance: filters and the filtered query
    4. match, query string and other general queries
    5. tweaking the score with the function score query
  4. Aggregations
    1. relationships between queries, filters, facets and aggregations
    2. metrics aggregations
    3. multi-bucket aggregations
    4. single-bucket aggregations and nesting
  5. Working with relational data
    1. arrays and objects
    2. nested documents
    3. parent-child relations
    4. denormalizing and application-side joins
  6. Performance tuning
    1. bulk and multiget APIs
    2. memory management: field/filter cache, OS cache and heap sizes
    3. how often to commit: translog, index buffer and refresh interval
    4. how data is stored: merge policies; store settings
    5. how data and queries are distributed: routing, async replication, search type and shard preference
    6. doc values
    7. thread pools
    8. warmers
  7. Scaling out
    1. multicast vs unicast
    2. number of shards and replicas
    3. node roles
    4. time-based indices and aliases
    5. shard allocation
    6. tribe node
  8. Monitor and administer your cluster
    1. mapping and search templates
    2. snapshot and restore
    3. health and stats APIs
    4. cat APIs
    5. monitoring products
    6. hot threads API
  9. Beyond keyword search
    1. percolator
    2. suggesters
    3. geo-spatial search
    4. highlighting
  10. Ecosystem
    1. indexing tools: Logstash, rsyslog, Apache Flume
    2. data visualization: Kibana
    3. cluster visualization: Head, Kopf, BigDesk

Got any questions or suggestions for the course? Just drop us a line or hit us @sematext!

Lastly, if you can’t make it…watch this space or follow @sematext — we’ll be adding more Elasticsearch / ELK stack training workshops in the US, Europe and possibly other locations in the coming months.  We are also known worldwide for our Elasticsearch Consulting Services and Elasticsearch/ELK Production Support, as well as ELK Consulting.

Hope to see you in the Big Apple in October!

Replaying Elasticsearch Slowlogs with Logstash and JMeter

Sometimes we just need to replay production queries – whether it’s because we want a realistic load test for the new version of a product or because we want to reproduce, in a test environment, a bug that only occurs in production (isn’t it lovely when that happens? Everything is fine in tests but when you deploy, tons of exceptions in your logs, tons of alerts from the monitoring system…).

With Elasticsearch, you can enable slowlogs to make it log queries taking longer (per shard) than a certain threshold. You can change settings on demand. For example, the following request will record all queries for test-index:

curl -XPUT localhost:9200/test-index/_settings -d '{
  "index.search.slowlog.threshold.query.warn" : "1ms"
}'

You can run those queries from the slowlog in a test environment via a tool like JMeter. In this post, we’ll cover how to parse slowlogs with Logstash to write only the queries to a file, and how to configure JMeter to run queries from that file on an Elasticsearch cluster.

Continue reading “Replaying Elasticsearch Slowlogs with Logstash and JMeter”

Large Scale Log Analytics with Solr – Presentation Upvoting

If topics like log analytics and Solr are your thing then we may have a treat for you at the upcoming Lucene / Solr Revolution conference in Austin in October.  Two of Sematext’s engineers and Solr, Elasticsearch and ELK stack experts — Rafal Kuc and Radu Gheorghe — have proposed a talk called “Large Scale Log Analytics with Solr” and could use some upvoting from the community to get in on this year’s agenda.

To show your support for “Large Scale Log Analytics with Solr” just click here to vote.  Takes less than a minute!  Even if you don’t attend the conference, we’ll post the slides and video here on the blog…assuming it gets on the agenda.  Voting will close at 11:59pm EDT on Thursday, June 25th.

LR_2015

Talk Summary

This talk is about searching and analyzing time-based data at scale. Documents ranging from blog posts and social media to application logs and metrics generated by smart watches and other “smart” things share a similar pattern: timestamp among their fields, rarely changeable, deletion when they become obsolete.

Very often this kind of data is so large that it causes scaling and performance challenges. We’ll address precisely these challenges, which include:

  1. Properly designing collections architecture
  2. Indexing data fast and without documents waiting in queues for processing
  3. Being able to run queries that include time-based sorting and faceting on enormous amounts of indexed data without killing Solr
  4. …and many more

We’ll start with the indexing pipeline — where you do all your ETL. We’ll show you how to maximize throughput through various ETL tools, such Flume, Kafka, Logstash and rsyslog, and make them scale and send data to Solr.

On the Solr side, we’ll show all sorts of tricks to optimize indexing and searching: from tuning merge policies to slicing collections based on timestamp. While scaling out, we’ll show how to improve the performance/cost ratio.

Thanks for your support!

1-Click ELK Stack: Hosted Kibana 4

We just pushed a new release of Logsene to production, including 1-Click Access to Kibana 4!

Did you know that Logsene provides a complete ELK Stack? Logsene’s indexing and search API is compatible with the Elasticsearch API.  That’s why it is very easy to use Logsene – you can use the existing Logstash Elasticsearch output, point it to Logsene for indexing, and then you can use Kibana and point it to Logsene like it’s your local Elasticsearch cluster.  And not only is this process easy, but Logsene actually adds more functionality to the bare “ELK” stack!  In fact, here is a long list of features the open-source ELK stack just doesn’t have, such as:

  • User Authentication and User Roles
  • Secured communication (TLS/HTTPS)
  • App Sharing: access control for each Logsene App, aka Index
  • Account Sharing: share resources, not passwords
  • Syslog receiver – no need to run Logstash just for forwarding server logs
  • Anomaly detection and Alerts for logs or any indexed data!

Let’s take a look to the Kibana 4 integration. You’ll find the “Kibana 4” button in the Logsene App Overview. Simply click on it and Kibana 4 will load the data from your Logsene App.

KIbana4-LS-OverviewKibana 4 automatically shows the “Discover” view and doesn’t require any setup – Logsene does everything for you! This means you can immediately start to build Queries, Visualizations, and Dashboards!

Kibana4-Discover
Kibana 4 Discover View – displaying data stored in Logsene
Kibana4-Apache-Logs-Dashboard
Simple Demo Dashboard – try it here!

If you prefer to run Kibana and point it to Logsene, yes, you can still do that; we show how to do that in How to use Kibana 4 with Logsene.

If you don’t want to run and manage your own Elasticsearch cluster but would like to use Kibana for log and data analysis, then give Logsene a quick try by registering here – we do all the backend heavy lifting so you can focus on what you want to get out of your data and not on infrastructure.  There’s no commitment and no credit card required.  And, if you are a young startup, a small or non-profit organization, or an educational institution, ask us for a discount (see special pricing)!

We are happy to answer questions or receive feedback – please drop us a line or get us @sematext.

eBook: Elasticsearch Monitoring Essentials

Elasticsearch is booming.  Together with Logstash, a tool for collecting and processing logs, and Kibana, a tool for searching and visualizing data in Elasticsearch (aka the “ELK stack”), adoption of Elasticsearch continues to grow by leaps and bounds. In this detailed (and free!) booklet Sematext DevOps Evangelist, Stefan Thies, walks readers through Elasticsearch and ELK stack basics and supplies numerous graphs, diagrams and infographics to clearly explain what you should monitor, which Elasticsearch metrics you should watch.  We’ve also included the popular “Top 10 Elasticsearch Metrics” list with corresponding explanations and screenshots.  This booklet will be especially helpful to those who are new to Elasticsearch and ELK stack, but also to experienced users who want a quick jump start into Elasticsearch monitoring.

Free_download

Like this booklet?  Please tweet about Performance Monitoring Essentials Booklet – Elasticsearch Edition

Know somebody who’d find this booklet useful?  Please let them know…

When it comes to actually using Elasticsearch, there are tons of metrics generated.  The goal of creating this free booklet is to provide information that we at Sematext have found to be extremely useful in our work as Elasticsearch and ELK stack consultants, production support providers, and monitoring solution builders.

ES_Book_cover

Topics, including our Top 10 Elasticsearch Metrics

Topics addressed in the booklet include: Elasticsearch Vocabulary, Scaling a Cluster, How Indexing Works, Cluster Health – Nodes & Shards, Node Performance, Search Performance, and many others.  And here’s a quick taste of the kind of juicy content you’ll find inside: a dashboard view of our 10 Elasticsearch metrics list.

Top_10_dashboard

This dashboard image, and all images in the booklet, are from Sematext’s SPM Performance Monitoring tool.

Got Feedback? Questions?

Please give our booklet a look and let us know what you think — we love feedback!  You can DM us (and RT and/or follow us, if you like what you read) @sematext, or drop us an email.

And…if you’d like try SPM to monitor Elasticsearch yourself, check out a Free 30-day trial by registering here.  There’s no commitment and no credit card required. Small startups, startups with no or very little outside funding, non-profit and educational institutions get special pricing – just get in touch with us.

Side by Side with Elasticsearch and Solr: Performance and Scalability

[Note: this post has been updated to include video and slides from the June 2 presentation]

Back by popular demand!  Sematext engineers Radu Gheorghe and Rafal Kuc returned to Berlin Buzzwords on Tuesday, June 2, with the second installment of their “Side by Side with Elasticsearch and Solr” talk.  (You can check out Part 1 here.)

Elasticsearch and Solr Performance and Scalability

This brand new talk — which included a live demo, a video demo and slides — dove deeper into into how Elasticsearch and Solr scale and perform. And, of course, they took into account all the goodies that came with these search platforms since last year.

Radu and Rafal showed attendees how to tune Elasticsearch and Solr for two common use-cases: logging and product search.  Then they showed what numbers they got after tuning. There was also some sharing of best practices for scaling out massive Elasticsearch and Solr clusters; for example, how to divide data into shards and indices/collections that account for growth, when to use routing, and how to make sure that coordinated nodes don’t become unresponsive.

Here is the video:


…and here are the slides:


Feedback & Questions — Bring It On

If you’ve got feedback or questions about topics like Elasticsearch vs. Solr (here’s a detailed comparison) and what’s new and exciting with both applications, just drop us a line.  We live and breathe this stuff, so we’re always happy to hear from like-minded people.

Presentation: Tuning Elasticsearch Indexing Pipeline for Logs

Fresh from GeeCON in Krakow…we have another Elasticsearch and Logging manifesto from Sematext engineers — and book authors — Rafal Kuc and Radu Gheorghe.  As with many of their previous presentations, Radu and Rafal go into detail on Elasticsearch, Logstash and Rsyslog topics like:

  • How Elasticsearch, Logstash and Rsyslog work
  • Tuning Elasticsearch
  • Using, scaling, and tuning Logstash
  • Using and tuning Rsyslog
  • Rsyslog with JSON parsing
  • Hardware and data tests
  • …and lots more along these lines

[Note: Video of the talk coming soon to this post!]

If you find this stuff interesting and have similar challenges, then drop us a line to chat about our Elasticsearch and Logging consulting services and Elasticsearch (and Solr, too) production support.  Oh yeah, and we’re hiring worldwide if you are into Logging, Monitoring, Search, or Big Data Analytics as much as Radu and Rafal!