Want a training in your city or on-site? Let us know!
Attendees in all three workshops will go through several sequences of short lectures followed by interactive, group, hands-on exercises. There will be Q&A sessions in each workshop after each such lecture-practicum block.
Got any questions or suggestions for the course? Just drop us a line or hit us @sematext!
Hands-on — lab exercises follow each class section
Early bird pricing until February 29
Add a second seat for 50% off
Sematext is running a 2-day, very comprehensive, hands-onworkshop in London on April 4 & 5 for Developers and DevOps who want to configure, tune and manage Solr at scale.
The workshop will be taught by Sematext engineer — and author of Solr books — Rafał Kuć. Attendees will go through several sequences of short lectures followed by interactive, group, hands-on exercises. There will be a Q&A session after each such lecture-practicum block. See details, including training overview.
Target audience:
Developers who want to configure, tune and manage Solr at scale and learn about a wide array of Solr features this training covers in its 23 chapters – we mean it when we say this is comprehensive!
What you’ll get out of it:
In two days of training Rafal will:
Bring Solr novices to the level where he/she would be comfortable with taking Solr to production
Give experienced Solr users proven and practical advice based on years of experience designing, tuning, and operating numerous Solr clusters to help with their most advanced and pressing issues
When & Where:
Dates: April 4-5 (Monday & Tuesday)
Time: 9:00 am to 5:00 pm
Place: Imparando City of London Training Centre — 56 Commercial Road, Aldgate, London, E1 1LP (see map)
Cost: GBP £845.00 “Early Bird” rate (valid through February 29) and GBP £1.045.00 afterward. There’s also a 50% discount for the purchase of a 2nd seat!(limit of 1 discounted seat per full-price seat)
Food/Drinks: Light morning & afternoon refreshments and Lunch will be provided
Got any questions or suggestions for the course? Just drop us a line or hit us @sematext!
Coming to you from the recent DevOps Days event in Warsaw and delivered by Sematext engineer Rafal Kuć, “Running High Performance and Fault Tolerant Elasticsearch Clusters on Docker” is chock full of practical information that will no doubt answer many of the questions you might have about this process.
The official Solr Image on Docker Hub was released just a few weeks ago and already has 16K pulls. Why not more? Well, there are more than 200 different Solr images on Docker Hub — probably because no official Image was available!
A rapidly growing number of organizations are using Solr and Docker in production and they are probably happy about the new official Image. Needless to say, monitoring Solr is essential in production. Docker is disruptive in many ways, and there are many things that are slightly different and worth mentioning. These include:
Changed deployment for Solr and its monitoring tools using Dockerfile, Docker Compose or various Orchestration Tools
Logging has changed: containers log to the console and logs need to be retrieved from Docker-Daemon instead getting them from the Solr log file. Check out our post on the subject: Innovative Docker Log Management
Official Images may not provide options for monitoring (such as JMX). However, the official Image for Solr provides an option to pass parameters to the Java Runtime Environment. We we will use this option for Solr monitoring in this post.
Next, I’m going to demonstrate the setup of a Solr node with SPM. The final setup will provide the full Solr & Docker Monitoring and Logging package:
Detailed Application Metrics for Solr, deployed on Docker
Detailed Container Metrics and Docker Events
Centralized Logs for all Containers by SPM for Docker
Let’s first decide on one of the following options to monitor Solr on Docker:
Build your own Solr container with a mix of open-source monitoring/alerting tools. I’m not going to go into detail about this option today because dealing with a mix of open-source DevOps tools and a non-official Solr image doesn’t sound clean; plus, we can do better.
Use a standalone monitoring agent, which queries metrics from the Solr container. This requires a setup for JMX and Docker networking configurations for the monitor and Solr. The metrics gathered by remote agents are limited and, in the Docker context, running an external monitoring process plus Solr processes consumes more resources. And the next option …
Inject an SPM in-process monitoring agent into Solr. This option has the lowest resource usage and has support for advanced monitoring functions like Transaction Tracing and AppMap.
We’ll go with Option #3 in this blog post, as it provides the best insights into Solr. Sematext provides the SPM Client (this includes the monitoring agent and metrics sender) pre-installed in a Docker Image. We refer to this dockerized SPM Client as “SPM Client Image/Container” in the following instructions. The main trick here is to mount a volume from SPM Client Container into Solr Containers in order to load the monitoring library that’s part of the SPM Client Container.
Let’s have a look at the desired setup and how to get there:
The SPM Token is a unique identifier for monitored applications – if you haven’t created an SPM App for Solr, then create one here first. Should take about 37 seconds.
# Set the SPM Token as Environment Variable
export SPM_TOKEN=4feb144c-4da8-4081-83b5-b0b8e06e743a
# Set the JVM Name, which appears in SPM JVM Metrics Report
# In addition we will use it as Hostname for the Solr container
export JVM_NAME=SOLR1
2) Create SPM Client and Solr service in docker-compose.yml Note: you may copy this file to make changes for additional Solr options; all parameters are set as Environment Variables.
In the Environment variable “SOLR_OPTS” in the Docker-Compose file above we see options for the SPM in-process monitor to inject a .jar file from the SPM Client Volume. The SOLR_OPTS string is taken from SPM install instructions. It includes the SPM Token (the ${SPM_TOKEN} part) and provides the JVM name so we can distinguish between multiple Solr instances if we run N of them on the same host (the ::${JVM_NAME} part).
3) Run Solr and SPM Monitor
We are now ready to fire up Solr:
docker-compose up -d
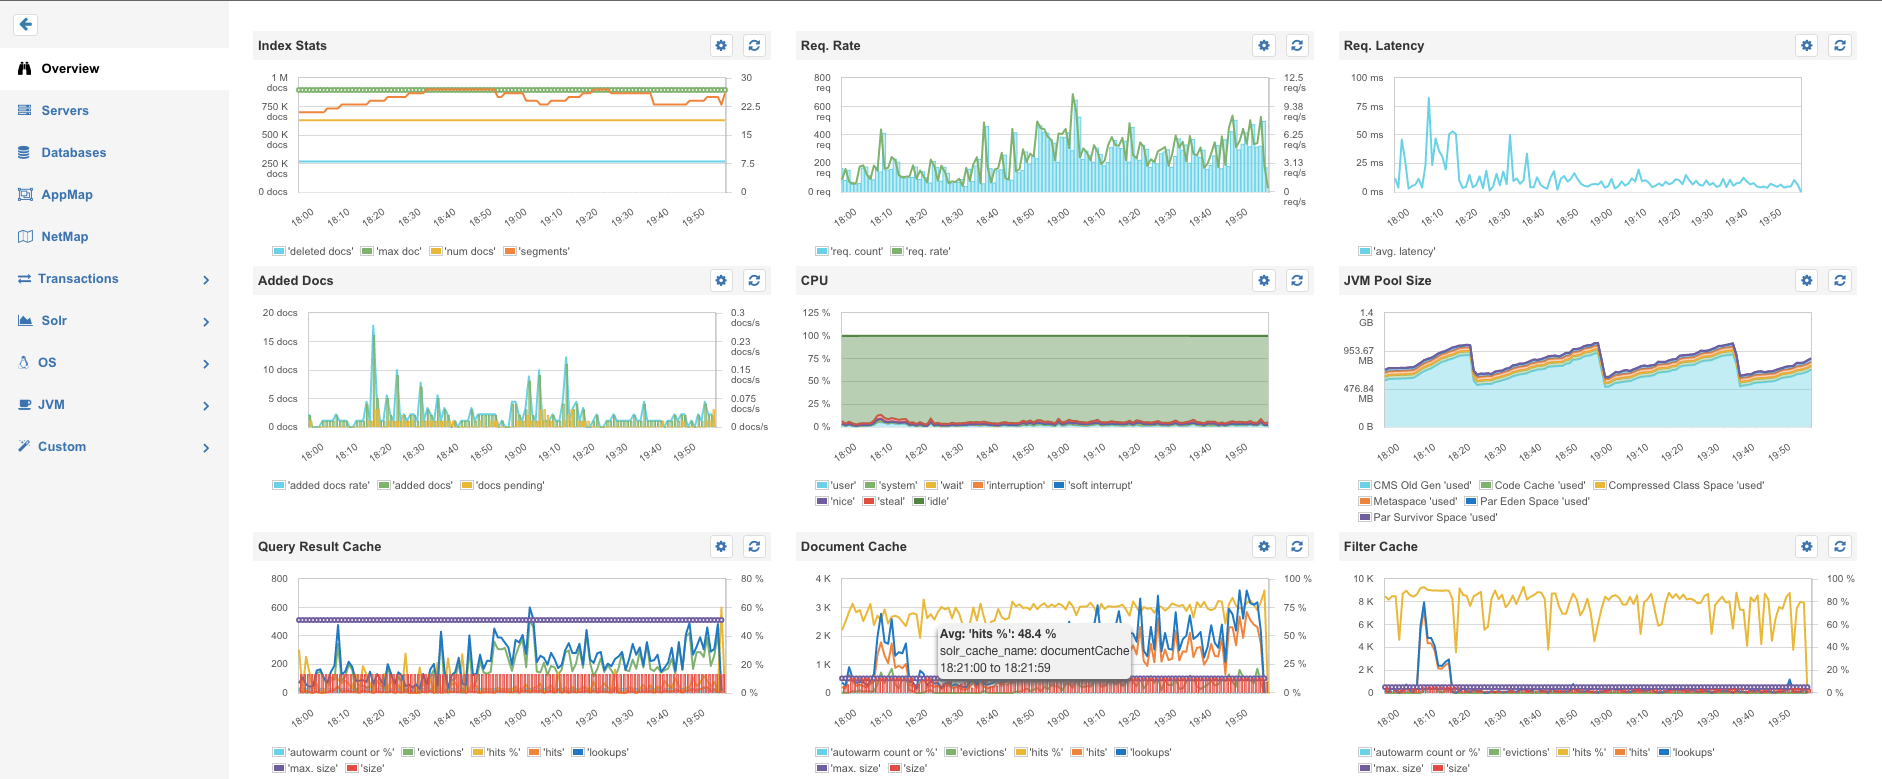
All done! After about a minute, metrics for the Docker Host, JVMs and Solr nodes will appear in SPM. Because we chose a consistent naming for Container hostname, and JVM name we can immediately see, in every chart, the relevant filters named “SOLR1”. This is much better than some random Container IDs.
Solr Metrics Overview
But what about my Solr Logs and the Container Metrics?
Simply run SPM for Docker – it collect logs as well as container and host metrics. It can also parse Solr logs and store them in Logsene (see Logsene 1-Click ELK Stack), which is awesome because it means you can have both Solr/OS/JVM metrics AND Solr logs all in one place! Or do you maybe like to ssh to your servers and grep log files?
docker run -d -name sematext-agent -e SPM_TOKEN=SPM_DOCKER_APP_TOKEN -e LOGSENE_TOKEN=LOGSENE_APP_TOKEN sematext/sematext-agent-docker
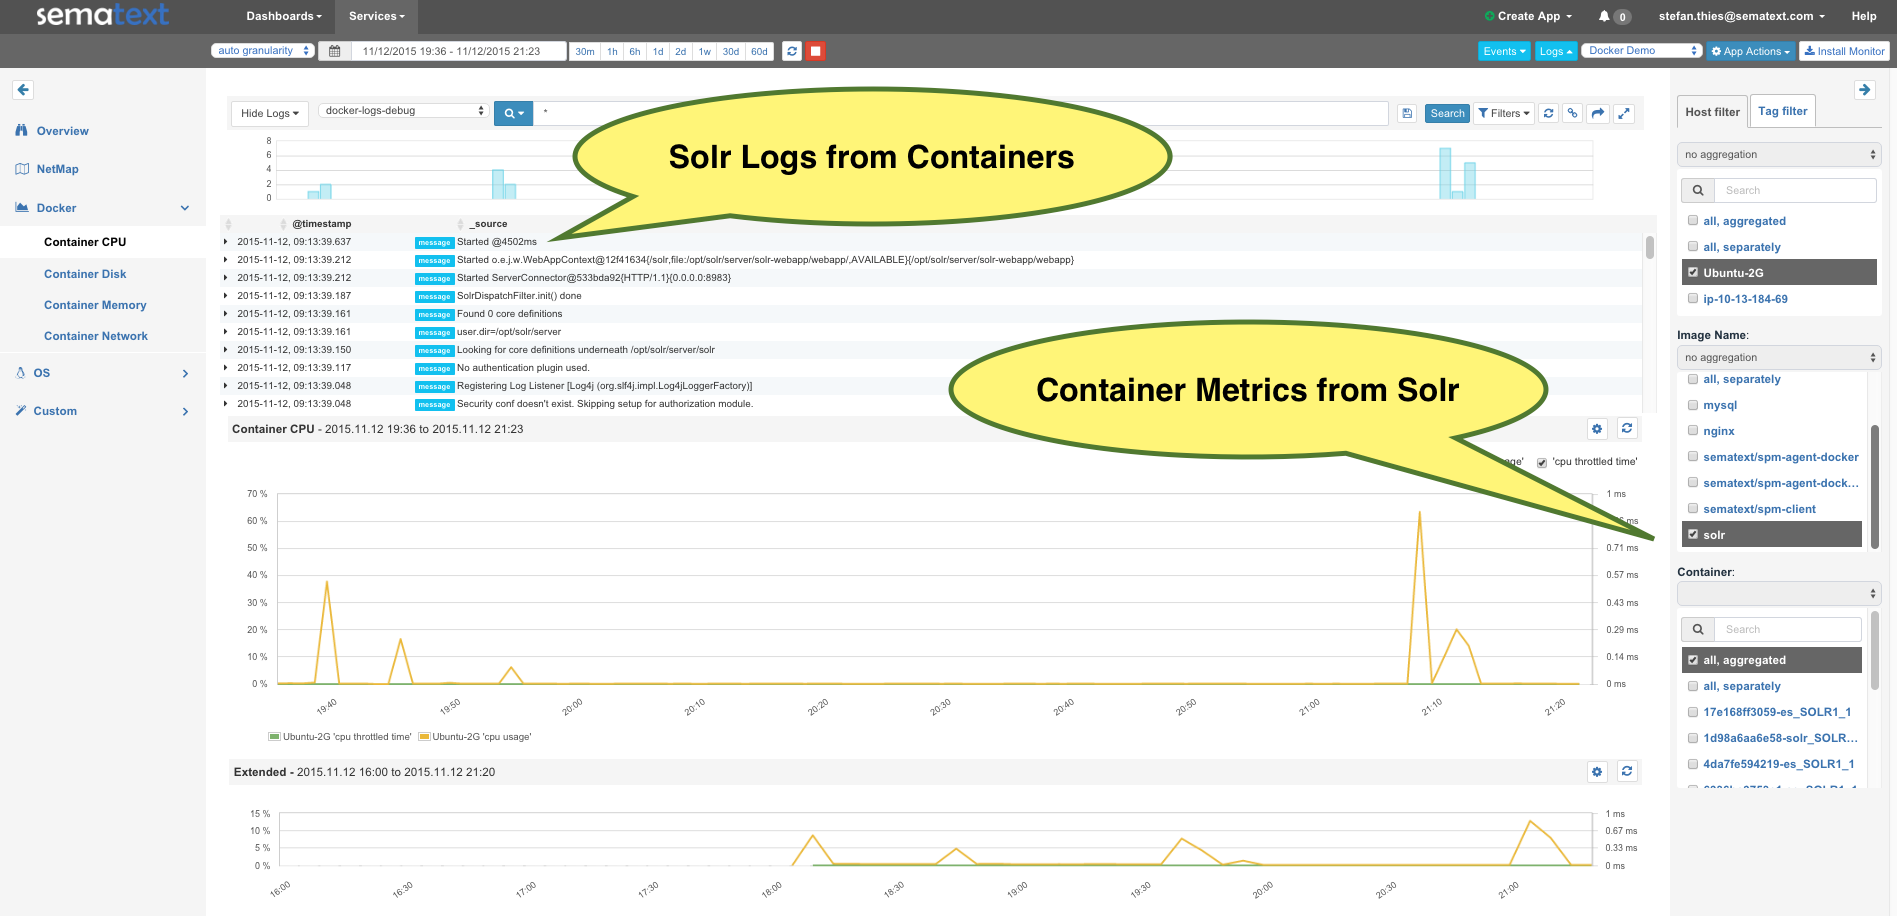
After a few minutes, you will get Host and Container Metrics together with Events and Logs in SPM, as shown here:
Please note that logs from the containers are automatically shipped and parsed! No setup for log shippers? That is correct — there is NO complicated setup of syslog, Logstash, Docker log drivers, etc. All this work is done by SPM for Docker. For example, each log line has a “node_name” field for the Solr node. It takes the timestamp, severity, class, thread and source from the Solr log and each log is automatically tagged with the container ID and image name. Moving from SPM Metrics to detailed Solr Logs including Exceptions and parsed Stack Traces is just another mouse click away! Look:
Multi-Line Exception, captured and parsed from Solr container
The filters next to field stats on the right side of the screen make it easy to identify containers with the most logs by choosing “container_name”. That’s just a little detail in the Logsene UI – feel free to explore it by creating Alerts or Kibana 4 Dashboards for your container logs.
Like what you saw here? To monitor Docker and Solr with SPM just get a free account here! And drop us an email or hit us on Twitter with suggestions, questions or comments. Solr and Docker are topics we enjoy chatting about with the community!
Fresh from DevOps Days in Warsaw and delivered by Sematext engineer Rafal Kuć, “Running High Performance and Fault Tolerant Elasticsearch Clusters on Docker” is chock full of practical information that will no doubt answer many of the questions you might have about this process.
There are many ways to look at Elasticsearch, but here at Sematext we’re pretty confident that you haven’t seen anything like this flowchart to demonstrate how it works:
Download a copy and print your own Elasticsearch poster!
If you’re looking for something unique to show off your Elasticsearch chops, then download a copy today and print your own. We have files for US letter, A4, Ledger (11”x17”) and Poster (24”x36”) sizes.
Doing Centralized Logging with ELK? We Can Help There, Too
If your log analysis and management leave something to be desired, then we’ve got you covered there as well. There’s our centralized logging solution, Logsene, which you can think of as your “Managed ELK Stack in the Cloud.” It’s is also available as an On Premises deployment. Lastly, we offer Logging Consulting should you require more in-depth support.
In this presentation from Lucene/Solr Revolution 2015, Sematext engineers — and Solr and centralized logging experts — Radu Gheorghe and Rafal Kuć talk about searching and analyzing time-based data at scale.
Documents ranging from blog posts and social media to application logs and metrics generated by smartwatches and other “smart” things share a similar pattern: timestamps among their fields, rarely changeable, and deletion when they become obsolete. Because this kind of data is so large it often causes scaling and performance challenges.
In this talk, Radu and Rafal focus on these challenges, including: properly designing collections architecture, indexing data fast and without documents waiting in queues for processing, being able to run queries that include time-based sorting and faceting on enormous amounts of indexed data (without killing Solr!), and many more.
Here is the video:
…and here are the slides:
Here’s a Taste of What You’ll See
How do Logstash, rsyslog, Redis, and fast-food-hating zombies (?!) relate? You’ll have to check out the presentation to find out…
If your log analysis and management leave something to be desired, then we’ve got you covered there as well. There’s our centralized logging solution, Logsene. And we also offer Logging Consulting should you require more in-depth support.
Fresh from the Velocity NYC conference is the latest presentation from Sematext engineers Rafal Kuć and Radu Gheorghe — “From zero to production hero: Log Analysis with Elasticsearch.”
The talk goes through the basics of centralizing logs in Elasticsearch and all the strategies that make it scale with billions of documents in production. They cover:
Time-based indices and index templates to efficiently slice your data
Different node tiers to de-couple reading from writing, heavy traffic from low traffic
Tuning various Elasticsearch and OS settings to maximize throughput and search performance
Configuring tools such as logstash and rsyslog to maximize throughput and minimize overhead
Many Solr users need to handle multi-tenant data. There are different techniques that deal with this situation: some good, some not-so-good. Using routing to handle such data is one of the solutions, and it allows one to efficiently divide the clients and put them into dedicated shards while still using all the goodness of SolrCloud. In this blog post I will show you how to deal with some of the problems that come up with this solution: the different number of documents in shards and the uneven load.
Imagine that your Solr instance indexes your clients’ data. It’s a good bet that not every client has the same amount of data, as there are smaller and larger clients. Because of this it is not easy to find the perfect solution that will work for everyone. However, I can tell one you thing: it is usually best to avoid per/tenant collection creation. Having hundreds or thousands of collections inside a single SolrCloud cluster will most likely cause maintenance headaches and can stress the SolrCloud and ZooKeeper nodes that work together. Let’s assume that we would rather go to the other side of the fence and use a single large collection with many shards for all the data we have.
No Routing At All
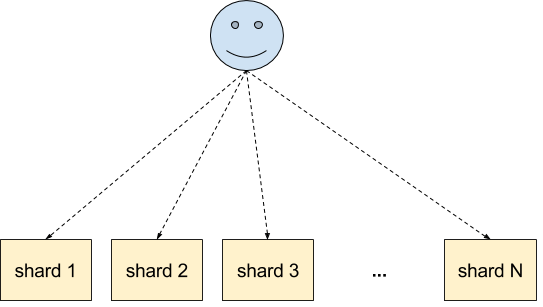
The simplest solution that we can go for is no routing at all. In such cases the data that we index will likely end up in all the shards, so the indexing load will be evenly spread across the cluster:
However, when having a large number of shards the queries end up hitting all the shards:
This may be problematic, especially when dealing with a large number of queries and a large number of shards together. In such cases Solr will have to aggregate results from the large number of shards, which can take time and be performance expensive. In these situations routing may be the best solution, so let’s see what that brings us. Continue reading “SolrCloud: Dealing with Large Tenants and Routing”