Video and Slides: Running High Performance and Fault Tolerant Elasticsearch Clusters on Docker

Running Elasticsearch clusters on Docker? Thinking about it?  If “yes” then we’ve got a presentation for you that digs deep into the details.

(Note: we’ve also got a related blog post about monitoring the official Elasticsearch image on Docker that you might find useful)

Coming to you from the recent DevOps Days event in Warsaw and delivered by Sematext engineer Rafal Kuć, “Running High Performance and Fault Tolerant Elasticsearch Clusters on Docker” is chock full of practical information that will no doubt answer many of the questions you might have about this process.

Presentation Topics

Some of the topics Rafal covers include:

  • Containers vs. Virtual Machines
  • Running the official Elasticsearch container
  • Container constraints
  • Good network practices
  • Dealing with storage
  • Data-only Docker volumes
  • Scaling, time-based data
  • Multiple tiers and tenants
  • Indexing with and without routing
  • Querying with and without routing
  • Routing vs. no routing
  • Monitoring

Here’s a Taste of What You’ll See

How do Containers stack up versus Virtual Machines? There are a lot of elements at play…

DevOps_Warsaw_preso

Elasticsearch “One-stop Shop”

Sematext is your “one-stop shop” for all things Elasticsearch: Expert Consulting, Production Support, Elasticsearch Training, and Elasticsearch Monitoring with SPM.

Docker Monitoring

Speaking of monitoring…SPM does both Docker monitoring in a sweet little container and Elasticsearch monitoring (and provides alerting and anomaly detection, too), along with many other integrations that DevOps folks find useful.

Enjoy!

Using Filebeat to Send Elasticsearch Logs to Logsene

One of the nice things about our log management and analytics solution Logsene is that you can talk to it using various log shippers.  You can use Logstash, or you can use syslog protocol capable tools like rsyslog, or you can just push your logs using the Elasticsearch API just like you would to send data to a local Elasticsearch cluster. And like any good DevOps team, we like to play with all the tools ourselves.  So we thought the timing was right to make Logsene work as a final destination for data sent using Filebeat.

With that in mind, let’s see how to use Filebeat to send log files to Logsene.  In this post we’ll ship Elasticsearch logs, but Filebeat can tail and ship logs from any log file, of course.

Continue reading “Using Filebeat to Send Elasticsearch Logs to Logsene”

PagerDuty and Logsene Integration

Great news for for those of us who use PagerDuty and manage — or are considering managing — logs with Logsene: PagerDuty and Logsene are now integrated!

This integration is a huge time- and aggravation-saver for DevOps professionals who wouldn’t mind dramatically reducing the frequent “noise” from log-generated monitoring alarms.

In case you’re not familiar, Logsene is an enterprise-class log management solution. Logsene can receive logs from a wide array of logs shippers, such as Fluentd, Logstash, and Syslog, and supports many logging frameworks for programming languages such as: Java, Scala, Go, Node.js, Ruby, Python, .Net, Perl, and more.  Among other capabilities, Logsene exposes the Elasticsearch API, works with Kibana and with Grafana (video), and has built-in alerts and anomaly detection.  It is available both in the Cloud (SaaS) and On Premises.

Logsene also integrates with SPM Performance Monitoring to correlate metrics, events, and logs in a single UI (check out Integrate PagerDuty with SPM Performance Monitoring for those instructions, which are very similar to what you will see here).

In PagerDuty:

Create a new service:

1) In your account, go to Services click +Add New Service

2) Enter in a name for your new service

3) Start typing “Sematext” for the Integration Type, which will narrow your filtering

PagerDuty_image

4) Select an escalation policy. Then, adjust the incident settings to your liking, then click Add Service.

5) Once the service is created, you’ll be taken to the service page. On this page, you’ll see the Service Integration Key​, which you will need when you configure Sematext products to send events to PagerDuty. Copy the Service Integration Key to the clipboard.

PagerDuty_2

In Logsene

1) Navigate to App Actions of your Logsene App by clicking the App Settings menu item.

PagerDuty_3

2) Navigate to Alerts / PagerDuty

3) Enter the API key from PagerDuty in the field Service API key.

4) Press Save

PagerDuty_4

5) To enable PagerDuty Notifications, navigate to Alerts /Notification Transports

6) Select PagerDuty

PagerDuty_5

Done. Every alert from your Logsene app will be forwarded to PagerDuty, where you can manage escalation policies and configure notifications to other services like HipChat, Slack, Zapier, Flowdock, and more.

Like what you saw here? To integrate PagerDuty with Logsene just get a free account here!  And drop us an email or hit us on Twitter with suggestions, questions or comments.

Docker Swarm: Collecting Metrics, Events & Logs

Docker Swarm is a cluster manager for Docker.  When accessed via the Docker API by Docker API Clients or Docker command line tools, a Docker Swarm cluster looks just like a single Docker Host.  Docker Swarm distributes containers to multiple nodes using various deployment strategies in the cluster scheduler.

Having in mind that a Swarm cluster looks like a single Docker Host from the API point of view, it should be very easy to monitor Docker Swarm with existing Docker monitoring tools!  Connecting a monitoring agent to the Swarm Master API endpoint should do the job, right? The Sematext Docker Agent could simply collect all container metrics, events and all logs from the Swarm Master – should be a piece of cake. Hm, but could there a gotcha?  It turns out there is more than one:

  • If we deploy a single monitoring agent to the master node, it would miss host metrics for all other nodes because the Docker API doesn’t provide any host metrics. We could also not see how much memory, disk space or CPU the Docker Swarm node itself consumes. Solution: deploy the monitoring agents to each node for collecting the metrics locally.
  • Assuming a larger cluster with a high volume of logs, events and metrics to collect, a single monitoring agent connected to the the master node would need to handle all operational data of the cluster.  This would work for a small cluster but such an architecture would obviously be destined for failure on larger clusters.  Guess what the solution is? It’s much better having an agent running on each node and distributing the monitoring and logging work over all nodes. If you do it right from the beginning, there is no need to change the deployment strategy later, when the cluster scales out.
DockerSwarmMonitoring
Monitoring container running on each Docker node

In the following example we assume that the master and agent nodes have the UNIX socket enabled in Docker daemon settings. This can be achieved by using –engine-env ‘DOCKER_OPTS=”-H unix:///var/run/docker.sock”‘ in the docker-machine create command. Use this Github Gist to create a Docker-Swarm Cluster with with enabled UNIX sockets. Later, we will see this helps simplify the deployment of any tool that needs to connect to the local Docker daemon – including monitoring and logging containers.

Let’s see how to deploy Sematext Agent to each node in a Docker Swarm Cluster with UNIX socket enabled in Docker-Daemon as just described.

When we started to work on Swarm Monitoring our first question was “Does Docker Swarm provide a deployment strategy for running exactly one instance of a service on each node?” We checked the documentation, but no dice.  We found strategies like “spread, binpack, and random” (see https://docs.docker.com/swarm/scheduler/strategy/), but none of them would guarantee exactly one instance of a service on each node. The “spread” strategy spreads the containers evenly over all hosts. The “binpack” strategy fills up one node after another with containers, while “random” spreads containers randomly to nodes. There was seemingly no strategy suitable for monitoring services running only once on each node.

So how can we distribute the monitoring container to each host using Docker Swarm instead of bash script iterating over all nodes?  It turns out it’s possible to define an affinity to ensure that containers that should run on the same host are scheduled together. In our case we use “anti-affinity” in the deployment strategy, which instructs Swarm not to deploy the container with Sematext Agent to hosts that already have that container running. In other words, it tells Docker Swarm to run no more than one Sematext Agent container on each Docker host.  To do that we define a docker-compose.yml file with the “anti-affinity” specified in the container environment section:

sematext-agent:
  image: 'sematext/sematext-agent-docker:latest'
  environment:
    - LOGSENE_TOKEN=3b549a2c-653a-4832-xxx
    - SPM_TOKEN=fe31fc3a-4660-47c6-xxx
    - affinity:container!=sematext-agent* 
  privileged: true
  restart: always
  volumes:
    - '/var/run/docker.sock:/var/run/docker.sock'

Finally, we use the docker-compose command to scale out the Sematext Docker Agent and deploy it to all Swarm cluster nodes.  To do that we run:

eval $(docker-machine env swarm-master --swarm)
docker-compose up -d 
# scale is == num nodes
docker-compose scale sematext-agent=$(docker-machine ls | grep swarm | grep Running | wc -l)

After running the above commands, Sematext Docker Agent will be running on each node and within a minute you will receive Host and Container Metrics for all containers, all their Logs and all Docker events from all nodes in your Docker Swarm cluster.  Complete visibility!

Bildschirmfoto 2016-01-12 um 15.36.01
Aggregated Metrics from all Docker Swarm nodes 

Please note there are many ways to create a Swarm cluster and you might have another setup, such as:

  • TLS secured Docker daemon and no possibility to activate the unix socket: In this situation you have to deal with the existing Docker daemon setup, which typically uses TLS and authentication via certificates (for example, if you followed Docker’s instructions to create Swarm clusters using Docker-Machine). When the Docker socket is secured with TLS, each client – including Sematext Docker Agent – needs the certificates for authentication. This involves a bunch of parameters such as “DOCKER_HOST”, “DOCKER_CERT_PATH”, “DOCKER_TLS_VERIFY” and mounting of the certificate into the container. In addition we should know to which Docker daemon the agent should be connected (typically port 2375 for TCP, 2376 for TLS on each node and port 3376 on Swarm Master nodes for the Swarm API). We made this scenario easy with a deployment script for the Sematext Agent with TLS options provided by Docker-Machine.
  • You use CoreOS to run Docker Swarm: In this case you could use fleet and systemd to distribute the agent to each node (simply install Sematext Agent with these instructions)

The deployment methods above should work for other monitoring tools or logging containers as well because most of such tools need to run on each node to collect the metrics locally.

If you have questions or special needs for monitoring more complex setups feel free to contact us. The Sematext Docker Agent is a turnkey-solution for Docker Logs, Metrics and Events – sign up here and give it a try (30-days free trial, no credit card needed).

Introducing NetMaps

New Year, New Feature in SPM!  We are happy to announce the immediate availability of NetMaps in SPM!  Check out why they are useful or watch the short video below.

Ever wondered how different components of distributed apps are actually connected over the network? When it comes to troubleshooting of distributed application stacks like Apache Kafka, Spark, Hadoop, Cassandra,  Solr, or Elasticsearch — not to mention Microservice architectures or Docker Containers — information about the deployed infrastructure becomes critical. That architecture diagram you drew N months ago?  It’s probably out of date.  Apps we run today are often very dynamic. Instances, nodes, and containers come and go, whether because of elastic up/down scaling or other reasons.

Discovering This Dynamic Infrastructure

Watching the actual network traffic on all nodes could quickly answer many questions for DevOps engineers doing troubleshooting or planning setup changes. For example:

  • Which nodes are online and active?
  • How nodes are connected to other nodes?
  • What are the dependencies between network services?
  • What is the consumed bandwidth between nodes?
  • Which applications run on a specific network node?

Visualize Network Connections

Designed to visualize network connections and answer the above questions instantly, NetMaps also include:

  • Automatic Discovery of network nodes and applications
  • Filtering by application and host name
  • Automatic Visualizations as Network Map and Chord Diagrams
  • Interactive Explorer for following network links for each application node
  • Bandwidth consumption for all incoming and outgoing network connections
  • Navigation from the NetMap to all nodes and related performance metrics of the monitored App

The best practice is to activate network monitoring on all application server nodes, which communicate with databases, message brokers, search engines etc. in that way it is easy to see how client applications communicate with backend servers.

NetMap “Map” View

NetMap_map

NetMap “Chord” View

NetMap_chord

It is very easy to activate Network Monitoring in SPM Client, a collector for Host and Application Metrics. Intelligent network filters ensure that the resource usage for the network monitoring stays low while capturing all relevant packets to explore your infrastructure using the “NetMap” Tab in SPM. If you find network maps interesting, you might also be interested in SPM’s AppMap feature for JVM applications to discover relationships between monitored JVM applications such as Elasticsearch, Solr, Cassandra, Spark or Kafka, …

We hope you like this new addition to SPM.  Got ideas how we could make it more useful for you?  Let us know via comments, email or @sematext.

Not using SPM yet? Check out the free 30-day SPM trial by registering here.  There’s no commitment and no credit card required.

How to forward CloudTrail (or other logs from AWS S3) to Logsene

This recipe shows how to send CloudTrail logs (which are .gz logs that AWS puts in a certain S3 bucket) to a Logsene application, but should apply to any kinds of logs that you put into S3. We’ll use AWS Lambda for this, but you don’t have to write the code. We’ve got that covered.

The main steps are:
0. Have some logs in an AWS S3 bucket 🙂
1. Create a new AWS Lambda function
2. Paste the code from this repository and fill in your Logsene Application Token
3. Point the function to your S3 bucket and give it permissions
4. Decide on the maximum memory to allocate for the function and the timeout for its execution
5. Explore your logs in Logsene 🙂

Continue reading “How to forward CloudTrail (or other logs from AWS S3) to Logsene”

2015 in Review

Another year is behind us, and it’s been another good year for us at Sematext.  Here are the highlights in the chronological order.  If you prefer looking non-chronological overview, look further below.

January

We started the year by doing a ton of publishing on the blog – about Solr-Redis, about SPM and Slack, about Solr vs. Elasticsearch – always a popular topic, Spark, Kafka, Cassandra, Solr, etc.  Logsene being ELK as a Service means we made sure users have the freedom and flexibility to create custom Elasticsearch Index Templates in Logsene.

February

We added Account Sharing to all our products, thus making it easier to share SPM, Logsene, and Site Search Analytics apps by teams.  We made a big contribution to Kafka 0.8.2 by reworking pretty much all Kafka metrics and making them much more useful and consumable by Kafka monitoring agents.  We also added support for HAProxy monitoring to SPM.

March

We announced Node.js / io.js monitoring.  This was a release of our first Node.js-based monitoring monitoring agent – spm-agent-nodejs, and our first open-source agent.  The development of this agent resulted in creation of spm-agent an extensible framework for Node.js-based monitoring agents.  HBase is one of those systems with tons of metrics and with metrics that change a lot from release to release, so we updated our HBase monitoring support for HBase 0.98.

April

The SPM REST API was announced in April, and a couple of weeks later the spm-metrics-js npm module for sending custom metrics from Node.js apps to SPM was released on Github.

May

A number of us from several different countries gathered in Krakow in May.  The excuse was to give a talk about Tuning Elasticsearch Indexing Pipeline for Logs at GeeCon and give away our eBook – Log Management & Analytics – A Quick Guide to Logging Basics while sponsoring GeeCon, but in reality it was really more about Żubrówka and Vișinată, it turned out.  Sematext grew a little in May with 3 engineers from 3 countries joining us in a span of a couple of weeks.  We were only dozen people before that, so this was decent growth for us.

Right after Krakow some of us went to Berlin to give another talk: Solr and Elasticsearch – Side by Side with Elasticsearch and Solr: Performance and Scalability.  While in Berlin we held our first public Elasticsearch training and, following that, quickly hopped over to Hamburg to give a talk at a local search meetup.

June

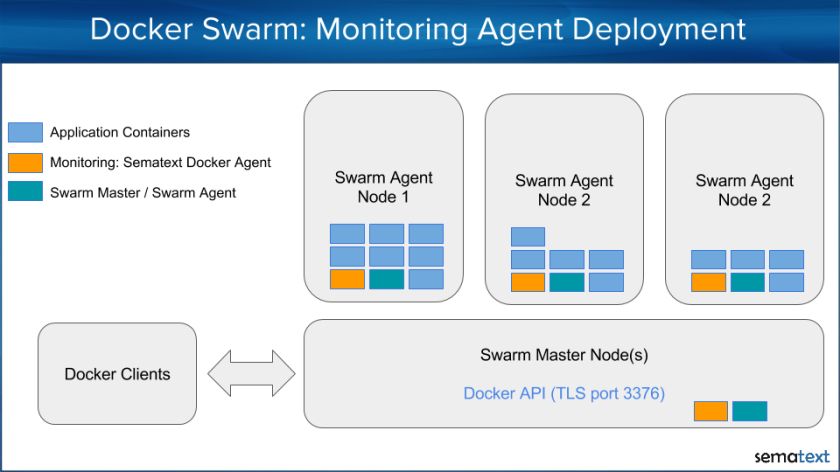
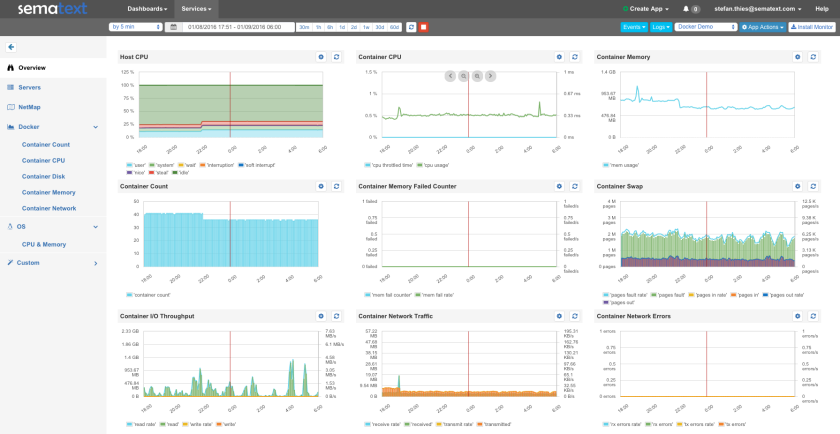
In June we gave a talk on the other side of the Atlantic – in NYC – Beyond POC: Processing Metrics, Logs and Traces … at Scale.  We were conference sponsors there as well and took part in the panel about microservices.  We published our second eBook – Elasticsearch Monitoring Essentials eBook.  The two most important June happenings were the announcement of Docker monitoring – SPM for Docker – our solution for monitoring Docker containers, as well as complete, seamless integration of Kibana 4 into Logsene.  We’ve added Servers View to SPM and Logsene got much needed Alerting and Anomaly Detection, as well as Saved Searches and Scheduled Reporting.

July

In July we announced public Solr and Elasticsearch trainings, both in New York City, scheduled for October.  We built and open-sourced Logsene Command Line Interfacelogsene-cli – and we added Tomcat monitoring integration to SPM.

August

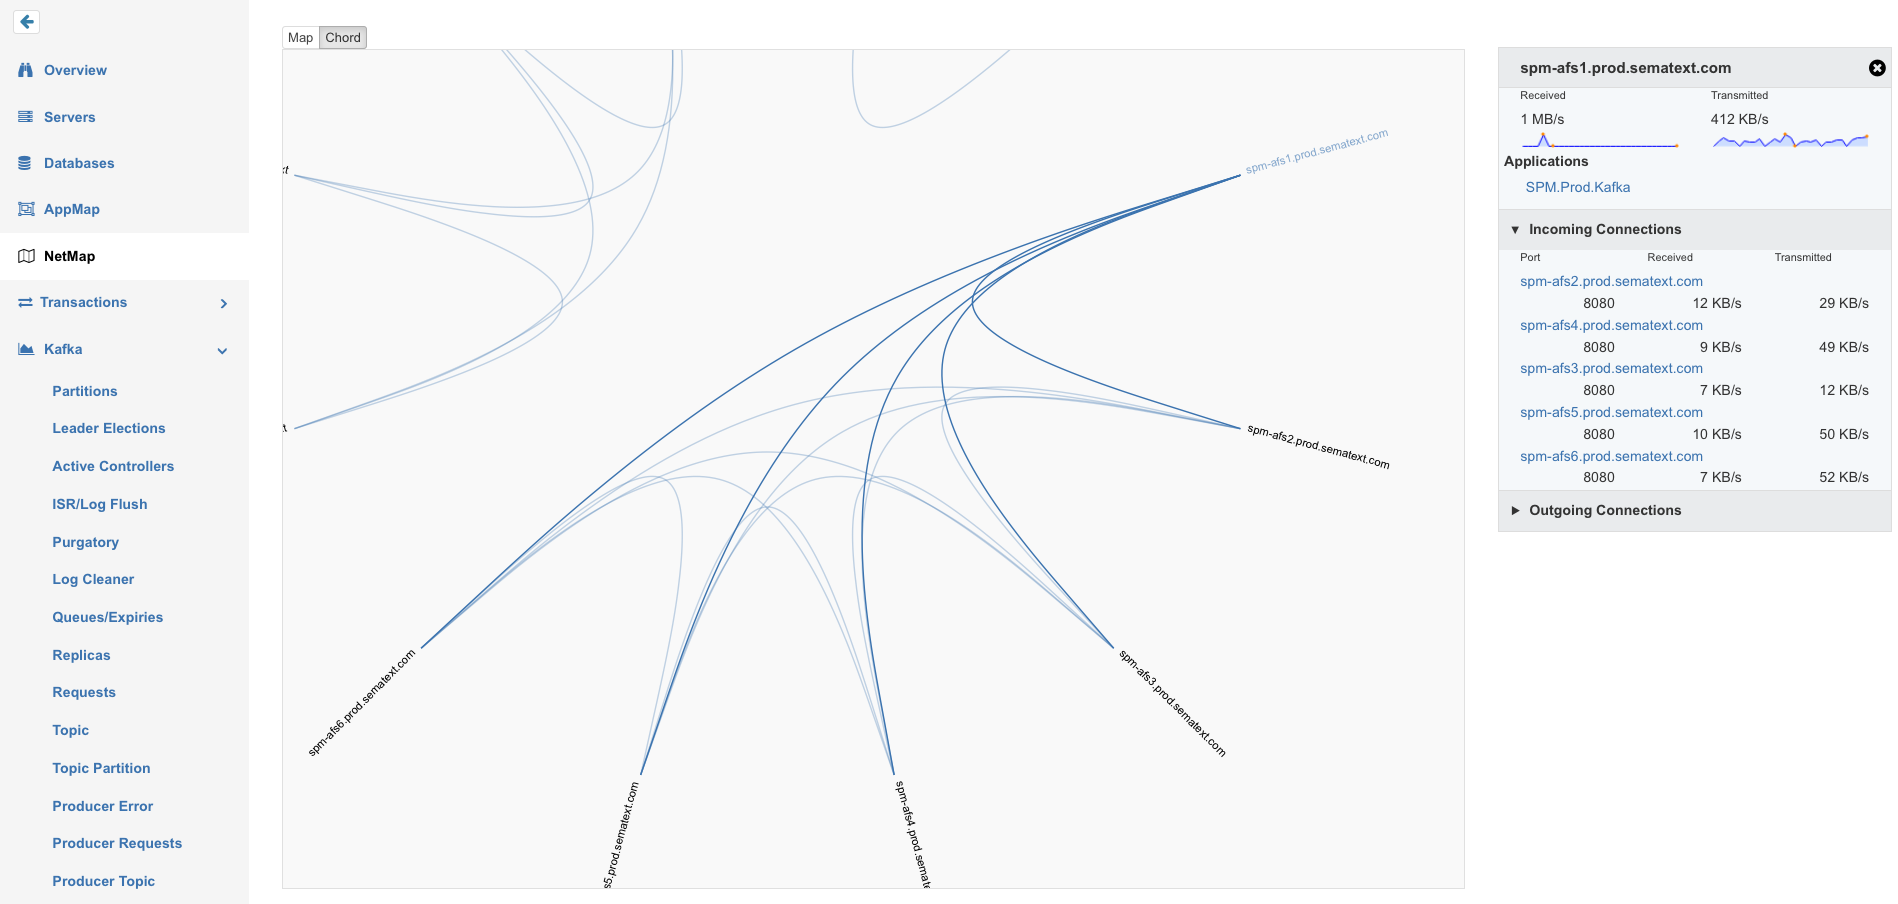
At Sematext we use Akka, among other things, and in August we introduced Akka monitoring integration for SPM and open-sourced the Kamon backend for SPM.  We also worked on and announced Transaction Tracing that lets you easily find slow transactions and bottlenecks that caused their slowness, along with AppMaps, which are a wonderful way to visualize all your infrastructure along applications running on it and see, in real-time, which apps and servers are communicating, how much, how often there are errors in each app, and so on.

September

In September we held our first 2 webinars on Docker Monitoring and Docker Logging.  You can watch them both in Sematext’s YouTube channel.

October

We presented From zero to production hero: Log Analysis with Elasticsearch at O’Reilly’s Velocity conference in New York and then Large Scale Log Analytics with Solr at Lucene/Solr Revolution in Austin.  After Texas we came back to New York for our Solr and Elasticsearch trainings.

November

Logsene users got Live Tail in November, while SPM users welcomed the new Top Database Operations report.  Live Tail comes in very handy when you want to semi-passively watch out for errors (or other types of logs) without having to constantly search for them.  While most SPM users have SPM monitoring agents on their various backend components, Top Database Operations gives them the ability to gain more insight in performance between the front-end/web applications and backend servers like Solr, Elasticsearch, or other databases by putting the monitoring agents on applications that act as clients for those backend services.  We worked with O’Reilly and produced a 3-hour Working with Elasticsearch Training Video.

December

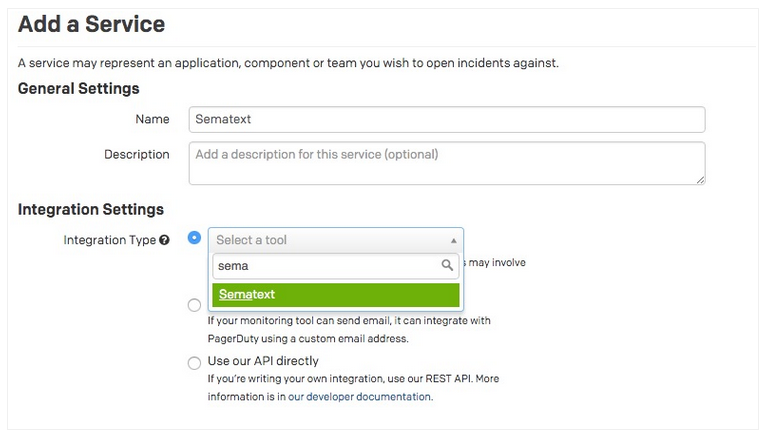
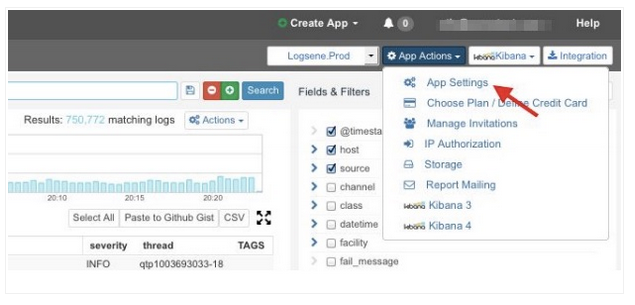
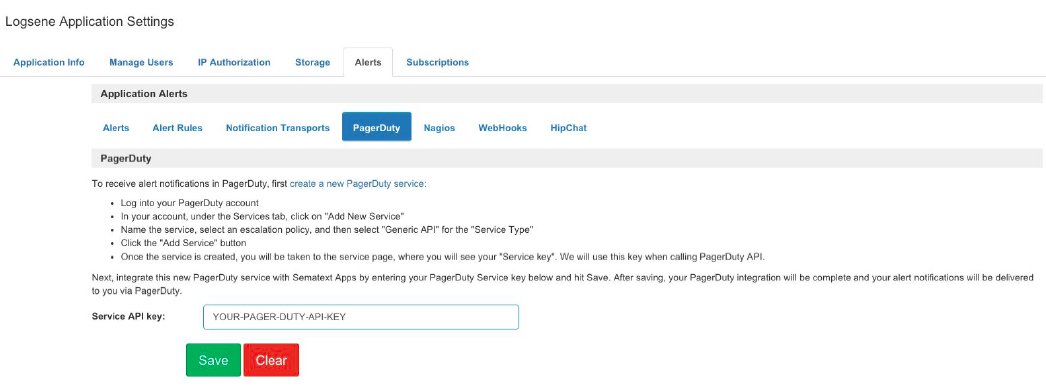
We finished off 2015 by adding MongoDB monitoring to SPM, joining Docker’s ETP Program for Logging, further integrating monitoring and logging, ensuring Logsene works with Grafana, writing about monitoring Solr on Docker, publishing the popular Top 10 Node.js Metrics to Watch, as well as a SPM vs. New Relic APM comparison.  

Pivoting the above and grouping it by our products and services:

Logsene:

  • Live Tail
  • Alerting
  • Anomaly Detection
  • logsene-cli + logsene.js + logagent-js
  • Saved Searches
  • Scheduled Email Reporting
  • Integrated Kibana
  • Compatibility with Grafana
  • Search AutoComplete
  • Powerful click-and-filter
  • Native charting of numerical fields
  • Account Sharing
  • REST API


SPM:

  • Transaction Tracing
  • SPM Tracing API
  • AppMap
  • NetMap
  • On Demand Profiling
  • Integration with Logsene
  • Expanded monitoring for Elasticsearch, Solr, HBase, and Kafka
  • Added monitoring for Docker, Node.js, Akka, MongoDB, HAProxy, and Tomcat
  • Birds Eye Servers View
  • Account Sharing
  • REST API


Webinars:

  • Docker Monitoring
  • Docker Logging


Trainings:

  • Elasticsearch training in Berlin
  • Solr and Elasticsearch trainings in New York


eBooks:

  • Elasticsearch Monitoring Essentials
  • Log Management & Analytics – A Quick Guide to Logging Basics


Talks / Presentations / Conferences:

  • Lucene/Solr Revolution, Austin, TX – Large Scale Log Analytics with Solr
  • Velocity Conference, NYC, NY – Log Analysis with Elasticsearch
  • Berlin Buzzwords, Berlin, Germany – Side by Side with Elasticsearch and Solr: Performance and Scalability
  • GeeCon, Krakow, Poland – Tuning Elasticsearch Indexing Pipeline for Logs
  • DevOps Days, Warsaw, Poland – Running High Performance and Fault Tolerant Elasticsearch Clusters on Docker
  • DevOps Expo, NYC, NY – Process Metrics, Logs, and Traces at Scale


Trends:

All numbers are up  – our SPM and Logsene signups are up, product revenue is up a few hundred percent from last year, we’ve nearly doubled our blogging volume, our site traffic is up,we’ve made several UI-level facelifts for both apps.sematext.com and www.sematext.com, our team has grown, we’ve increased the number of our Solr and Elasticsearch Production Support customers, and we’ve added Solr and Elasticsearch Training to the list of our professional services.