Poll Results: Log Shipping Formats

The results for the log shipping formats poll are in.  Thanks to everyone who took the time to vote!

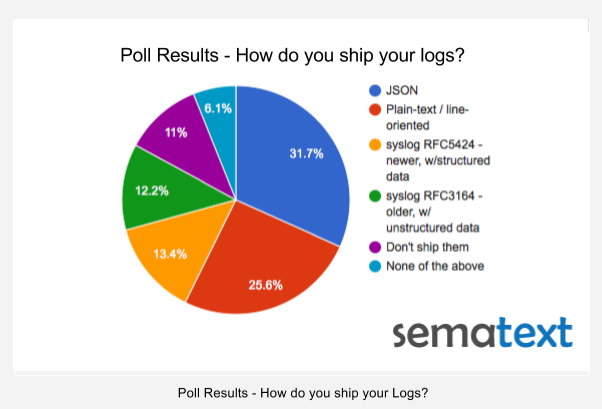
The distribution pie chart is below, but we can summarize it for you here:

  • JSON won pretty handily with 31.7% of votes, which was not totally unexpected. If anything, we expected to see more people shipping logs in JSON.  One person pointed out GELF, but GELF is really just specific JSON structure over Syslog/HTTP, so GELF falls in this JSON bucket, too.
  • Plain-text / line-oriented log shipping is still popular, clocking in with 25.6% of votes.  It would be interesting to see how that will change in the next year or two.  Any guesses?  For those who are using Logstash for shipping line-oriented logs, but have to deal with occasional multi-line log events, such as exception stack traces, we’ve blogged about how to ship multi-line logs with Logstash.
  • Syslog RFC5424 (the newer one, with structured data in it) barely edged out its older brother, RFC3164 (unstructured data).  Did this surprise anyone?  Maybe people don’t care for structured logs as much as one might think?  Well, structure is important, as we’ll show later today in our Docker Logging webinar because without it you’re limited to mostly “supergrepping” your logs, not really getting insight based on more analytical type of queries on your logs.  That said, the two syslog formats together add up to 25%!  Talk about ancient specs holding their ground against newcomers!
  • There are still some of people out there who aren’t shipping logs! That’s a bit scary! 🙂 Fortunately, there are lot of options available today, from the expensive On Premises Splunk or DIY ELK Stack, to the awesome Logsene, which is sort of like ELK Stack on steroids.  Look at log shipping info to see just how easy it is to get your logs off of your local disks, so you can stop grepping them.  If you can’t live without the console, you can always use logsene-cli!

Log_shipper_poll_4

Similarly, if your organization falls in the “Don’t ship them” camp (and maybe even “None of the above” as well, depending on what you are or are not doing) then — if you haven’t done so already — you should give some thought to trying a centralized logging service, whether running within your organization or a logging SaaS like Logsene, or at least DIY ELK.
SolrCloud: Dealing with Large Tenants and Routing

Many Solr users need to handle multi-tenant data. There are different techniques that deal with this situation: some good, some not-so-good. Using routing to handle such data is one of the solutions, and it allows one to efficiently divide the clients and put them into dedicated shards while still using all the goodness of SolrCloud. In this blog post I will show you how to deal with some of the problems that come up with this solution: the different number of documents in shards and the uneven load.

Imagine that your Solr instance indexes your clients’ data. It’s a good bet that not every client has the same amount of data, as there are smaller and larger clients. Because of this it is not easy to find the perfect solution that will work for everyone. However, I can tell one you thing: it is usually best to avoid per/tenant collection creation. Having hundreds or thousands of collections inside a single SolrCloud cluster will most likely cause maintenance headaches and can stress the SolrCloud and ZooKeeper nodes that work together. Let’s assume that we would rather go to the other side of the fence and use a single large collection with many shards for all the data we have.

No Routing At All

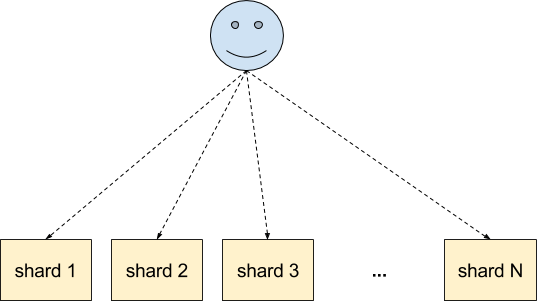
The simplest solution that we can go for is no routing at all. In such cases the data that we index will likely end up in all the shards, so the indexing load will be evenly spread across the cluster:

Multitenancy - no routing (index)

However, when having a large number of shards the queries end up hitting all the shards:

Multitenancy - no routing

This may be problematic, especially when dealing with a large number of queries and a large number of shards together. In such cases Solr will have to aggregate results from the large number of shards, which can take time and be performance expensive. In these situations routing may be the best solution, so let’s see what that brings us. Continue reading “SolrCloud: Dealing with Large Tenants and Routing”

Recipe: rsyslog + Redis + Logstash

OK, so you want to hook up rsyslog with Logstash. If you don’t remember why you want that, let me give you a few hints:

  • Logstash can do lots of things, it’s easy to set up but tends to be too heavy to put on every server
  • you have Redis already installed so you can use it as a centralized queue. If you don’t have it yet, it’s worth a try because it’s very light for this kind of workload.
  • you have rsyslog on pretty much all your Linux boxes. It’s light and surprisingly capable, so why not make it push to Redis in order to hook it up with Logstash?

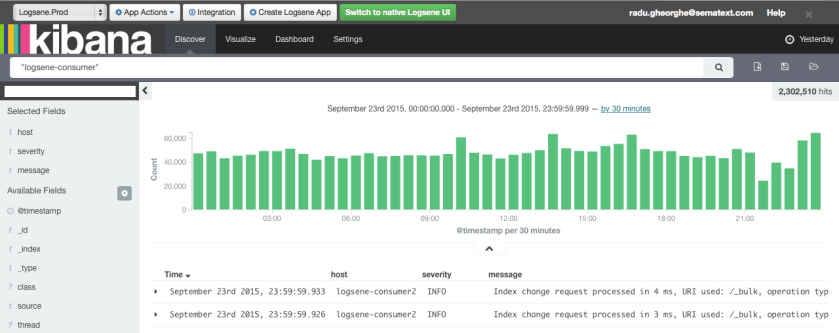
In this post, you’ll see how to install and configure the needed components so you can send your local syslog (or tail files with rsyslog) to be buffered in Redis so you can use Logstash to ship them to Elasticsearch, a logging SaaS like Logsene (which exposes the Elasticsearch API for both indexing and searching) so you can search and analyze them with Kibana:

Kibana_search

Continue reading “Recipe: rsyslog + Redis + Logstash”

Poll: How do you ship your Logs?

Recently, a few people from Sematext’s Logsene team debated about how useful the “structured” part of syslog logs (those using the RFC5424 format) is to people.  Or has shipping logs in other structured formats, like JSON, made RFC5424 irrelevant to most people?  Here is a quick poll to help us all get some insight into that.

NOTE: the question is not what your logs looks like initially when they are generated, but about what structure they have when you ship them to a centralized logging service, whether running within your organization or a logging SaaS like Logsene.

If you choose “None of the above” please do leave a comment to help spread knowledge about alternatives.


Docker Monitoring Webinar on October 6

[ Note: Click here for the Docker Monitoring webinar video recording and slides. And click here for the Docker Logging webinar video recording and slides. ]

——-

Good news for Docker fans: we’re running a third Docker Monitoring webinar on Tuesday, October 6 at 2:00 pm Eastern Time / 11:00 am Pacific Time.

If you use Docker you know that these deployments can be very dynamic, not to mention all the ways there are to monitor Docker containers, collect logs from them, etc. etc.  And if you didn’t know these things, well, you’ve come to the right place!

Sematext has been on the forefront of Docker monitoring, along with Docker event collection, charting, and correlation.  The same goes for CoreOS monitoring and CoreOS centralized log management.  So it’s only natural that we’d like to share our experiences and how-to knowledge with the growing Docker and container community.  During the webinar we’ll go through a number of different Docker monitoring options, point out their pros and cons, and offer solutions for Docker monitoring.

The webinar will be presented by Stefan Thies, our DevOps Evangelist, deeply involved in Sematext’s activities around monitoring and logging in Docker and CoreOS.  A post-webinar Q&A will take place — in addition to the encouraged attendee interaction during the webinar.

Date/Time

Tuesday, October 6 @ 2:00 pm to 3:00 pm Eastern Time / 11:00 am to 12:00 pm Pacific Time.

Register_Now_2

“Show, Don’t Tell”

The infographic below will give you a good idea of what Stefan will be showing and discussing in the webinar.

Docker_webinar_infographic

Got Questions, or topics you’d like Stefan to address?

Leave a comment, ping @sematext or send us an email — we’ll all ears.

Whether you’re using Docker or not, we hope you join us for the webinar.  Docker is hot — let us help you take advantage of it!

Top 10 Elasticsearch Mistakes

Top_10_ES_Mistakes_________________________________________________________________________

  1. Upgrading to the new major version right after its release without waiting for the inevitable .1 release
  2. Remembering that you said, “We don’t need backups, we have shard replicas” to your manager during an 8-hour cluster recovery session
  3. Not running dedicated masters and wondering why your whole cluster becomes unresponsive during high load
  4. In a room full of Elasticsearch fans suggest that Elasticsearch should use ZooKeeper like SolrCloud and avoid split-brain
  5. Running a single master and wondering why it takes the whole cluster down with it
  6. Running a significant terms aggregation on an analyzed field and wondering where all the memory/heap went
  7. Not using G1 GC with large heaps because Robert Muir claims G1 and Lucene/Elasticsearch don’t get along (just kidding, Robert!)
  8. Giving Elasticsearch JVM 32 GB heap and thinking you’re so clever ‘cause you’re still using CompressedOops. Tip: you ain’t
  9. Restarting multiple nodes too fast without waiting for the cluster to go green between node restarts
  10. …and last but not least: not taking Sematext Elasticsearch guru @radu0gheorghe’s upcoming Elasticsearch / ELK Stack Training course in October in NYC!  [Note: since this workshop has already taken place, stay up to date with future workshops at our Elasticsearch training page]