How to Add Performance Monitoring to Node.js Applications

[Updated: Instructions for Node.js 4.x / 5.x]

spm-node-io

We have been using Node.js here at Sematext and, since eating one’s own dogfood is healthy, we wanted to be able to monitor our Node.js apps with SPM (we are in performance monitoring and big data biz). So, the first thing to do in such a case is to add monitoring capabilities for technology we use in-house (like we did for Java, Solr, Elasticsearch, Kafka, HBase, NGINX, and others).  For example we monitor Kibana4 servers (based on Node.js), which we have in production for our “1-click ELK stack”.

You may have seen our post about SPM for Node.js  —  but I thought I’d share a bit about how we monitor Node.js to help others with the same DevOps challenges when introducing new Node.js apps, or even the additional challenge of operating large deployments with a mix of technologies in the application stack:

1) Install the monitoring agent
npm i spm-agent-nodejs
It’s open-sourced on Github: sematext/spm-agent-nodejs

2) add a new SPM App for Node.js — each monitored App is identified by its App-Token (and yes — there is an API to automate this step)

3) set the Environment variable for the application token

export SPM_TOKEN=YOUR_TOKEN

4) add one line to the beginning of your source code when using Node 0.12 – Node 4.x / 5.x got a better option/see below …

var spmAgent = require ('spm-agent-nodejs')

5) Run your app and after 60 seconds you should start seeing node.js metrics in SPM

At this point what do I get? I can see pre-defined metric charts like these, with about 5 minutes of work 🙂

nodejs-monitoring-overview

I saved time already —there’s  no need to define metric queries/widgets/dashboards

Now I can set up alerts on Latency or Garbage Collection, or I can have anomaly detection tell me when the number of Workers in a dynamic queue changes drastically. I typically set ‘Algolerts’ (basically machine learning-based anomaly detection) to get notified (e.g. via PagerDuty) when a service suddenly slows down because  they produce less noise than regular threshold alerts. In addition, I recommend adding Heartbeat alerts for each monitored service to be notified of any server outages or network problems. In our case, where a Node.js app runs tasks on Elasticsearch, it makes sense to create a custom dashboard to see Elasticsearch and Node.js metrics together (see 2nd screenshot above) — of course, this is applicable for other applications in the stack like NGINX, Redis or HAProxy — and can be combined with Docker container metrics

nodejs_2

In fact, you can use the application token for multiple servers  to see how your cluster behaves using the “birds eye view” (a kind of top + df to show the health of all your servers)

Now, let’s have a look at how the procedure differs when using Node 4.x or Node 5.x

Node 4.x/5.x Supports Preloading Modules

When we use the new node.js preload command-line option, we can add instrumentaion without adding the require statement for ‘spm-agent-nodejs’ to the source code:

That’s why Step 4) could be done even better with  node 4.x/5.x:

node -r spm-agent-nodejs yourApp.js

This is just a little feature but it shows how the node.js community is listening to the needs of users and is able to release such things quickly.

If you want to try node 4.x/5.x, here is how to install it using n:

npm i n -g 
n lts      # for node 4.x or 
n stable   # for node 5.x

The ‘node’ executable is now linked to the new node version 4.x/5.x  — to switch back to node 0.12 simply use

n 0.12 

I hope this helps.  If you’d like to see some Node.js metrics that are currently not being captured by SPM then please hit me on Twitter — @seti321 — or drop me an email.  Or, even better, simply open an issue here: https://github.com/sematext/spm-agent-nodejs/   Enjoy!

Centralized Log Management and Monitoring for CoreOS Clusters

 Note: Click here for the Docker Monitoring webinar video recording and slides. And click here for the Docker Logging webinar video recording and slides.

SPM Agent for Docker was renamed  “sematext/sematext-agent-docker” on Docker Hub (see Sematext joins Docker ETP program for Logging).  The latest CoreOS service files and instructions are available in the new Github Repository.

——-

If you’ve got an interest in things like CoreOS, logs and monitoring then you should check out our previous CoreOS-related posts on Monitoring Core OS Clusters and how to get CoreOS logs into ELK in 5 minutes.  And they are only the start of SPM integrations with CoreOS!  Case in point: we have recently optimized the SPM setup on CoreOS and integrated a logging gateway to Logsene into the SPM Agent for Docker.  And that’s not all…

In this post we want to share the current state of CoreOS Monitoring and Log Management from Sematext so you know what’s coming — and you know about things that might be helpful for your organization, such as:

  1. Feature Overview
  2. Fleet Units for SPM
  3. How to Set Up Monitoring and Logging Services

1. Feature Overview

  • Quick setup
    • add monitoring and logging for the whole cluster in 5 minutes
  • Collection Performance Metrics for the CoreOS Cluster
    • Metrics for all CoreOS cluster nodes (hosts)
      • CPU, Memory, Disk usage
    • Detailed metrics for all containers on each host
      • CPU, Memory, Limits, Failures, Network and Disk I/O, …
    • Anomaly detection and alerts for all metrics
    • Anomaly detection and alerts for all logs
  • Correlated Container Events, Metrics and Logs
    • Docker Events like start/stop/destroy are related to deployments, maintenance or sometimes to errors and unwanted restarts;  correlation of metrics, events and logs is the natural way to discover problems using SPM.

Docker Events

  • Centralized configuration via etcd
    • There is often a mix of configurations in environment variables, static settings in cloud configuration files, and combinations of confd and etcd. We decided to have all settings stored in etcd, so the settings are done only once and are easy to access.
  • Automatic Log Collection
    • Logging gateway Integrated into SPM Agent
      • SPM Agent for Docker includes a logging gateway service to receive log message via TCP.  The service discovery is solved via etcd (where the exposed TCP is stored). All received messages are parsed, and the following formats are supported:
        • journalctl -o short | short-iso | json
        • integrated messages parser (e.g. for dockerd time, level and message text)
        • line delimited JSON
        • plain text messages
        • In cases where the parsing fails, the gateway adds a timestamp and keeps the message 1:1.
      • The logging gateway can be configured with the Logsene App Token – this makes it compatible with most Unix tools e.g. journalctl -o json -n 10 | netcat localhost 9000
      • SPM for Docker collects all logs from containers directly from the Docker API. The logging gateway is typically used for system logs – or anything else configured in journald (see “Log forwarding service” below)
      • The transmission to Logsene receivers is encrypted via HTTPS.
    • Log forwarding service
      • The log forwarding service streams logs to the logging gateway by pulling them from journald. In addition, it saves the ‘last log time’ to recover after a service restart. Most people take this for granted; but not all logging services have such a recovery function.  There are many tools which just capture the current log stream. Often people realize this only when they miss logs one day because of a reboot, network outage, software update, etc.  But these are exactly the types of situations where you would like to know what is going on!
SPM integrations into CoreOS

2. Fleet Units for SPM

SPM agent services are installed via fleet (a distributed init system) in the whole cluster. Lets see those unit files before we fire them up into the Cloud.

The first unit file sematext-agent.service starts SPM Agent for Docker. It takes the SPM and Logsene app tokens and port for the logging gateway etcd. It starts on every CoreOS host (global unit).

spm-agent.service
Fleet Unit File – SPM Agent incl. Log Gateway: spm-agent.service

The second unit file logsene-service.service forwards logs from journald to that logging gateway running as part of sematext-agent-docker. All fields stored in the journal (down to source-code level and line numbers provided by GO modules) are then available in Logsene.

logsene-service
Fleet Unit File – Log forwarder: logsene.service

3. Set Up Monitoring and Logging Services

Preparation:

  1. Get a free account apps.sematext.com
  2. Create an SPM App of type “Docker” and copy the SPM Application Token
  3. Store the configuration in etcd
# PREPARATION
# set your application tokens for SPM and Logsene
export $SPM_TOKEN=YOUR-SPM-TOKEN
export $LOGSENE_TOKEN=YOUR-LOGSENE-TOKEN
# set the port for the Logsene Gateway
export $LG_PORT=9000
# Store the tokens in etcd
# please note the same key is used in the unit file!
etcdctl set /sematext.com/myapp/spm/token $SPM_TOKEN
etcdctl set /sematext.com/myapp/logsene/token $LOGSENE_TOKEN
etcdctl set /sematext.com/myapp/logsene/gateway_port $LG_PORT
 

Download the fleet unit files and start the service via fleetclt

# INSTALLATION
# Download the unit file for SPM
wget https://raw.githubusercontent.com/sematext/sematext-agent-docker/master/coreos/sematext-agent.service
# Start SPM Agent in the whole cluster
fleetctl load spm-agent.service; fleetctl start spm-agent.service
# Download the unit file for Logsene
wget https://raw.githubusercontent.com/sematext/sematext-agent-docker/master/coreos/logsene.service
# Start the log forwarding service
fleetctl load logsene.service; fleetctl start logsene.service

Check the installation

systemctl status sematext-agent.service
systemctl status logsene.service

Send a few log lines to see them in Logsene.

journalctl -o json -n 10 | ncat localhost 9000

After about a minute you should see Metrics in SPM and Logs in Logsene.

Core-OS-BEV
Cluster Health in ‘Birds Eye View’
docker-overview-2
Host and Container Metrics Overview for the whole cluster
logs
Logs and Metrics

Open-Source Resources

Some of the things described here are open-sourced:

Summary – What this gets you

Here’s what this setup provides for you:

  • Operating System metrics of each CoreOS cluster node
  • Container and Host Metrics on each node
  • All Logs from Docker containers and Hosts (via journald)
  • Docker Events from all nodes
  • CoreOS logs from all nodes

Having this setup allows you to take the full advantage of SPM and Logsene by defining intelligent alerts for metrics and logs (delivered via channels like e-mail, PagerDuty, Slack, HipChat or any WebHook), as well as making correlations between performance metrics, events, logs, and alerts.

Running CoreOS? Need any help getting CoreOS metrics and/or logs into SPM & Logsene?  Let us know!  Oh, and if you’re a small startup — ping @sematext — you can get a good discount on both SPM and Logsene!

Solr Training in New York City — October 19-20

[Note: since this workshop has already taken place, stay up to date with future workshops at our Solr Training page]

——-

For those of you interested in some comprehensive Solr training taught by an expert from Sematext who knows it inside and out, we’re running a super hands-on training workshop in New York City from October 19-20.

This two-day workshop will be taught by Sematext engineer — and author of Solr books — Rafal Kuc.

Target audience:

Developers and Devops who want to configure, tune and manage Solr at scale.

What you’ll get out of it:

In two days of training Rafal will help:

  • bring Solr novices to the level where he/she would be comfortable with taking Solr to production
  • give experienced Solr users proven and practical advice based on years of experience designing, tuning, and operating numerous Solr clusters to help with their most advanced and pressing issues

* See the Course Outline at the bottom of this post for details

When & Where:

  • Dates:        October 19 & 20 (Monday & Tuesday)
  • Time:         9:00 a.m. — 5:00 p.m.
  • Location:     New Horizons Computer Learning Center in Midtown Manhattan (map)
  • Cost:         $1,200 “early bird rate” (valid through September 1) and $1,500 afterward.  And…we’re also offering a 50% discount for the purchase of a 2nd seat!
  • Food/Drinks: Light breakfast and lunch will be provided

Register_Now_2

Attendees will go through several sequences of short lectures followed by interactive, group, hands-on exercises. There will be a Q&A session after each such lecture-practicum block.

Got any questions or suggestions for the course? Just drop us a line or hit us @sematext!

Lastly, if you can’t make it…watch this space or follow @sematext — we’ll be adding more Solr training workshops in the US, Europe and possibly other locations in the coming months.  We are also known worldwide for our Solr Consulting Services and Solr Production Support.

Hope to see you in the Big Apple in October!

——-

Solr Training Workshop – Course Outline

  • Introduction to Solr
  1. What is Solr and use – cases
  2. Solr master – slave architecture
  3. SolrCloud architecture
  4. Why & When SolrCloud
  5. Solr master – slave vs SolrCloud
  6. Starting Solr with schema-less configuration
  7. Indexing documents
  8. Retrieving documents using URI request
  9. Deleting documents
  • Indexing data

Continue reading “Solr Training in New York City — October 19-20”

Growing a Beard (or “How I wrote my first useful Node project”)

[Note: this post was written by Sematext engineer Marko Bonaći]

Stage setting: Camera is positioned above the treetop of one of three tall poplars. It looks down on the terrace of a pub. It’s evening, but there’s still enough light to see that the terrace is sparsely populated.

Camera slowly moves down towards a specific table in the corner…  

As the camera moves down, an old, crummy typewriter font appears on the screen, typing with distinct sound. It spells:

May 2015, somewhere in Germany…

The frame shows four adult males seating at the table. They sip their beers slowly, except for one of them. The camera focuses on him, as he hits a large German 1 liter pint in just two takes. On the table there’s a visible difference in the number of empty beer mugs in front of him and others. After a short silence, the heavy drinker says: (quickly, like he’s afraid that someone’s going to interrupt him, with facial expression like he’s in a confession):

“I still use grep to search through logs”.

As the sentence hit the eardrums of his buddies, a loud sound of overwhelming surprise involuntarily leaves their mouths. They notice that it made every guest turn to their table and the terrace fell into complete silence. The oldest one amongst them reacts quickly, like he wants no one to hear what he just heard, he turns towards the rest of the terrace and makes the hand waving motion, signaling that everything is fine. The sound of small talk and “excellent” German jokes once again permeates the terrace.

He, in fact, very well knew that it isn’t all fine. A burning desire to right this wrong grew somewhere deep within his chest. Camera focuses on this gentleman and starts to come increasingly closer to his chest.  When it hits the chest, {FX start} the camera enters inside, beneath the ribs. We see his heart pumping wildly. Camera goes even deeper, and enters the heart’s atrium, where we see buckets of blood leaving to quickly replenish the rest of the body in this moment of great need {FX end}.

The camera frame closes to a single point in the center the screen.

A couple of weeks later, we see a middle aged Croatian in his kitchen, whistling some unrecognized song while making Nescafe Creme and a secret Croatian vitamin drink called Cedevita.

Now camera shows him sitting at his desk and focuses on his face, “en face”.

He begins to tell his story…

“It was a warm Thursday, sometime in May 2015. My first week at Sematext was coming to end. I still remember, I was doing some local, on-ramping work, nothing remotely critical, when my boss asked me to leave everything aside. He had a new and exciting project for me. He allegedly found out that even the biggest proponent of centralized log management, Sematext, hides a person who still uses SSH+grep in its ranks.

The task was to design and implement an application that would let Logsene users access their logs from the command line (L-CLI from now on). I mentioned in my Sematext job interview that, besides Apache Spark (which was to be my main responsibility), I’d like to work with Node.js, if the opportunity presented itself. And here it was…”

What is Logsene?

Good thing you asked. Let me give you a bit of context, in case you don’t know what Logsene is. Logsene is a web application that’s used to find your way through piles of log messages. Our customers send us huge amounts of log messages, which are then collected into one of our Elasticsearch clusters (hereinafter ES). The system (built entirely out of open source components) is basically processing logs in near-real-time, so after the logs are safely stored and indexed in ES, they are immediately visible in Logsene. Here’s what the Logsene UI looks like:

Logsene_3

See those two large fields in the figure above? One for search query and the other for time range? Yes? Well, that was basically what my application needed to provide, only instead of web UI, users would use command-line interface.

Continue reading “Growing a Beard (or “How I wrote my first useful Node project”)”

Tomcat Monitoring SPM Integration

This old cat, Apache Tomcat, has been around for ages, but it’s still very much alive!  It’s at version 8, with version 7.x still being maintained, while the new development is happening on version 9.0.  We’ve just added support for Tomcat monitoring to the growing list of SPM integrations the other day, so if you run Tomcat and want to take a peek at all its juicy metrics, give SPM for Tomcat a go!  Note that SPM supports both Tomcat 7.x and 8.x.

Before you jump to the screenshot below, read this: you may reeeeeally want to enable Transaction Tracing in the SPM agent running on your Tomcat boxes.  Why?  Because that will help you find bottlenecks in your web application by tracing transactions (think HTTP requests + method call + network calls + DB calls + ….).  It will also build a whole map of all your applications talking to each other with information about latency, request rate, error and exception rate between all component!  Check this out (and just click it to enlarge):

AppMap

Everyone loves maps.  It’s human. How about charts? Some of us have a thing for charts. Here are some charts with various Tomcat metrics, courtesy of SPM:

Overview  (click to enlarge)

Tomcat_overview_2

Session Counters  (click to enlarge)

Tomcat_Session_Counters

Cache Usage  (click to enlarge)

Tomcat_Sessions_4

Threads (Threads/Connections)  (click to enlarge)

Tomcat_threads_4

Requests  (click to enlarge)

Tomcat_Requests

Hope you like this new addition to SPM.  Got ideas how we could make it more useful for you?  Let us know via comments, email, or @sematext.

Not using SPM yet? Check out the free 30-day SPM trial by registering here (ping us if you’re a startup, a non-profit, or education institution – we’ve got special pricing for you!).  There’s no commitment and no credit card required.  SPM monitors a ton of applications, like Elasticsearch, Solr, Hadoop, Spark, Node.js & io.js (open-source), Docker (get open-source Docker image), CoreOS, and more.

Introducing Logsene CLI

[Note: this post was written by Sematext engineer Marko Bonaći]

In vino veritas, right?  During a recent team gathering in Kraków, Poland, and after several yummy bottles of țuică, vișinată, żubrówka, diluted with some beer, the truth came out – even though we run Logsene, a log management service that you can think of as hosted ELK Stack, some of us still ssh into machines and grep logs!  Whaaaaat!?  What happened to eating our own dog food!?  It turns out it’s still nice to be able to grep through logs, pipe to awk, sed, and friends.  But that’s broken or at least inefficient — what do you do when you run multiple machines in a cluster of have several clusters?  Kind of hard to grep all them logs, isn’t it?  In the new world of containers this is considered an anti-pattern!  We can do better!  We can fix that!

Introducing Logsene CLI

Meet Logsene CLI, a command line tool used to search through all your logs from all your apps and servers in Logsene — from the console! Logsene CLI gives you the best of both worlds:

  • have your logs off-site, in Logsene, where they will always be accessible and shareable with the team; and where you can visualize them, graph them, dashboard them, do anomaly detection on them, and get alerts on them
  • have a powerful command-line log search tool you can combine with your favorite Linux tools: awk, grep, cut, sed, sort, head, tail, less, etc.

Logsene CLI is a Node.js app written by a self-proclaimed Node fanboy who, through coding Logsene CLI, became a real Node man and in the process grew a beard.  The source code can be found on GitHub.

Logsene CLI in Action

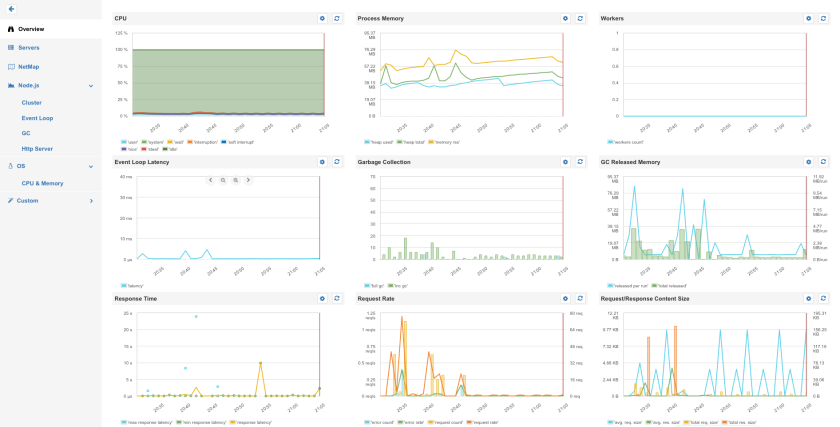
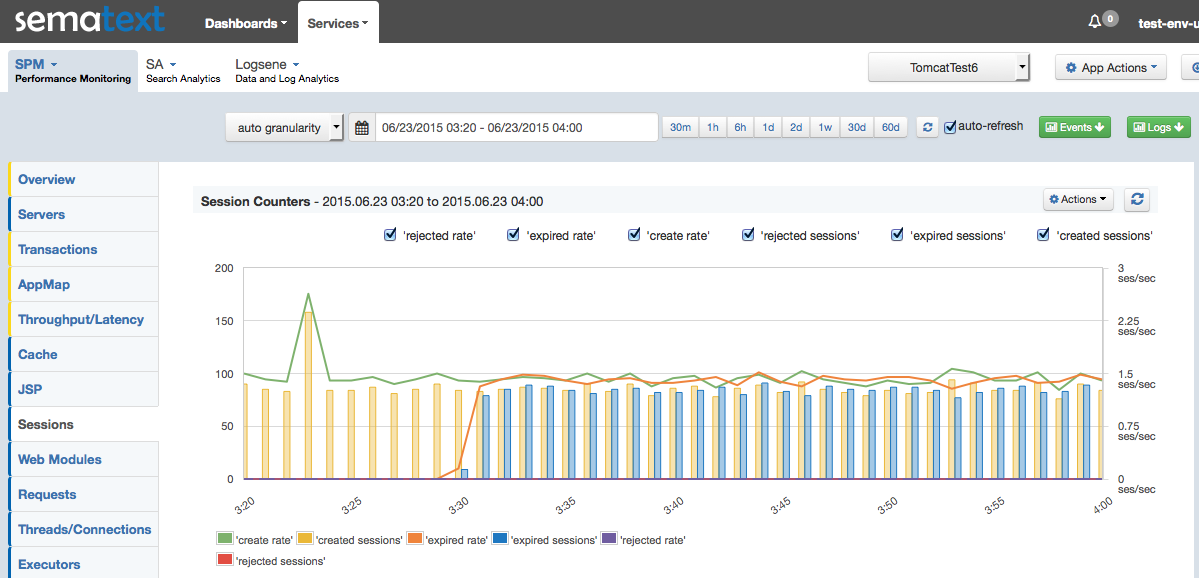
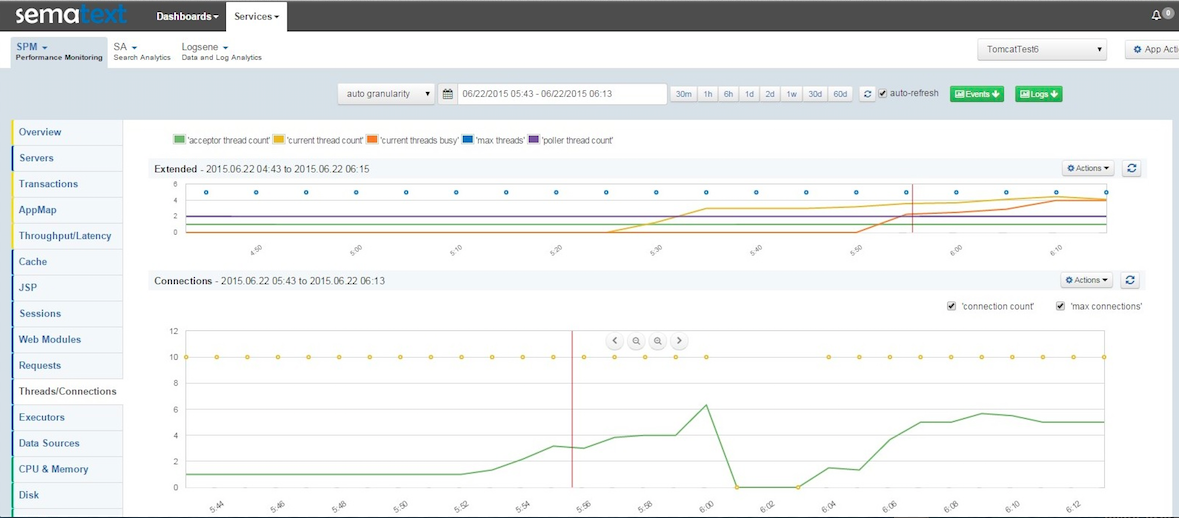
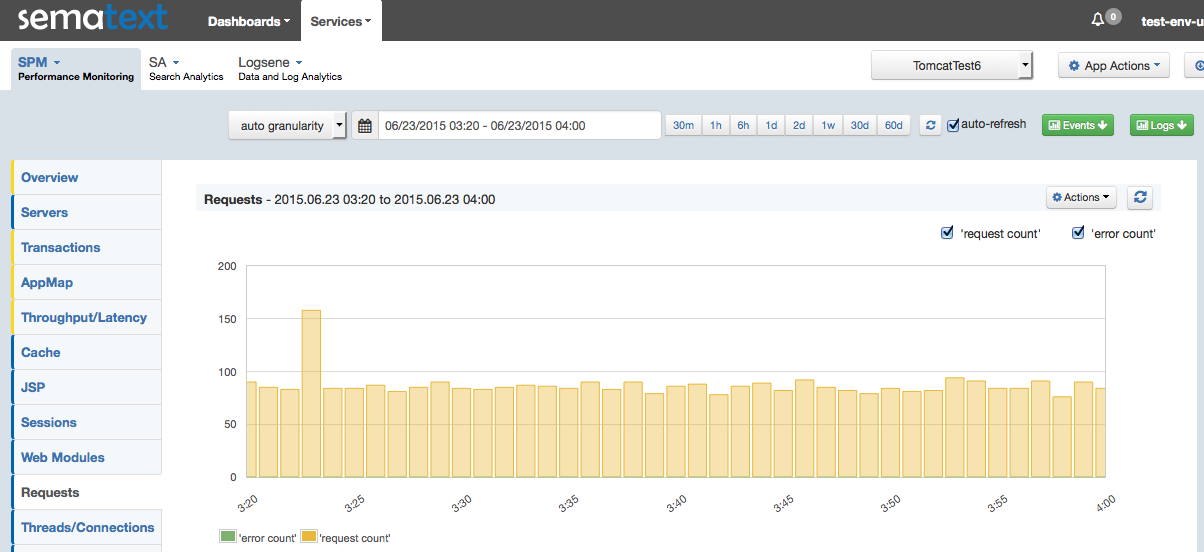
Here is what Logsene’s Web UI looks like:

Logsene_3

See those two large input fields in the figure above — one for search query and the other for time range? Well, information that you’d normally enter via those fields is what Logsene CLI lets you enter, but from our beloved console.  Let’s have a look.

Initial Authentication

In order to use Logsene CLI, the only thing you need are your Sematext account credentials. When you run your first search, you’ll be prompted to authenticate and then you’ll choose the Logsene application you want to work with, as show below:

CLI_1

Usage Examples

Let’s start with a basic example using Web server logs.

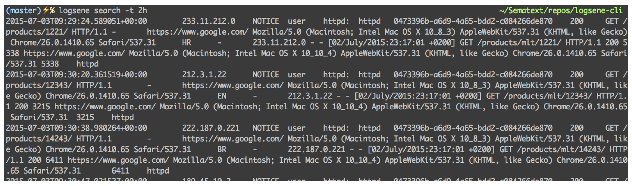
Say we want to retrieve all log entries from the last two hours (limited to first 200 events, which can be controlled with the -s parameter):

$ logsene search -t 2h

CLI_2

Now let’s combine Logsene CLI and awk.  Say you want to find out the average response size during the last two hours.  Before we do that, let’s also tell Logsene CLI to give us all matching events, not just first 200 by using the –default-size configuration setting without parameter:

$ logsene config set --default-size

Note that the default size limit is always in effect, unless explicitly changed in the configuration, like we just did. When set like this, in the configuration, the –default-size setting applies to the remainder of the current Logsene CLI session (times out after 30 minutes of inactivity). The other option is to use the  -s parameter on a per-command basis, which works the same way, you either specify the maximum number of returned results or you just use -s without a quantifier to disable the limit altogether.

So back to average response time in the last two hours. You could do it like this:

$ logsene search -t 2h | awk 'BEGIN{sum=0;cnt=0}{sum+=$53;cnt++}END{print sum/cnt}'

CLI_3

There – with this one-liner you can see the average response size across all your web servers is 5557.1 bytes.

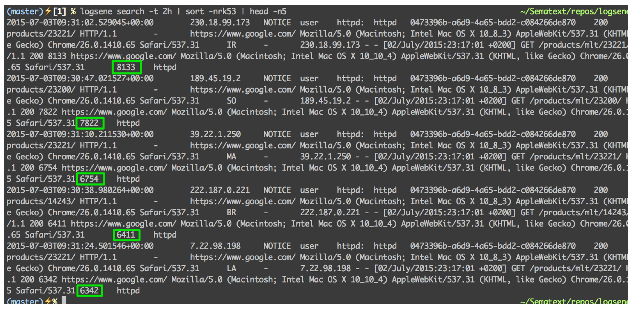
Next, let’s see how you’d combine log search/filtering with sort and head to get Top N reports, say five largest responses in the last two hours:

$ logsene search -t 2h | sort -nrk53 | head -n5

CLI_4

A little bit more realistic example — if your site were under a DoS attack, you might be interested in quickly seeing the top offenders.  Here’s a one-liner that shows how to use the -f switch to specify which field(s) to return – field host, in this example:

$ logsene search -t 10m -f host | sort | uniq -c | sort -r | head -n20

CLI_5

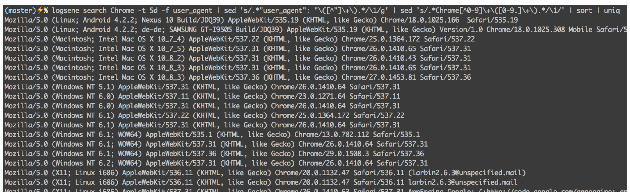
All examples so far were basically filtering by time.  Let’s actually search out logs!  Say you needed to get all versions of Chrome in the last 5 days:

$ logsene search Chrome -t 5d -f user_agent | \
sed 's/.*"user_agent": "\([^"]\+\).*/\1/g' | \
sed 's/.*Chrome[^0-9]\+\([0-9.]\+\).*/\1/' | sort | uniq

CLI_6

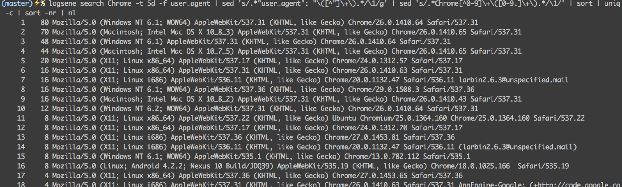
If you wanted to see the most popular versions of Chrome you’d just add count and sort.  Let’s also add line numbers:

$ logsene search Chrome -t 5d -f user_agent | \
sed 's/.*"user_agent": "\([^"]\+\).*/\1/g' | \
sed 's/.*Chrome[^0-9]\+\([0-9.]\+\).*/\1/' | sort | uniq -c | sort -nr | nl

CLI-7

We’ve used Web access log for examples so far, but you can certainly send any logs/events to Logsene and search them.

In the next example we search for logs that contain either or both phrases we specified and that were created between last Sunday morning and now.  Note that the “morning” part of the -t switch below translates to 06:00 (using whichever timezone your Logsene CLI is running in).  Let’s also return up to 300 results, instead of the default 200.

$ logsene search "signature that validated" "signature is valid" -t "last Sunday morning" -s 300

CLI_8

Note how this does an OR query by default.  Alternatively, you can use the -op AND switch to match only those logs that contain all given keywords or phrases.

Time Range Expressions

When searching through logs, it’s important to have a fine-grained time filtering capability.  Here’s a quick rundown through a few ways to specify time filters.

To retrieve last hour of logs, use search command without parameters:

logsene search

Remember, if you have more than 200 logs in the last hour this will show only the first 200 logs, unless you explicitly ask for more of them using the -s switch. If you don’t want to limit the output and simply display all available logs, just use -s without any quantifiers, like this:

logsene search -s

Note: when you specify time without a timezone Logsene CLI uses the timezone of the computer it’s running on. If you want to use UTC, all you need to do is append Z to a timestamp (e.g. 2015-06-30T16:50:00Z).

To retrieve the last 2 hours of logs:

logsene search -t 2h

To retrieve logs since a timestamp:

logsene search -t 2015-06-30T16:48:22

The next five commands show how to specify time ranges with the -t parameter. Logsene CLI recognizes ranges by examining whether the -t parameter value contains the forward slash character (ISO-8601).

To retrieve logs between two timestamps:

logsene search -t 2015-06-30T16:48:22/2015-06-30T16:50:00

To retrieve logs in the next 10 minutes from a timestamp:

logsene search -t 2015-06-30T16:48:22/+10m

To retrieve logs in the 10 minutes up to a timestamp:

logsene search -t 2015-06-30T16:48:22/-10

Minutes are used by default, so you can just omit m.

To retrieve logs from between 5 and 6 hours ago:

logsene search -t 6h/+1h

To retrieve logs from between 6 and 7 hours ago:

logsene search -t 6h/-1h

Fork, yeah!

You can try Logsene CLI even if you don’t already have Sematext account.  Opening a free, 30-day trial account is super simple. You’ll be set in less than 15 minutes to start playing with Logsene CLI. We won’t ask you for your credit card information (it’s not needed for a trial account, so why would we?).  Try it!

Signup_graphic

The Logsene CLI source code can be found on GitHub.

Please ping us back with your impressions, comments, suggestions, … anything really.  You can also reach us on Twitter @sematext, or the old-fashioned way, using e-mail.  And we would be exceptionally happy if you filed an issue or submitted a pull request on GitHub.  Enjoy!

Elasticsearch Training in New York City — October 19-20

[Note: since this workshop has already taken place, stay up to date with future workshops at our Elasticsearch / ELK Stack Training page]

——-

For those of you interested in some comprehensive Elasticsearch and ELK Stack (Elasticsearch / Logstash / Kibana) training taught by experts from Sematext who know them inside and out, we’re running a super hands-on training workshop in New York City from October 19-20.

This two-day, hands-on workshop will be taught by experienced Sematext engineers — and authors of Elasticsearch booksRafal Kuc and Radu Gheorghe.

Target audience:

Developers and DevOps who want to configure, tune and manage Elasticsearch and ELK Stack at scale.

What you’ll get out of it:

In two days with training run by two trainers we’ll:

  • bring Elasticsearch novices to the level where he/she would be comfortable with taking Elasticsearch to production
  • give experienced Elasticsearch users proven and practical advice based on years of experience designing, tuning, and operating numerous Elasticsearch clusters to help with their most advanced and pressing issues

When & Where:

  • Dates:        October 19 & 20 (Monday & Tuesday)
  • Time:         9:00 a.m. — 5:00 p.m.
  • Location:     New Horizons Computer Learning Center in Midtown Manhattan (map)
  • Cost:         $1,200 “early bird rate” (valid through September 1) and $1,500 afterward.  And…we’re also offering a 50% discount for the purchase of a 2nd seat!
  • Food/Drinks: Light breakfast and lunch will be provided

Register_Now_2

Attendees will go through several sequences of short lectures followed by interactive, group, hands-on exercises. There will be a Q&A session after each such lecture-practicum block.

Course outline:

  1. Basic flow of data in Elasticsearch
    1. what is Elasticsearch and typical use-cases
    2. installation
    3. index
    4. get
    5. search
    6. update
    7. delete
  2. Controlling how data is indexed and stored
    1. mappings and mapping types
    2. strings, integers and other core types
    3. _source, _all and other predefined fields
    4. analyzers
    5. char filters
    6. tokenizers
    7. token filters
  3. Searching through your data
    1. selecting fields, sorting and pagination
    2. search basics: term, range and bool queries
    3. performance: filters and the filtered query
    4. match, query string and other general queries
    5. tweaking the score with the function score query
  4. Aggregations
    1. relationships between queries, filters, facets and aggregations
    2. metrics aggregations
    3. multi-bucket aggregations
    4. single-bucket aggregations and nesting
  5. Working with relational data
    1. arrays and objects
    2. nested documents
    3. parent-child relations
    4. denormalizing and application-side joins
  6. Performance tuning
    1. bulk and multiget APIs
    2. memory management: field/filter cache, OS cache and heap sizes
    3. how often to commit: translog, index buffer and refresh interval
    4. how data is stored: merge policies; store settings
    5. how data and queries are distributed: routing, async replication, search type and shard preference
    6. doc values
    7. thread pools
    8. warmers
  7. Scaling out
    1. multicast vs unicast
    2. number of shards and replicas
    3. node roles
    4. time-based indices and aliases
    5. shard allocation
    6. tribe node
  8. Monitor and administer your cluster
    1. mapping and search templates
    2. snapshot and restore
    3. health and stats APIs
    4. cat APIs
    5. monitoring products
    6. hot threads API
  9. Beyond keyword search
    1. percolator
    2. suggesters
    3. geo-spatial search
    4. highlighting
  10. Ecosystem
    1. indexing tools: Logstash, rsyslog, Apache Flume
    2. data visualization: Kibana
    3. cluster visualization: Head, Kopf, BigDesk

Got any questions or suggestions for the course? Just drop us a line or hit us @sematext!

Lastly, if you can’t make it…watch this space or follow @sematext — we’ll be adding more Elasticsearch / ELK stack training workshops in the US, Europe and possibly other locations in the coming months.  We are also known worldwide for our Elasticsearch Consulting Services and Elasticsearch/ELK Production Support, as well as ELK Consulting.

Hope to see you in the Big Apple in October!