UPDATE: Related to monitoring CoreOS clusters, we have recently optimized the SPM setup on CoreOS and integrated a logging gateway to Logsene into the SPM Agent for Docker. You can read about it in Centralized Log Management and Monitoring for CoreOS Clusters
——-
[ Note: Click here for the Docker Monitoring webinar video recording and slides. And click here for the Docker Logging webinar video recording and slides. ]
In this post you’ll learn how to get operational insights (i.e. performance metrics, container events, etc.) from CoreOS and make that super simple with etcd, fleet, and SPM.
We’ll use:
SPM for Docker to run the monitoring agent as a Docker container and collect all Docker metrics and events for all other containers on the same host + metrics for hosts
fleet to seamlessly distribute this container to all hosts in the CoreOS cluster by simply providing it with a fleet unit file shown below
etcd to set a property to hold the SPM App token for the whole cluster
The Big Picture
Before we get started, let’s take a step back and look at our end goal. What do we want? We want charts with Performance Metrics, we want Event Collection, we’d love integrated Anomaly Detection and Alerting, and we want that not only for containers, but also for hosts running containers. CoreOS has no package manager and deploys services in containers, so we want to run the SPM agent in a Docker container, as shown in the following figure:
By the end of this post each of your Docker hosts could look like the above figure, with one or more of your own containers running your own apps, and a single SPM Docker Agent container that monitors all your containers and the underlying hosts.
[ Note: Click here for the Docker Monitoring webinar video recording and slides. And click here for the Docker Logging webinar video recording and slides. ]
——-
Docker deployments can be very dynamic with containers being started and stopped, moved around the YARN or Mesos-managed clusters, having very short life spans (the so-called pets) or long uptimes (aka cattle). Getting insight into the current and historical state of such clusters goes beyond collecting container performance metrics and sending alert notifications. If a container dies or gets paused, for example, you may want to know about it, right? Or maybe you’d want to be able to see that a container went belly up in retrospect when troubleshooting, wouldn’t you?
Just two weeks ago we added Docker Monitoring (docker image is right here for your pulling pleasure) to SPM. We didn’t stop there — we’ve now expanded SPM’s Docker support by adding Docker Event collection, charting, and correlation. Every time a container is created or destroyed, started, stopped, or when it dies, spm-agent-docker captures the appropriate event so you can later see what happened where and when, correlate it with metrics, alerts, anomalies — all of which are captured in SPM — or with any other information you have at your disposal. The functionality and the value this brings should be pretty obvious from the annotated screenshot below.
Every time a Docker container emits one of these events spm-agent-docker will capture it in real-time, ship it over to SPM, and you’ll be able to see it as shown in the above screenshot.
Oh, and if you’re running CoreOS, you may also want to see how to index CoreOS logs into ELK/Logsene. Why? Because then you can have not only metrics and container events in one place, but also all container and application logs, too!
If you’re using Docker, we hope you find this useful! Anything else you’d like us to add to SPM (for Docker or any other integration)? Leave a comment, ping @sematext, or send us email – tell us what you’d like to get for early Christmas!
Sometimes we just need to replay production queries – whether it’s because we want a realistic load test for the new version of a product or because we want to reproduce, in a test environment, a bug that only occurs in production (isn’t it lovely when that happens? Everything is fine in tests but when you deploy, tons of exceptions in your logs, tons of alerts from the monitoring system…).
With Elasticsearch, you can enable slowlogs to make it log queries taking longer (per shard) than a certain threshold. You can change settings on demand. For example, the following request will record all queries for test-index:
You can run those queries from the slowlog in a test environment via a tool like JMeter. In this post, we’ll cover how to parse slowlogs with Logstash to write only the queries to a file, and how to configure JMeter to run queries from that file on an Elasticsearch cluster.
Tired of tail -F /your/log/file | egrep -i ‘error|exception|warn’?
It’s common for devops to keep an eye out for errors in logs by running tail -F or to manually look for unusual application behavior by looking at logs in their terminal. The problem is that this gets tiring, boring — and even impossible — as the infrastructure grows. If you think about this from the business perspective: it gets expensive. Or maybe you automate things a bit via cron jobs that cat, grep, and mail errors, or maybe SSH to N remote servers to do that, etc.? You can do this only for so long. It doesn’t scale well. It’s fragile. Not the way to manage non-trivial infrastructure.
So what do you do?
First, consider using a centralized log management solution like Logsene instead of leaving log files on your file system. Alternatively, you can choose to run & maintain your own ELK stack, but then you won’t get what we are about to show you out of the box.
Saved, Alert & Scheduled Queries
We’ve created a 3-part blog series to detail the different types of Queries that Logsene lets you create:
Saved Queries: queries that you’ve saved, so that you can later just execute them instead of writing them again
Alert Queries: saved queries that are continuously running and that you configured to alert you when certain conditions are matched
Scheduled Queries: queries that are executed periodically and that send you their output in a form of an log chart image
Put another way, using these queries means you can have Logsene’s servers do all the tedious work we mentioned above. That’s why we created computers in the first place, isn’t it?
It’s done in a few minutes, and how much time does it saves you every day?
So, how about that tail -F /my/log/file.log | egrep -i ‘error|exception|warn’ mentioned earlier? If you’re getting tired of tailing and grepping log files, sshing to multiple servers and chasing errors in them, try Logsene by registering here. If you are a young startup, a small or non-profit organization, or an educational institution, ask us for a discount (see special pricing)!
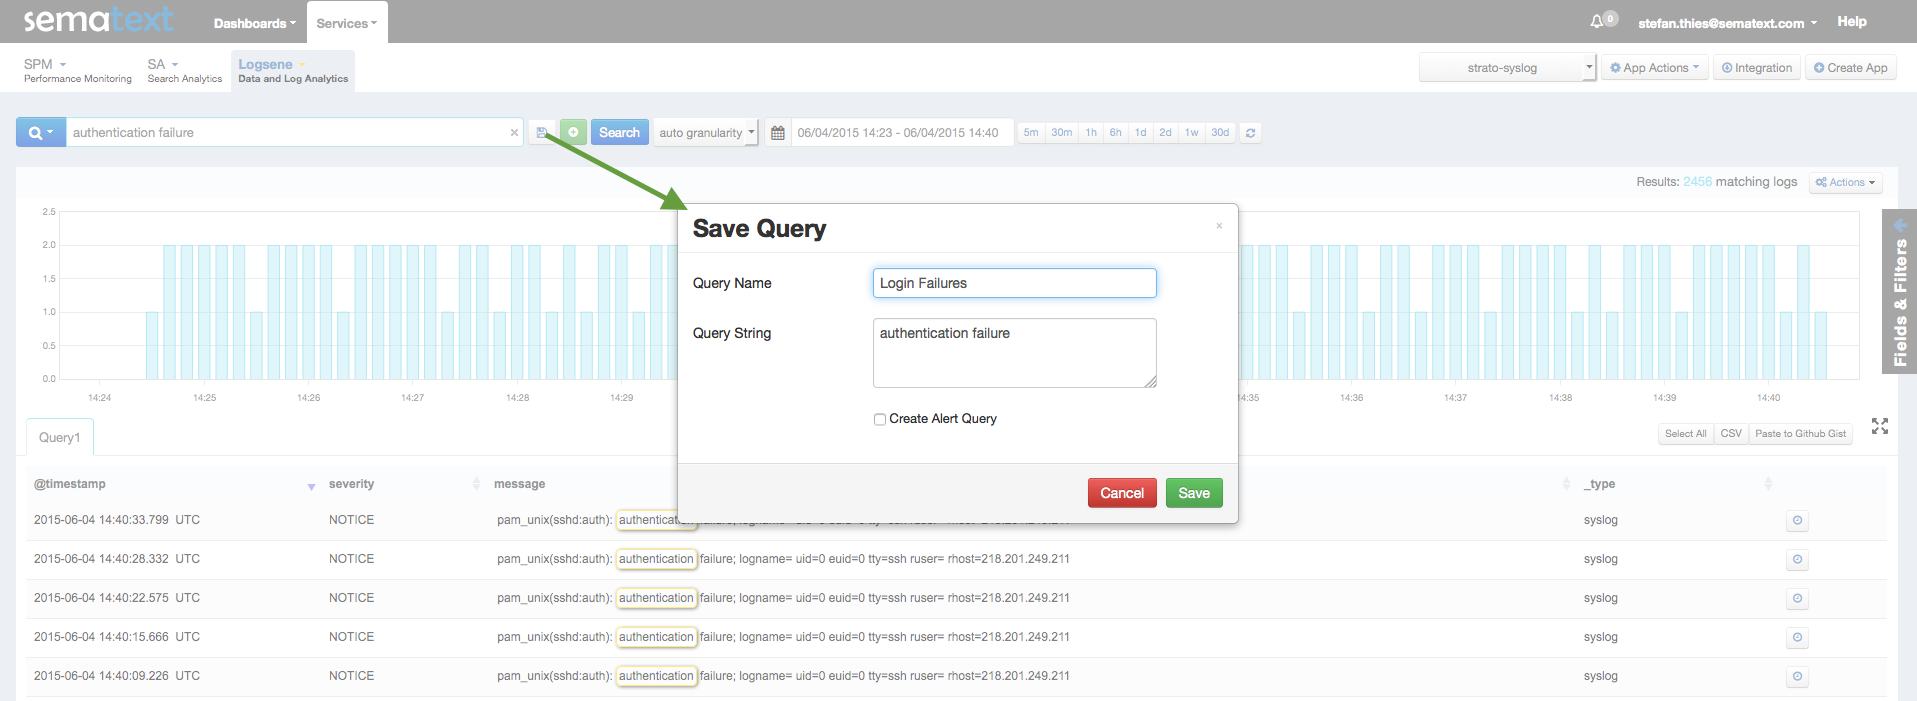
When digging through logs you might find yourself running the same searches again and again. To solve this annoyance, Logsene lets you save queries so you can re-execute them quickly without having to retype them:
1) Enter your query and press the “disk” icon next to the search-textbox. Give your query a friendly Query Name and press the “save” button.
2) To run a Saved Query just click on it in the Search Queries pop-out window (see screenshot below). Existing Saved Queries can be edited or deleted, too:
Logsene tracks the history of recently used queries, so it’s easy to try several queries and finally save the one that worked best for your use case. That’s why you’ll find three tabs in the saved queries popup:
Recent Queries – queries that you’ve recently used, you can save them using the save button
Saved Queries – queries that you’ve saved, so that you can later just execute them instead of writing them again
Alert Queries – saved queries that are continuously running and that you configured to alert you when certain conditions are matched
3-Part Blog Series about Log Queries
Speaking of log queries…this post is part of our 3-part blog series to detail the different types of Queries that Logsene lets you create. Check out the other posts about Alert Queries and Scheduled Queries.
Does this sound like something you could use?
If so, simply sign up here – there’s no commitment and no credit card required. Small startups, startups with no or very little outside investment money, non-profit and educational institutions get special pricing – just get in touch with us. If you’d like to help us make SPM and Logsene even better, we are hiring!
Until software becomes so sophisticated that it becomes truly self-healing without human intervention it will remain important that we humans be notified of any problems with computing systems we run. This is especially true for large or distributed systems where it quickly becomes impossible to watch logs manually. A common practice is to watch performance metrics instead, centralize logs, and dig into logs only when performance problems are detected. If you use SPM Performance Monitoring already, you are used to defining alerts on critical metrics, and if you are a Logsene user you can now use alerting on logs, too! Here is how:
Run your query in Logsene to search for relevant logs and press the “Save” button (see screenshot below)
Mark the checkbox “Create Alert Query” and pick whether you want threshold-based or anomaly detection-based alerting:
Threshold-based alert in LogseneAnomaly Detection using “Algolerts” in LogseneManage Alert Queries in Logsene
While alert creation dialog currently shows only email as a possible destination for alert notifications, you can actually have alert notifications sent to one or more other destinations. To configure that go to “App Settings” as shown below:
Once there, under “Notification Transport” you will see all available alert destinations:
In addition to email, PagerDuty, and Nagios, you can have alert notifications go to any WebHook you configure, including Slack and Hipchat.
How does one decide between Threshold-based and Anomaly Detection-based Alerts (aka Algolerts)?
The quick answers:
If you have a clear idea about how many logs should be matching a given Alert Query, then simply use threshold-based Alerts.
If you do not have a sense of how many matches a given Alert Query matches on a regular basis, but you want to watch out for sudden changes in volume, whether dips or spikes, use Algolerts (Anomaly Detection-based Alerts).
Speaking of log queries…this post is part of our 3-part blog series to detail the different types of Queries that Logsene lets you create. Check out the other posts about Saved Queries and Scheduled Queries.
Keep an eye on anomalies or other patterns in your logs
…by checking out Logsene. Simply sign up here – there’s no commitment and no credit card required. Small startups, startups with no or very little outside investment money, non-profit and educational institutions get special pricing – just get in touch with us. If you’d like to help us make SPM and Logsene even better, we are hiring
In many cases just seeing an unexpected change in log volume is enough to make us want to check out logs to make sure everything is working correctly. While seeing the general log volume is handy, wouldn’t it be even more useful to see the log volume of errors or exceptions being generated? Of course it would! That’s what Alert Queries are for! But what if you are not the DevOps person who needs to jump on problems as soon as they are discovered, but still want to keep an eye on systems for which you are responsible? It would be nice to have all reports show up in your email every morning when you start work, wouldn’t it? That’s why we implemented Scheduled Queries in Logsene. Here’s how to set that up:
1) Define a query and select “Application Actions / Report Mailing”
2) Choose a Subscription Schedule and time range and save your settings. You can choose to get reports delivered daily or weekly or … your choice!
It’s as simple as that! For manager and anyone else who wants to keep an eye on the health and status of various systems, we think this is a welcome feature. Here’s a screenshot from one of our Scheduled Queries:
3-Part Blog Series about Log Queries
Speaking of log queries…this post is part of our 3-part blog series to detail the different types of Queries that Logsene lets you create. Check out the other posts about Saved Queries and Alert Queries.
This takes just a minute to set up, and how much time does it save you every day?
If you’d like to easily schedule queries for log reporting, check out Logsene. Simply sign up here – there’s no commitment and no credit card required. Small startups, startups with no or very little outside investment money, non-profit and educational institutions get special pricing – just get in touch with us. If you’d like to help us make SPM and Logsene even better, we are hiring.
[ Note: Click here for the Docker Monitoring webinar video recording and slides. And click here for the Docker Logging webinar video recording and slides. ]
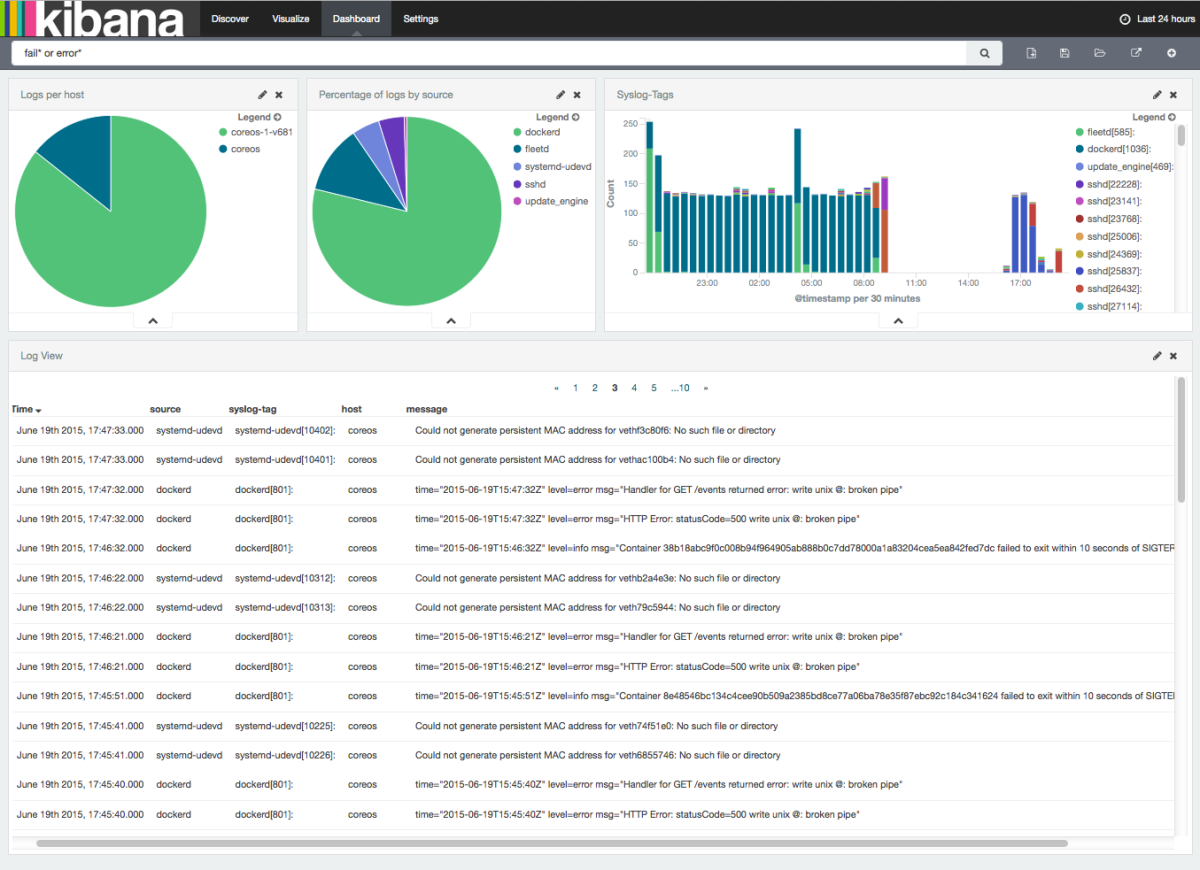
CoreOS Linux is the operating system for “Super Massive Deployments”. We wanted to see how easily we can get CoreOS logs into Elasticsearch / ELK-powered centralized logging service. Here’s how to get your CoreOS logs into ELK in about 5 minutes, give or take. If you’re familiar with CoreOS and Logsene, you can grab CoreOS/Logsene config files from Github. Here’s an example Kibana Dashboard you can get in the end:
CoreOS Kibana Dashboard
CoreOS is based on the following:
Docker and rkt for containers
systemd for startup scripts, and restarting services automatically
etcd as centralized configuration key/value store
fleetd to distribute services over all machines in the cluster. Yum.
journald to manage logs. Another yum.
Amazingly, with CoreOS managing a cluster feels a lot like managing a single machine! We’ve come a long way since ENIAC!
There’s one thing people notice when working with CoreOS – the repetitive inspection of local or remote logs using “journalctl -M machine-N -f | grep something“. It’s great to have easy access to logs from all machines in the cluster, but … grep? Really? Could this be done better? Of course, it’s 2015!
Here is a quick example that shows how to centralize logging with CoreOS with just a few commands. The idea is to forward the output of “journalctl -o short” to Logsene‘s Syslog Receiver and take advantage of all its functionality – log searching, alerting, anomaly detection, integrated Kibana, even correlation of logs with Docker performance metrics — hey, why not, it’s all available right there, so we may as well make use of it all! Let’s get started!
Preparation:
1) Get a list of IP addresses of your CoreOS machines
fleetctl list-machines
2) Create a new Logsene App (here)
3) Change the Logsene App Settings, and authorize the CoreOS host IP Addresses from step 1) (here’s how/where)
Congratulations – you just made it possible for your CoreOS machines to ship their logs to your new Logsene app!
Test it by running the following on any of your CoreOS machines:
journalctl -o short -f | ncat --ssl logsene-receiver-syslog.sematext.com 10514
…and check if the logs arrive in Logsene (here). If they don’t, yell at us @sematext – there’s nothing better than public shaming on Twitter to get us to fix things. 🙂
Create a fleet unit file called logsene.service
[Unit]
Description=Logsene Log Forwarder

[Service]
Restart=always
RestartSec=10s
ExecStartPre=/bin/sh -c "if [ -n \"$(etcdctl get /sematext.com/logsene/`hostname`/lastlog)\" ]; then  echo \"Value Exists: /sematext.com/logsene/`hostname`/lastlog $(etcdctl get /sematext.com/logsene/`hostname`/lastlog)\"; else etcdctl set /sematext.com/logsene/`hostname`/lastlog\"`date +\"%Y-%%m-%d %%H:%M:%S\"`\"; true; fi"
ExecStart=/bin/sh -c "journalctl --since \"$(etcdctl get /sematext.com/logsene/`hostname`/lastlog)\" -o short -f | ncat --ssl logsene-receiver-syslog.sematext.com  10514"
ExecStopPost=/bin/sh -c "export D=\"`date +\"%Y-%%m-%%d %%H:%M:%S\"`\"; /bin/etcdctl set /sematext.com/logsene/$(hostname)/lastlog \"$D\""

[Install]
WantedBy=multi-user.target

[X-Fleet]
Global=true
Activate cluster-wide logging to Logsene with fleet
To start logging to Logsene from all machines activate logsene.service:
There. That’s all there is to it! Hope this worked for you!
At this point all your CoreOS logs should be going to Logsene. Now you have a central place to see all your CoreOS logs. If you want to send your app logs to Logsene, you can do that, too — anything that can send logs via Syslog or to Elasticsearch can also ship logs to Logsene. If you want some Docker containers & host monitoring to go with your CoreOS logs, just pull spm-agent-docker from Docker Registry. Enjoy!
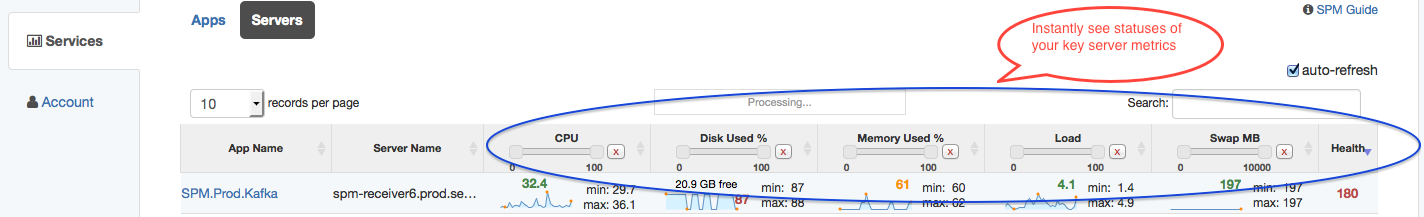
Everyone’s infrastructure is growing – whether you run baremetal servers, use IaaS, or use Containers. This just-added SPM functionality, a new view in SPM that we call BEV (aka Birds Eye View) helps you get better visibility into all your servers requiring attention — especially the hot ones!
Up until now SPM provided you with very detailed insight into all kinds of metrics for whichever SPM App you were looking at. SPM, of course, lets you monitor a bunch of things! Thus you, like lots of other SPM users, might be monitoring several (types of) applications (e.g. real-time data processing pipelines). This means you also need to be able to see how servers running those apps are doing health-wise. Do any of them have maxed out CPUs? Any of them close to running out of disk? Any of them swapping like crazy? Wouldn’t it be nice to see various metrics for lots or even all your servers at a glance? BEV to the rescue!
With BEV you can get an instant, real-time, and consolidated look at your key server and application-specific metrics, including: CPU utilization, Disk used %, Memory used %, Load, and Swap. From these metrics SPM computes the general health of the server, which it uses to surface the most problematic servers and, by using red, orange, and green coloring, bring the most critical servers to your attention.
Cross-app Server Visibility
BEV is especially valuable because it gives you the overall view of all your servers, across all your SPM Apps – yet with the ability to filter by app and hostname patterns. BEV is like top + df for all your servers and clusters. In fact, BEV was designed to give users at-a-glance capabilities in a few different ways:
Sparklines: Whereas the typical application performance monitoring (APM) chart is designed to show as much data as possible, sparklines are intended to be succinct and give users an instant idea if whether a specific application is encountering a problem.
Colored Metric Numbers: Getting an instant sense of server health is as easy as driving up to a traffic light. Green — sweet, looks good. Orange — hmmm, should watch that. Red — whoa, better check that out asap!
While BEV already surfaces the hottest servers, you can also set min/max ranges for any of the metrics and thus easily hide servers that you know are healthy and that you don’t want to even see in BEV. Just use the sliders marked in the screenshot below.
Hope you like this new addition to SPM. Got ideas how we could make it more useful for you? Let us know via comments, email, or @sematext.
If topics like log analytics and Solr are your thing then we may have a treat for you at the upcoming Lucene / Solr Revolution conference in Austin in October. Two of Sematext’s engineers and Solr, Elasticsearch and ELK stack experts — Rafal Kuc and Radu Gheorghe — have proposed a talk called “Large Scale Log Analytics with Solr” and could use some upvoting from the community to get in on this year’s agenda.
To show your support for “Large Scale Log Analytics with Solr” just click here to vote. Takes less than a minute! Even if you don’t attend the conference, we’ll post the slides and video here on the blog…assuming it gets on the agenda. Voting will close at 11:59pm EDT on Thursday, June 25th.
Talk Summary
This talk is about searching and analyzing time-based data at scale. Documents ranging from blog posts and social media to application logs and metrics generated by smart watches and other “smart” things share a similar pattern: timestamp among their fields, rarely changeable, deletion when they become obsolete.
Very often this kind of data is so large that it causes scaling and performance challenges. We’ll address precisely these challenges, which include:
Properly designing collections architecture
Indexing data fast and without documents waiting in queues for processing
Being able to run queries that include time-based sorting and faceting on enormous amounts of indexed data without killing Solr
…and many more
We’ll start with the indexing pipeline — where you do all your ETL. We’ll show you how to maximize throughput through various ETL tools, such Flume, Kafka, Logstash and rsyslog, and make them scale and send data to Solr.
On the Solr side, we’ll show all sorts of tricks to optimize indexing and searching: from tuning merge policies to slicing collections based on timestamp. While scaling out, we’ll show how to improve the performance/cost ratio.