Monitoring Kibana 4’s Node.js App

The release of Kibana 4.x has had an impact on monitoring and other related activities.  In this post we’re going to get specific and show you how to add Node.js monitoring to the Kibana 4 server app.  Why Node.js?  Because Kibana 4 now comes with a little Node.js server app that sits between the Kibana UI and the Elasticsearch backend.  Conveniently, you can monitor Node.js apps with SPM, which means SPM can monitor Kibana in addition to monitoring Elasticsearch.  Futhermore, Logstash can also be monitored with SPM, which means you can use SPM to monitor your whole ELK Stack!  But, I digress…

A few important things to note first:

  • the Kibana 4 project moved from Ruby to pure browser app to Node.js on the server side, as mentioned above
  • it now uses the popular Express Web Framework
  • the server component has a built-in proxy to Elasticsearch, just like it did with the Ruby app
  • when monitoring Kibana 4, the proxy requests to Elasticsearch are monitored at the same time

OK, here’s how to add Node.js monitoring to the Kibana 4 server-side app.

1) Preparation

Get an App Token for SPM by creating a new Node.js SPM App in SPM.

Kibana 4 currently ships with Node.js version 0.10.35 in a subdirectory – so please make sure your Node.js is on 0.10 while installing SPM Agent for Node.js (it compiles native modules, which need to fit to Kibana’s 0.10 runtime).

  npm-install n -g
  n 0.10.35

After finishing the described installation below you can easily switch back to 0.12 or io.js 2.0 by using “n 0.12” or “n io 2.0” – because Kibana will use its own node.js sub-folder.

2) Install SPM Agent for Node.js

Switch over to your Kibana 4 installation directory.  It has a “src” folder where the Node.js modules are installed.

  cd src
  npm install spm-agent-nodejs

Add the following line to ./src/app.js

  var spmAgent = require ('spm-agent-nodejs')

Add the following line to bin/kibana shell script at the beginning

export spmagent_tokens__spm=YOUR-SPM-APP-TOKEN

3) Run Kibana

bin/kibana

4) Check results in SPM

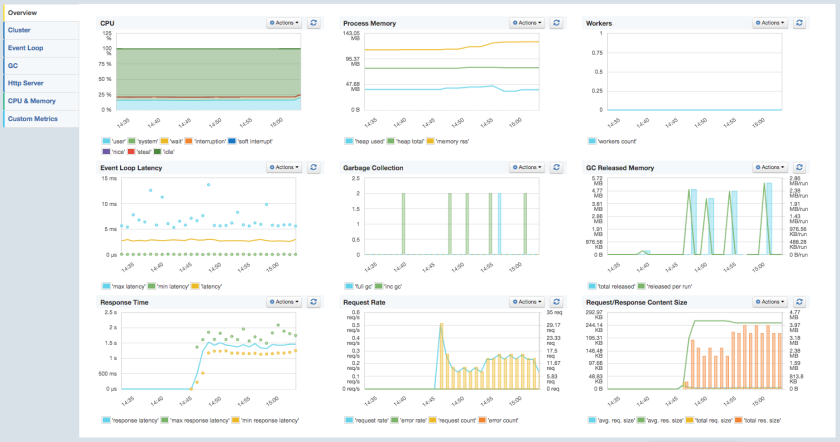
After a minute you should see the performance metrics such as EventLoop Latencies, Memory Usage, Garbage Collection details and HTTP statistics of your Kibana 4 Server app in SPM.

Kibana 4 - monitored with SPM for Node.js
Kibana 4 – monitored with SPM for Node.js

SPM for Node.js Monitoring – Details, Screenshots and more

For more specific details about SPM’s Node.js monitoring integration, check out this blog post.

That’s all there is to it!  If you’ve got questions or feedback to this post, please let us know!

Side by Side with Elasticsearch and Solr: Performance and Scalability

[Note: this post has been updated to include video and slides from the June 2 presentation]

Back by popular demand!  Sematext engineers Radu Gheorghe and Rafal Kuc returned to Berlin Buzzwords on Tuesday, June 2, with the second installment of their “Side by Side with Elasticsearch and Solr” talk.  (You can check out Part 1 here.)

Elasticsearch and Solr Performance and Scalability

This brand new talk — which included a live demo, a video demo and slides — dove deeper into into how Elasticsearch and Solr scale and perform. And, of course, they took into account all the goodies that came with these search platforms since last year.

Radu and Rafal showed attendees how to tune Elasticsearch and Solr for two common use-cases: logging and product search.  Then they showed what numbers they got after tuning. There was also some sharing of best practices for scaling out massive Elasticsearch and Solr clusters; for example, how to divide data into shards and indices/collections that account for growth, when to use routing, and how to make sure that coordinated nodes don’t become unresponsive.

Here is the video:


…and here are the slides:


Feedback & Questions — Bring It On

If you’ve got feedback or questions about topics like Elasticsearch vs. Solr (here’s a detailed comparison) and what’s new and exciting with both applications, just drop us a line.  We live and breathe this stuff, so we’re always happy to hear from like-minded people.

Handling Stack Traces with Logstash

Here at Sematext we use Java (8!) and rely on centralized logging a lot. We like them so much that we regularly share our logging experience with everyone and help others with logging, especially, ELK stack. Centralized logging plays nice with Java (and anything else that can write pretty logs). However, there is one tricky thing that can be hard to get right: properly capturing exception stack traces. Unlike your typical single-line log events, stack traces have multiple lines and they aren’t always perfectly uniform.  As such, most log shipper don’t handle them properly out of the box and typically treat each stack trace line as a separate event – clearly the wrong thing to do (n.b., if you are sending logs to Logsene this way, you are going to hit your plan limits faster, so make sure you send stack traces properly!).  Thus, in most cases, a special configuration is needed in order to get stack traces right. Let’s see how one needs to configure Logstash for this task.  We’ll be using Logstash 1.5.

Prerequisites

We start from the following assumptions:

  • you have a working Logstash setup
  • local logs are written to a file named: /var/log/test.log
  • the conversion pattern for log4j/logback/log4j2 is: “%d %p %m%n”

Based on the above pattern, logs should look like this, for example:

2015-03-23 11:11:50,778 INFO Initializing Systems Cache
2015-03-23 11:11:58,666 ERROR Processing request failed
kafka.common.FailedToSendMessageException: Failed to send messages after 3 tries.
	at kafka.producer.async.DefaultEventHandler.handle(DefaultEventHandler.scala:90)
	at kafka.producer.Producer.send(Producer.scala:77)
	at kafka.javaapi.producer.Producer.send(Producer.scala:42)
	...

Extracting Exception Stack Traces Correctly

Stack traces are multiline messages or events. Logstash has the ability to parse a log file and merge multiple log lines into a single event. You can do this using either the multiline codec or the multiline filter, depending on the desired effect. A codec is attached to an input and a filter can process events from multiple inputs.

The most popular example that allows matching log lines that are a part of an exception uses a not so simple regexp:

input {
  file {
    path => "/var/log/test.log"
    start_position => "beginning"
    codec => multiline {
      pattern => "(^\d+\serror)|(^.+Exception: .+)|(^\s+at .+)|(^\s+... \d+ more)|(^\s*Caused by:.+)"
      what => "previous"
    }   
  } 
}

If the log line is part of an exception, it is appended to the last received log line. Once a new log line is received, the complete exception is sent to be processed. The downside of this approach is that it might not match all exceptions correctly. Sure, you could keep fine-tuning and expanding the regexp and attempt to capture all possible variants of stack trace format, but … there is a better (way.

input {
  file {
    path => "/var/log/test.log"
    start_position => "beginning"
    codec => multiline {
      pattern => "^%{TIMESTAMP_ISO8601}"
      negate => true
      what => "previous"
    }   
  } 
}

The pattern looks for log lines starting with a timestamp and, until a new match is found, all lines are considered part of the event. This is done by setting the negate parameter to true.

Structuring Logs with Grok

To structure the information before storing the event, a filter section should be used for parsing the logs.

filter {
  mutate {
    gsub => [ "message", "\r", "" ]
  }
  grok {
    match => [ "message", "(?m)%{TIMESTAMP_ISO8601:timestamp} %{LOGLEVEL:severity} %{GREEDYDATA:message}" ]
    overwrite => [ "message" ]
  }
  date {
    match => [ "timestamp" , "yyyy-MM-dd HH:mm:ss,SSS" ]
  }
}

output {
  stdout { codec => rubydebug }
}

The output section, in this case, is only used for debugging.  In the next section we show how to actually ship your logs.

First, the mutate filter removes any “\r” characters from the event. Usually, this is something you want to do, to prevent later issues when storing and visualizing the logs where “\r” could be interpreted as a “\n”.

The grok filter splits the event content into 3 parts: timestamp, severity and message (which overwrites original message). The (?m) in the beginning of the regexp is used for multiline matching and, without it, only the first line would be read. The patterns used in the regexp are provided with Logstash and should be used when possible to simplify regexps.

By default, the timestamp of the log line is considered the moment when the log line is read from the file. The date filter fixes the timestamp, by changing it to the one matched earlier with the grok filter.

Shipping the Logs

Finally, now that you’ve got all your logs extracted, even those with multiple lines like exception stack traces, it’s time to ship them to wherever you keep your logs.  Here’s how you’d ship them to Logsene:

output {
  elasticsearch {
    host => "logsene-receiver.sematext.com"
    ssl => true
    port => 443
    index => "YOUR LOGSENE APP TOKEN GOES HERE"
    protocol => http
    manage_template => false
  }
}

Final Words

If you are looking for a way to ship logs containing stack traces or other complicated multi line events, Logstash is the simplest way to do it at the moment.

It is written JRuby, which makes it possible for many people to contribute to the project. The downside of this ease of use and maintainability is that it is not the fastest tool for the job and it is also quite resource hungry (both CPU and memory). Though, depending on the log volume that needs to be shipped, this might not be a problem.

For those looking for tips on how to ship multiline logs with rsyslog or syslog-ng, subscribe to this blog or follow @sematext – tips for handling stack traces with rsyslog and syslog-ng are coming.

If your organization need help with logging (ELK stack, but also rsyslog, Fluentd, Flume…), let us know.  If you like to build tools and products around logs and logging, join us – we’re always looking for good toolmakers world-wide.
Presentation: Tuning Elasticsearch Indexing Pipeline for Logs

Fresh from GeeCON in Krakow…we have another Elasticsearch and Logging manifesto from Sematext engineers — and book authors — Rafal Kuc and Radu Gheorghe.  As with many of their previous presentations, Radu and Rafal go into detail on Elasticsearch, Logstash and Rsyslog topics like:

  • How Elasticsearch, Logstash and Rsyslog work
  • Tuning Elasticsearch
  • Using, scaling, and tuning Logstash
  • Using and tuning Rsyslog
  • Rsyslog with JSON parsing
  • Hardware and data tests
  • …and lots more along these lines

[Note: Video of the talk coming soon to this post!]

If you find this stuff interesting and have similar challenges, then drop us a line to chat about our Elasticsearch and Logging consulting services and Elasticsearch (and Solr, too) production support.  Oh yeah, and we’re hiring worldwide if you are into Logging, Monitoring, Search, or Big Data Analytics as much as Radu and Rafal!

Elasticsearch Training in Berlin – Wednesday, June 3

For those of you interested in some comprehensive Elasticsearch training taught by experts from Sematext who know it inside and out, we’re running an Elasticsearch Intro workshop in Berlin on Wednesday, June 3 (the day after Berlin Buzzwords ends). This full-day, hands-on training workshop will be taught by Sematext engineer — and author of several Elasticsearch booksRafal Kuc.  The workshop is open to anyone, not just folks who attended Berlin Buzzwords.

ES_intro_2

Here are the details:

  • Date:  Wednesday, June 3
  • Time:  9:00 a.m. to 5:00 p.m.
  • Location:  idealo internet GmbH, Ritterstraße 11, 10969 Berlin, Germany (less than 2 km from Buzzwords site)
  • Cost:  EUR 400 (early bird rate, valid through May 25) – EUR 500 afterward – 50% off 2nd seat!
  • Food/Drinks:  Light breakfast, lunch and post-workshop snacks & beverages

Register_Now_2 In this training workshop attendees will go through a series of short lectures followed by exercises and Q&A sessions covering the many aspects of Elasticsearch.  There will also be plenty of opportunities to get production tips & tricks that make things smoother. We are also considering an Elasticsearch Advanced class to be taught simultaneously at the same location.  If this is of interest to you and/or your colleagues, please drop us a line and it could happen! Lastly, if you can’t make it…watch this space.  We’ll be adding more Elasticsearch training workshops in the US, Europe and possibly other locations in the coming months.  We are also known worldwide for our Elasticsearch consulting services and production support if you need help asap. Hope to see you in Berlin!

Top 10 Elasticsearch Metrics to Watch

Elasticsearch is booming.  Together with Logstash, a tool for collecting and processing logs, and Kibana, a tool for searching and visualizing data in Elasticsearch (aka the “ELK” stack), adoption of Elasticsearch continues to grow by leaps and bounds.  When it comes to actually using Elasticsearch, there are tons of metrics generated.  Instead of taking on the formidable task of tackling all-things-metrics in one blog post, we’re going to serve up something that we at Sematext have found to be extremely useful in our work as Elasticsearch consultants, production support providers, and monitoring solution builders: the top 10 Elasticsearch metrics to watch.  This should be especially helpful to those readers new to Elasticsearch, and also to experienced users who want a quick start into performance monitoring of Elasticsearch.

Side note: we’re @sematext, if you’d like to follow us.

Here are the Top 10 Elasticsearch metrics:

  1. Cluster Health – Nodes and Shards
  2. Node Performance – CPU
  3. Node Performance – Memory Usage
  4. Node Performance – Disk I/O
  5. Java – Heap Usage and Garbage Collection
  6. Java – JVM Pool Size
  7. Search Performance – Request Latency and Request Rate
  8. Search Performance – Filter Cache
  9. Search Performance – Field Data Cache
  10. Indexing Performance – Refresh Times and Merge Times

Most of the charts in this piece group metrics either by displaying multiple metrics in one chart or organizing them into dashboards. This is done to provide context for each of the metrics we’re exploring.

To start, here’s a dashboard view of the 10 Elasticsearch metrics we’re going to discuss.

Top_10_dashboard

This dashboard image, and all images in this post, are from Sematext’s SPM Performance Monitoring tool.

Now, let’s dig each of the top 10 metrics one by one and see how to interpret them.

Continue reading “Top 10 Elasticsearch Metrics to Watch”

Recipe: Reindexing Elasticsearch Documents with Logstash

If you’re working with Elasticsearch, it’s very likely that you’ll need to reindex data at some point. The most popular reason is because you need a mapping change that is incompatible with your current mapping. New fields can be added by default, but many changes are not allowed, for example:

  • Want to switch to doc values because field data is taking too much heap? Reindex!
  • Want to change the analyzer of a given field? Reindex!
  • Want to break one great big index into time-based indices? Reindex!

Enter Logstash

A while ago I was using stream2es for reindexing, but if you look at the GitHub page it recommends using Logstash instead. Why? In general, Logstash can do more stuff, here are my top three reasons:

  1. On the input side, you can filter only a subset of documents to reindex
  2. You can add filters to transform documents on their way to the new index (or indices)
  3. It should perform better, as you can add more filter threads (using the -w parameter) and multiple output worker threads (using the workers configuration option)

Show Me the Configuration!

In short, you’ll use the elasticsearch input to read existing data and the elasticsearch output to write it. In between, you can use various filters to change how documents look like.

Input

To read documents, you’ll use the elasticsearch input. You’ll probably want to specify the host(s) to connect to and the index (check the documentation for more options like query):

input {
  elasticsearch {
   hosts => ["localhost"]
   index => "old-index"
  }
}

By default, this will run a match_all query that does a scan through all the documents of the index, fetch pages of 1000, and times out in a minute (i.e. after a minute it won’t know where it left off). All this is configurable, but the defaults are sensible. Scan is good for deep paging (as normally when you fetch a page from 1000000 to 1000020, Elasticsearch fetches 1000020, sorts them, and gives back the last 20) and also works with a “snapshot” of the index (updates after the scan started won’t be taken into account).

Filter

Next, you might want to change documents in their way to the new index. For example, if the data you’re reindexing wasn’t originally indexed with Logstash, you probably want to remove the @version and/or @timestamp fields that are automatically added. To do that, you’ll use the mutate filter:

filter {
 mutate {
  remove_field => [ "@version" ]
 }
}

Output

Finally, you’ll use the elasticsearch output to send data to a new index. The defaults are once again geared towards the logging use-case. If this is not your setup, you might want to disable the default Logstash template (manage_template=false) and use yours:

output {
 elasticsearch {
   host => "localhost"
   protocol => "http"
   manage_template => false
   index => "new-index"
   index_type => "new-type"
   workers => 5
 }
}

Final Remarks

If you want to use time-based indices, you can change index to something like “logstash-%{+YYYY.MM.dd}” (this is the default), and the date would be taken from the @timestamp field. This is by default populated with the time Logstash processes the document, but you can use the date filter to replace it with a timestamp from the document itself:

filter {
 date {
   "match" => [ "custom_timestamp", "MM/dd/YYYY HH:mm:ss" ]
   target => "@timestamp"
 }
}

If your Logstash configuration contains only these snippets, it will nicely shut down when it’s done reindexing.

That’s it! We are happy answer questions or receive feedback – please drop us a line or get us @sematext. And, yes, we’re hiring!