Integrate PagerDuty with SPM Performance Monitoring

Got Alarm Fatigue?

If so, you are not alone!  We talk to a lot of people who want to reduce the frequent “noise” from monitoring alarms.  To solve this common problem, Sematext added anomaly detection for alerts and PagerDuty integration to its SPM Performance Monitoring solution to dramatically reduce this noise compared with simple threshold-based alerting mechanisms.  The integration with PagerDuty helps DevOps with incident management, i.e., managing escalation and routing alerts to the right person by defined schedules and communication channels.

PagerDuty is an alarm aggregation and dispatching service for system administrators and support teams. It collects alerts from your monitoring tools, gives you an overall view of all of your monitoring alarms, and alerts an on-duty engineer if there’s a problem. PagerDuty allows you to build sophisticated alerting rules to determine who to contact when problems occur. You can build on-call schedules to equitably share on-call responsibilities. You can also set up multiple levels of coverage, so if the “primary” on-call person doesn’t respond to an alert in a timely fashion, it’s automatically escalated to a “secondary” person, and so on.” – Source: PagerDuty FAQ.

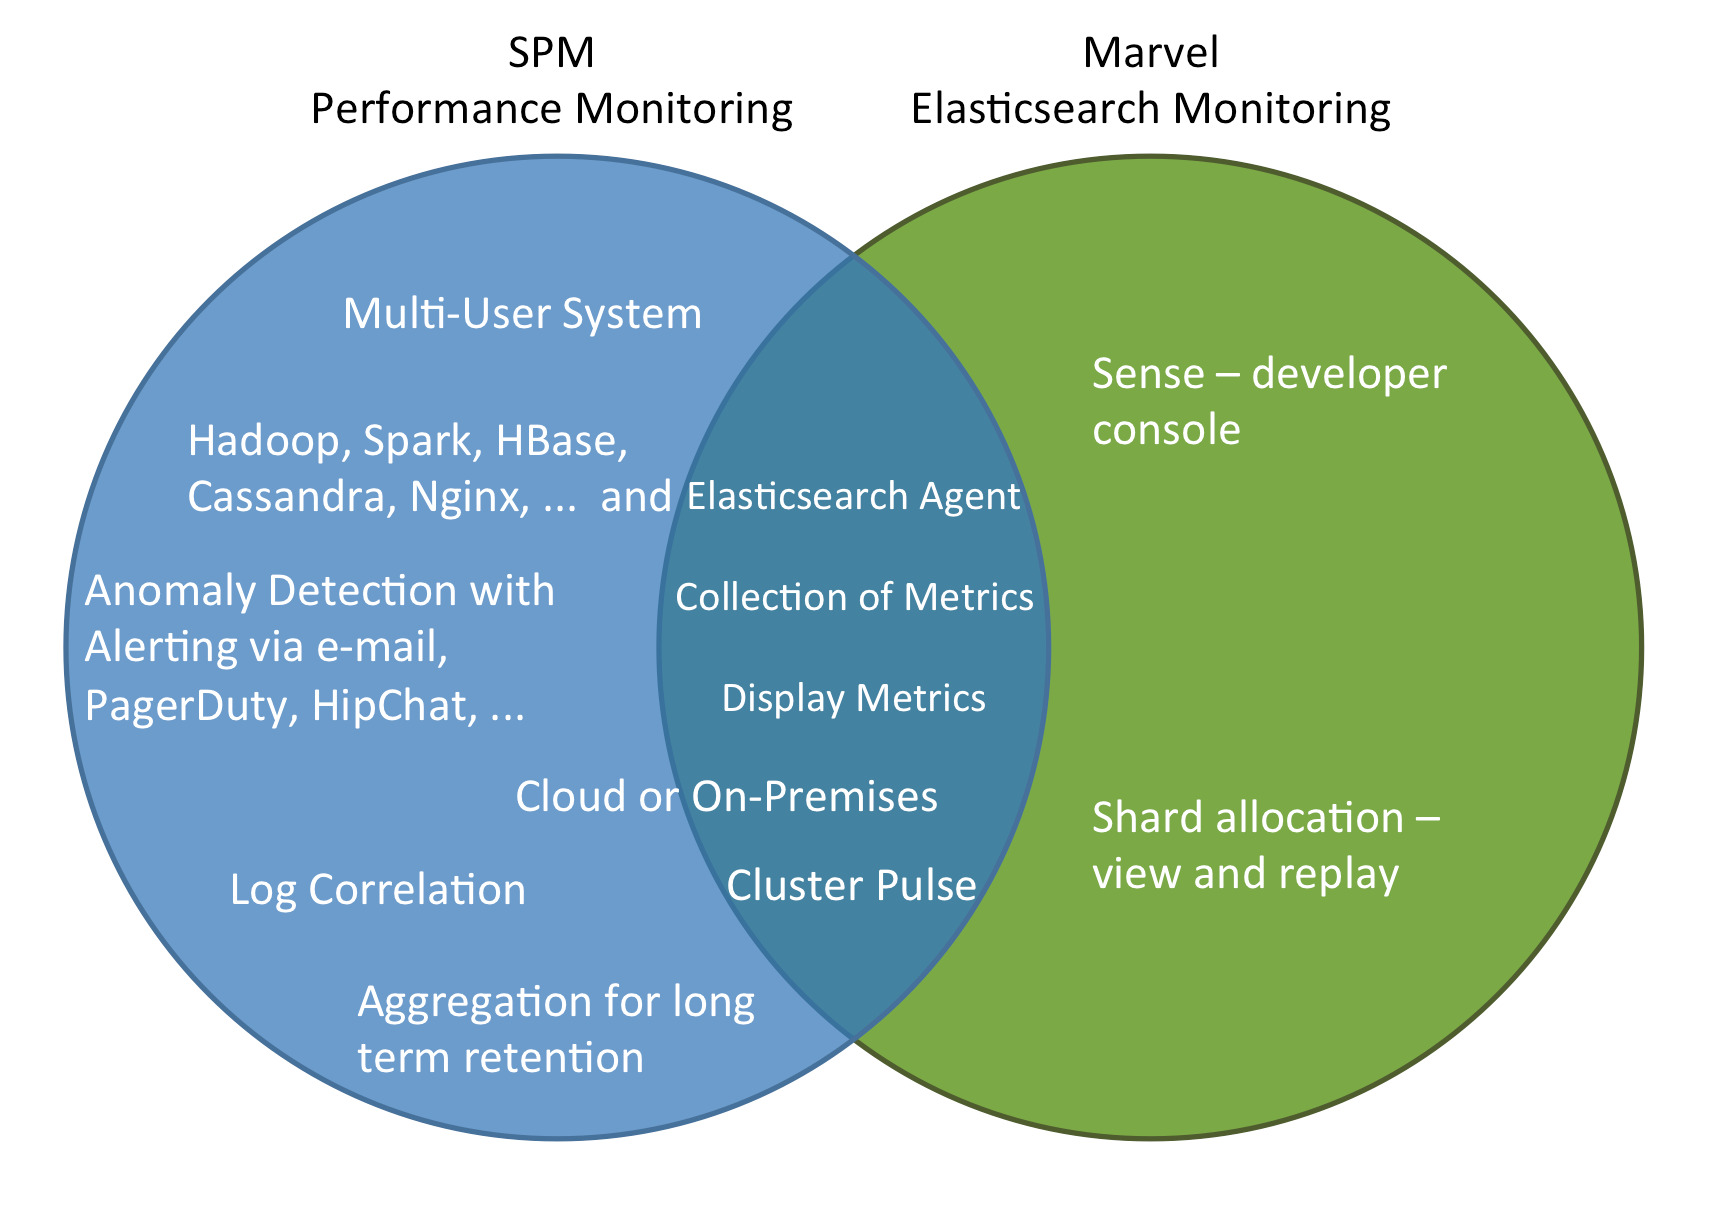
SPM Performance Monitoring is an enterprise-class, server and application performance monitoring, alerting, and anomaly detection solution. It is available both in the cloud (SaaS) and On Premises.  SPM also integrates with Logsene Log Management and Analytics to correlate metrics, alerts, anomalies, and events with application and server logs.

Get started

Basic setup steps are required to hook up both services:

  1. In PagerDuty: Get an API Key
  2. In SPM: Enter the API Key in SPM alert settings

1) In PagerDuty:

Create a new service:

  1. In your account, under the Services tab, click “Add New Service”.
  2. Select an Escalation Policy (e.g. default)
  3. Start typing “Sematext” for the Integration Type, which will narrow your filtering.
    PagerDuty add service
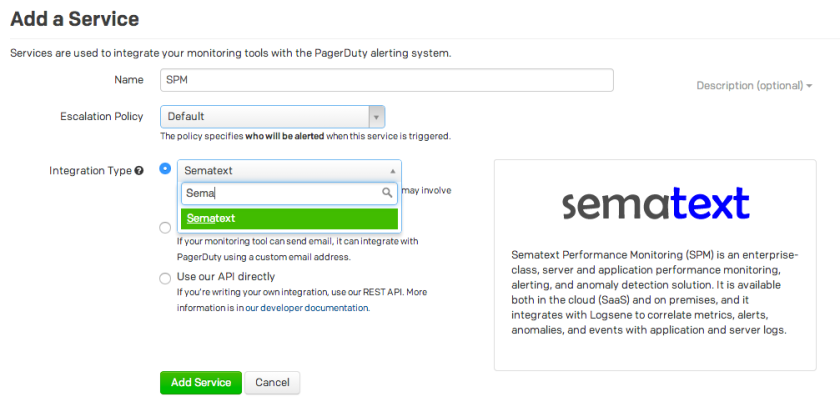
  4. Click the Add Service button
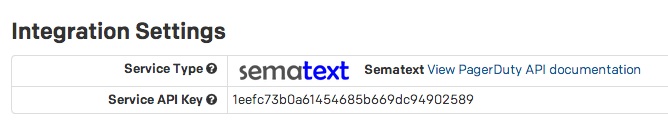
  5. Once the service is created, you’ll be taken to the Service page. On this page, you’ll see the “Service API key,” which you will need when you configure Sematext products to send events to PagerDuty. Copy the “Service API Key“ to the clipboard. PagerDuty service key

2) In SPM

1) Navigate to SPM Application Settings of your SPM App by clicking the App Settings button in the top right when you’re in the SPM UI.

 SPM - App Settings

2) Navigate to Alerts / PagerDuty

SPM - Service API Key for PagerDuty

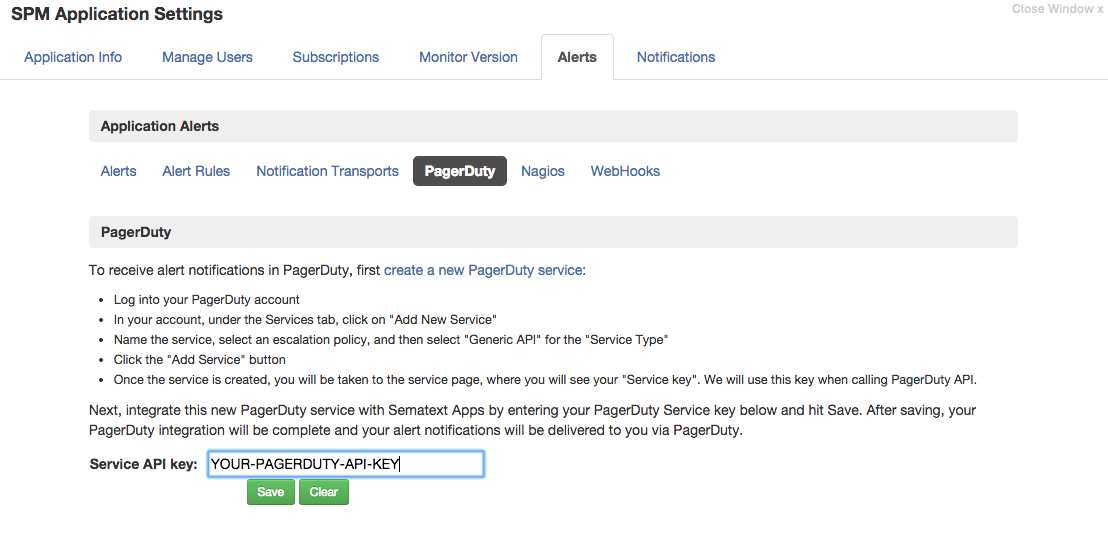
3) Enter the API key from PagerDuty in the field Service API key

4) Press the Save button

Done. Every alert from your SPM app will be forwarded to PagerDuty, where you can manage escalation policies and configure notifications to other services like HipChat, Slack, Zapier, Flowdock, and more.

If you’ve got some feedback on this post or ideas for similar posts please let us know!

Elasticsearch Monitoring: SPM vs. Marvel

While many SPM Performance Monitoring users quickly see the benefits of SPM and adopt it in their organizations for monitoring — not just for Elasticsearch, but for their complete application stack — some Elasticsearch users evaluate SPM and compare it to Marvel from Elasticsearch.  We’ve been asked about SPM vs. Marvel enough times that we decided to put together this focused comparison to show some of the key differences and help individuals and organizations pick the right tool for their needs.

Marvel is a relatively young product that provides a detailed visualization of Elasticsearch metrics in a Kibana-based UI. It installs as an Elasticsearch plug-in and includes ‘Sense’ (a developer console), plus a replay functionality for shard allocation history.

SPM, on the other hand, offers multiple agent deployment modes, has both Cloud and On Premises versions, includes alerts and anomaly detection, is not limited to Elasticsearch monitoring, integrates with third party services, etc. The following Venn diagram shows key areas that SPM and Marvel have in common and also the areas where they differ.

SPM-vs-Marvel

Looking into the details surfaces many notable differences.  For example:

  • The SPM agent can run independently from the Elasticsearch process and an upgrade of the agent does not require a restart of Elasticsearch
  • Dashboards are defined with different philosophies: Marvel exposes each Metric in a separate chart, while SPM groups related metrics together in a single chart or in adjacent charts (thus making it easy for people to have more information in a single place without needing to jump between multiple views)
  • Both have the ability to show metrics from multiple nodes in a single chart: Marvel draws a separate line for each node, while in SPM you can choose to aggregate values or display them separately.

The following “SPM vs. Marvel Comparison Table” is a starting point to evaluate monitoring products for organization’s individual needs.

SPM vs. Marvel Comparison Table

Feature SPM by Sematext Marvel by Elasticsearch
Supported Applications Elasticsearch, Hadoop, Spark, Kafka, Storm, Cassandra, HBase, Redis, Memcached, NGINX(+), Apache, MySQL, Solr, AWS CloudWatch, JVM, … Elasticsearch
Agent deployment mode in- and out-of-process
(out-of-process allows for seamless updates without requiring Elasticsearch restarts)
in-process
(as Elasticsearch plug-in; updates require Elasticsearch restarts)
Predefined dashboard graphs organized in groups YES YES
Saving Individual Dashboards Each user can store multiple dashboards, mixing charts from all applications, including both metrics and logs. Current view can be saved, reset to defaults possible. These changes are global.
API for Custom Metrics and Business KPIs YES NO
Extra Elasticsearch Metrics NO

  • Metrics are added based on user demand and users  can always graph them as Custom Metrics.
YES

  • Circuit Breakers
  • ID Cache
  • Lucene memory
  • ES Threadpools
  • Percolator
OS and JVM Metrics YES (+)

  • JVM pool sizes
  • JVM pool utilization
YES
Correlation of Metrics with Logs, Events, Alerts, and Anomalies YES

  • SPM and Logsene integration
  • Ability to ingest and chart arbitrary external Events
NO

  • Cluster Pulse displays only Elasticsearch Events
Deployment model SaaS or On Premises On Premises
Security/User Roles &
Permissions
YES NO
Easy & Secure Sharing of Reports with internal and external organizations YES

  • via short links
  • vie embeds / iframe
  • via email
NO
Machine Learning-based Anomaly Detection YES NO
Threshold based Alerts YES NO
Heartbeat Alerts YES NO
Forwarding Alerts to 3rd parties YES

  • E-Mail
  • PagerDuty
  • Nagios / Shinken
  • HipChat
  • Slack
  • Webhooks
NO
Metrics Aggregation YES

  • Pre-aggregation at multiple granularity levels, including 1 min granularity.  Advantage: more efficient storage, scales better, faster for graphing performance over longer time periods at the expense of sub-minute precision.
YES

  • Query-time aggregation. No write or query-time aggregation.
    Advantage: 10 second precision by default at the expense of storage size, write, and read performance and memory footprint.

As an aside, most of the features in this comparison table would also apply if we compared SPM to BigDesk, ElasticHQ, Statsd, Graphite, Ganglia, Nagios, Riemann, and other application-specific monitoring or alerting tools out there.

If you have any questions about this comparison or have any feedback, please let us know!

Integrating SPM Performance Monitoring with HipChat

Many agile DevOps teams rely on communication via HipChat,  which provides an API and mobile apps to receive messages while being away from one’s desktop. SPM Performance Monitoring‘s new integration via WebHooks provides the capability to forward alerts to many services, including HipChat.

The integration of both services can be achieved by collecting the room_id and an access token from HipChat and then building a WebHook in SPM.  The SPM Wiki explains how to get this information from HipChat and build the WebHook in SPM: Alerts – HipChat integration

Performance-Monitoring-Hip-Chat-Integration

This whole process only takes a minute or two.  HipChat is a tool that is becoming more popular among the DevOps crowd, and here at Sematext we pride ourselves on staying on top of what our users need and expect.

Need some extra help with this setup or another app you might want to integrate?  Have ideas for other integrations we should explore? Please drop us a line, we’re here to help and listen.