Responsible for your organization’s Apache servers? If so, you’ll be happy to hear that you can now capture metrics about your Apache web servers — along with alerting and anomaly detection, traffic spikes, dips/gaps, etc. — with SPM Performance Monitoring. This includes system-wide visibility into resource utilization, application performance, and operational health.
We’re also announcing other great new additions to SPM in the coming days to complement just-released monitoring support for MySQL, Cassandra, Memcached and AWS CloudWatch. Watch this space for details…
Here’s a glimpse into what SPM for Apache provides – click on an image to see the full view or you can look at the actual SPM live demo showing some of our own Apache servers and their metrics.
Overview (click to enlarge)

Workers (click to enlarge)

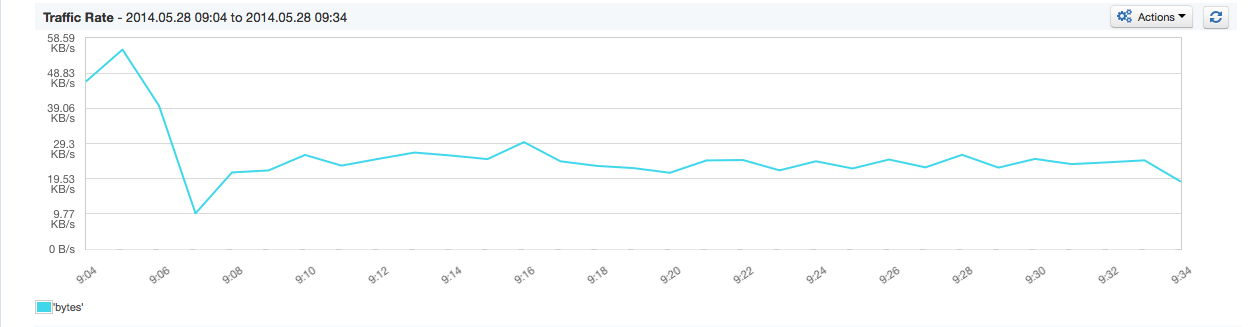
Traffic Rate (click to enlarge)
Scoreboard Serving (click to enlarge)

CPU Details (click to enlarge)

Memory Details (click to enlarge)

IO Read/Write (click to enlarge)

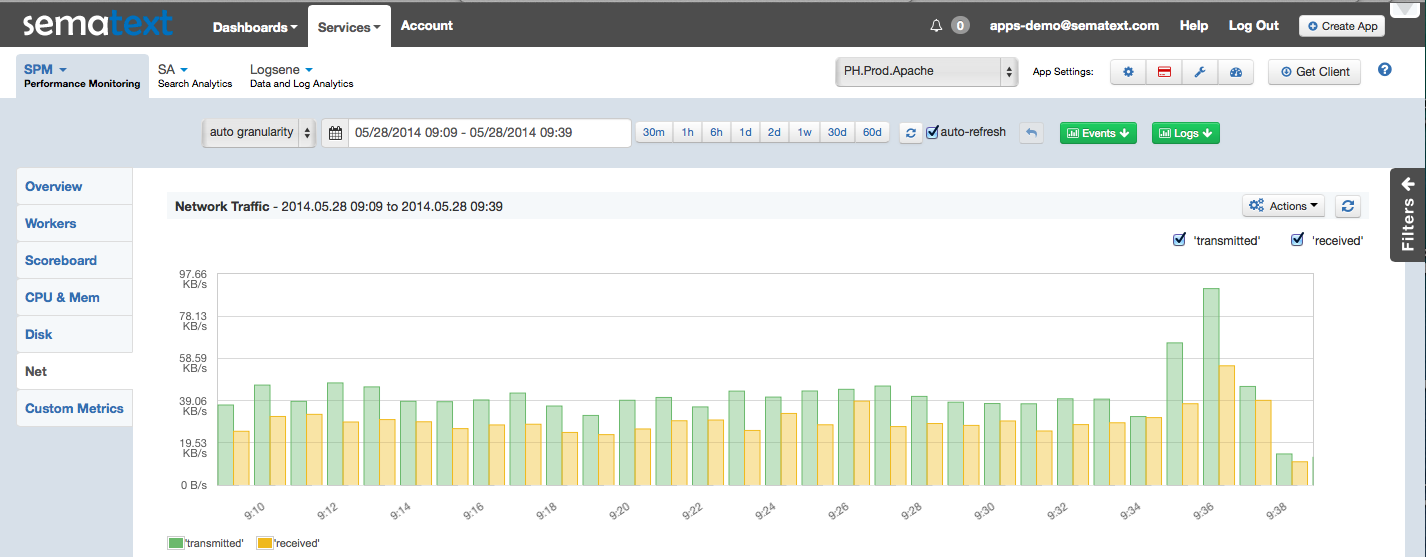
Network Traffic (click to enlarge)
Please tell us what you think – @sematext is always listening! Is there something SPM Performance Monitoring doesn’t monitor that you would really like to monitor?
Why Have Something to Just Monitor Apache?
…When you can monitor almost everything with one solution — SPM. Many organizations tackle performance monitoring with a mish-mash of different monitoring and alerting tools cobbled together in an uneasy coexistence that is often far from seamless. Think Graphite and Nagios just for Apache, and numerous other tools for…everything else. SPM takes all that hassle away and makes it easy and comprehensive in one step.
Try SPM for Free for 30 Days
Try SPM Performance Monitoring for Free for 30 days by registering here. There’s no commitment and no credit card required.
We’re Hiring!
If you enjoy performance monitoring, log analytics, or search analytics, working with projects like Elasticsearch, Solr, HBase, Hadoop, Kafka, and Storm, then drop us a line. We’re hiring planet-wide! Front end and JavaScript Developers, Developer Evangelists, Full-stack Engineers, Mobile App Developers…get in touch!
