Memcached is a high-performance, distributed memory object caching server that, despite being over 10 years old, is still used by great many organizations around the planet. While we don’t use it at Sematext, we are happy to announce our SPM Performance Monitoring platform can now monitor Memcached performance and graph Memcached stats. Of course, all the usual alerting, anomaly detection, etc. can be used with any of the Memcached metrics.
SPM currently monitors and graphs 15 different Memcached metrics, plus over 20 system metrics. Here is a partial list of the Memcached metrics SPM can monitor:
- Number of cached objects
- Number of evictions
- Number of cache hits
- Number of cache misses
- Cache hit rate
- Get/Set Rate
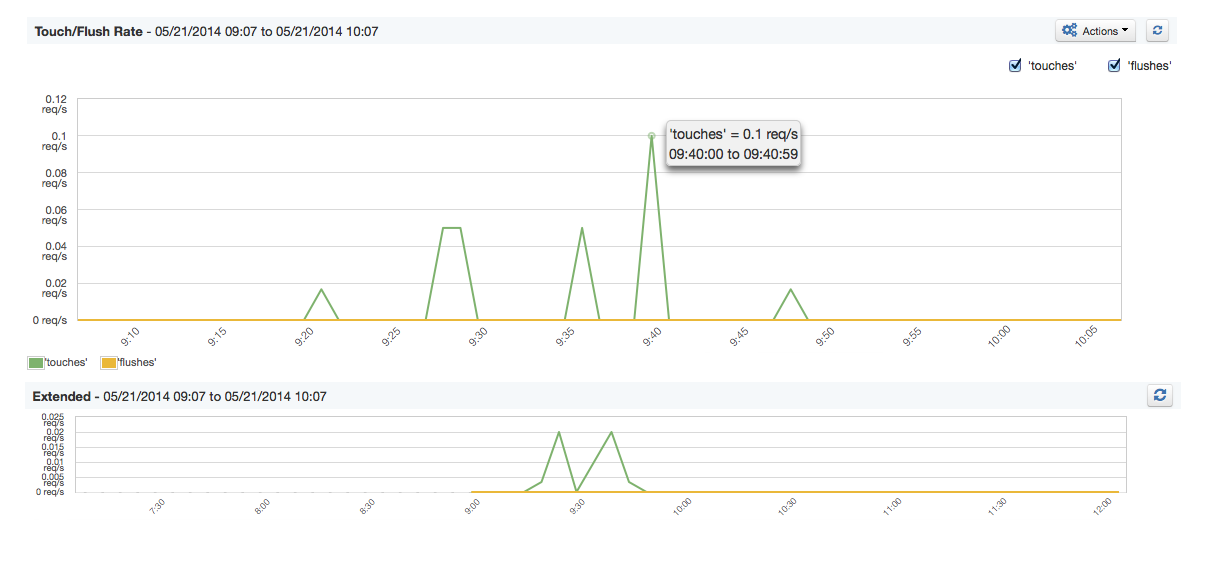
- Touch/Flush Rate
- …
Have a look at a few of the screenshots to see how we graph Memcached metrics in SPM. You can also check out SPM’s live demo. You won’t find any demo apps showing Memcached metrics, but you’ll be able to poke around and see other types of apps being monitored, like the MySQL DB monitoring demo.
Memcached Overview
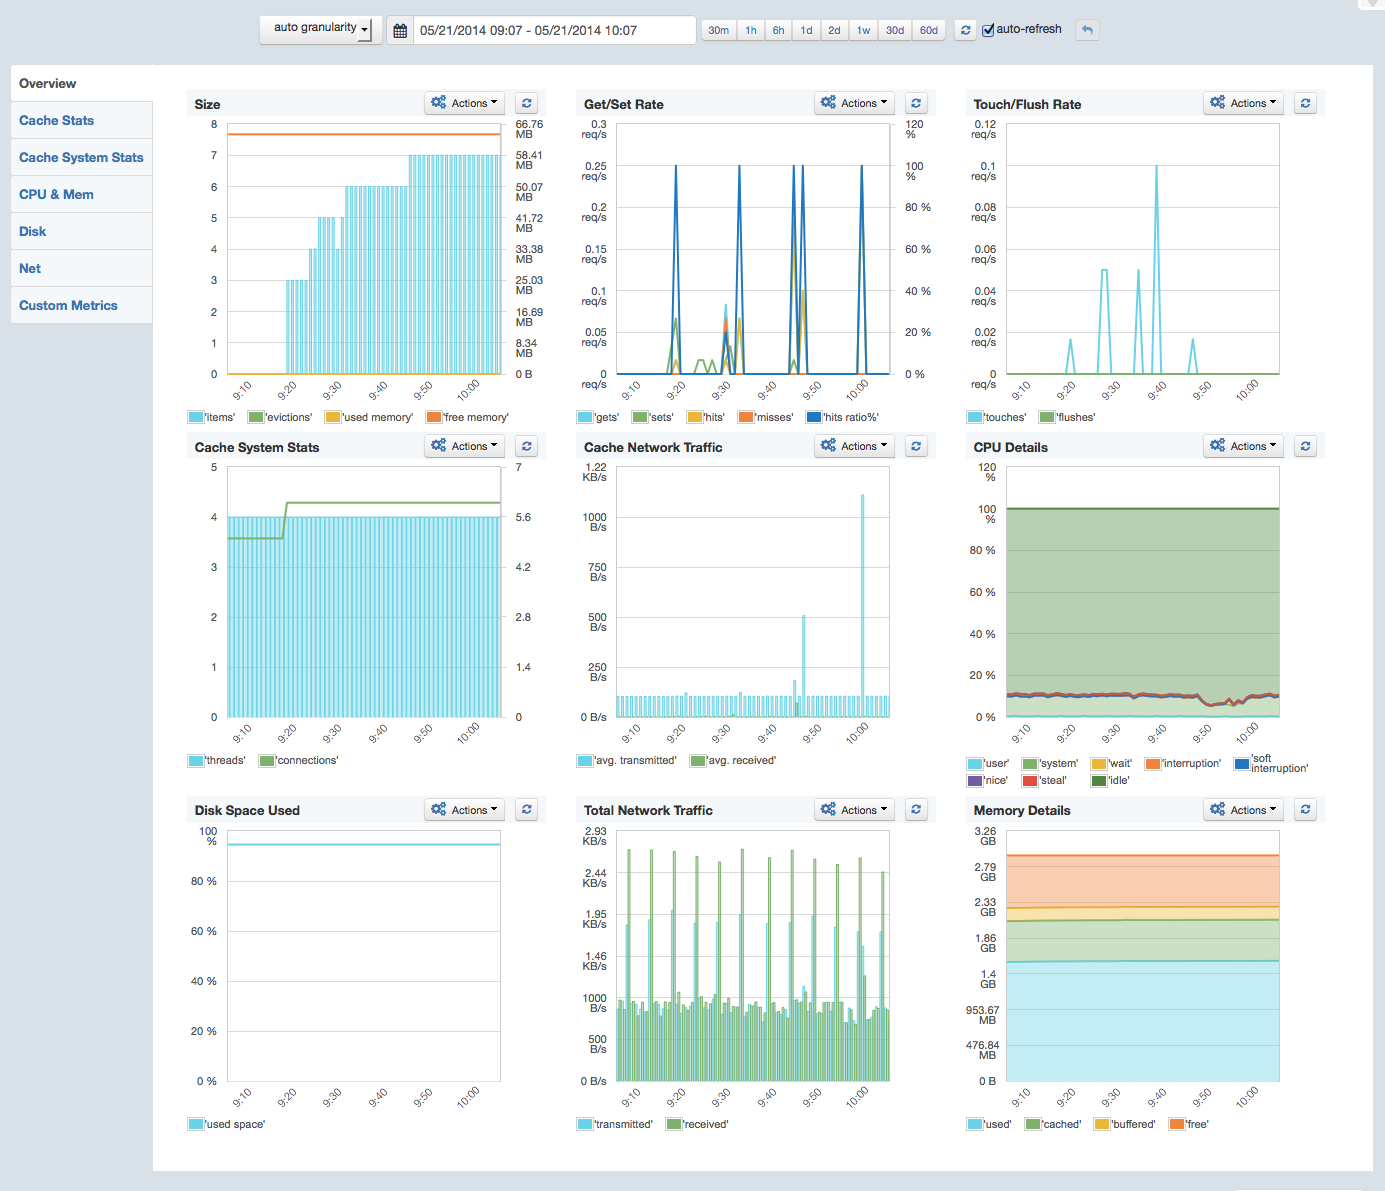
Memcached Size – number of objects, evictions, used and free memory

Memcached Request Rates – rate of gets, sets, hits, and misses, plus the hit percentage

Memcached Touch and Flush Rate
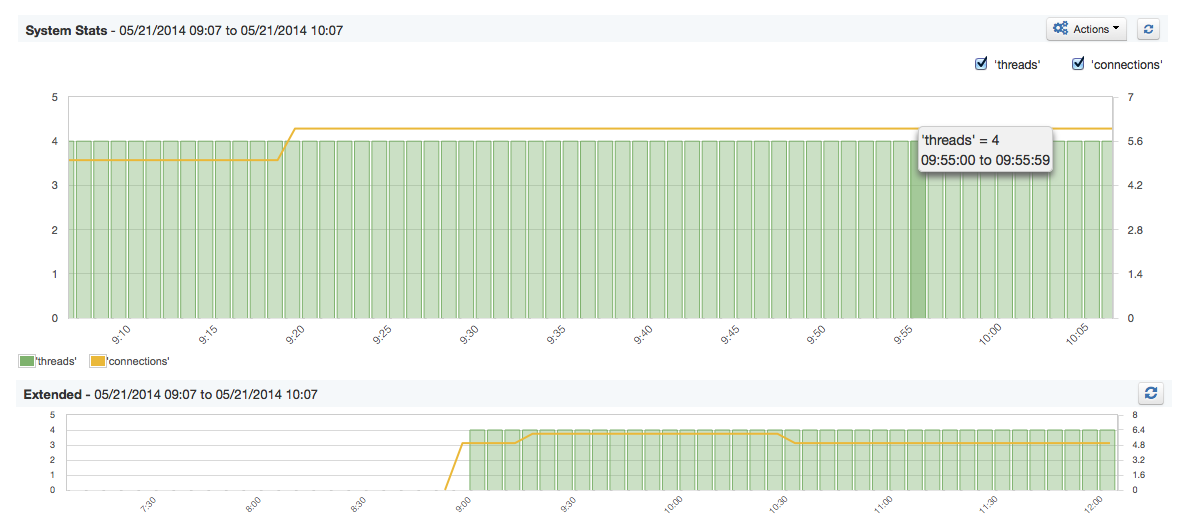
Memcached Threads and Connections
Memcached Network Traffic

Please tell us what you think – @sematext is always listening! Is there something SPM doesn’t monitor that you would really like to monitor?
Why Have Something to Just Monitor Memcached?
…When you can monitor almost everything with one solution — SPM. Many organizations tackle performance monitoring with a mish-mash of different monitoring and alerting tools cobbled together in an uneasy coexistence that is often far from seamless. Think Ganglia+Nagios. SPM takes all that hassle away and makes it easy and comprehensive in one step.
Try SPM Today for Free for 30 Days
Try SPM Performance Monitoring for Free for 30 days by registering here. There’s no commitment and no credit card required.
We’re Hiring!
If you enjoy performance monitoring, log analytics, or search analytics, working with projects like Elasticsearch, Solr, HBase, Hadoop, Kafka, and Storm, then drop us a line. We’re hiring planet-wide! Front end and JavaScript Developers, Developer Evangelists, Full-stack Engineers, Mobile App Developers…get in touch!

One thought on “Announcement: Memcached Performance Monitoring in SPM”