Presentation and Video: Side by Side with Solr and Elasticsearch

Fresh from Berlin Buzzwords where Sematext‘s own Radu Gheorghe and Rafal Kuc presented “Side by Side with Solr and Elasticsearch” on the same stage, at the same time…but in different colors.  The talk included live demos, graphing, stats, and hints at juicy things to come.  Needless to say — if you deal with Solr and Elasticsearch then there are great insights to be found here!

Here is the presentation:


And here is the video:


Want to Be on Stage Somewhere Like Radu and Rafal Talking About Solr and Elasticsearch?

Or maybe you don’t want the spotlight — that’s cool too.  But…if you do enjoy performance monitoring, log analytics, or search analytics, working with projects like Elasticsearch, Solr, HBase, Hadoop, Kafka, and Storm, then drop us a line.  We’re hiring planet-wide!  Front end and JavaScript Developers, Developer Evangelists, Full-stack Engineers, Mobile App Developers…get in touch!

[Note: for those of you who don’t have the time or inclination to go through all the technical details, here’s a high-level, up-to-date (2015) Solr vs. Elasticsearch overview]

Enjoy!

Announcement: Apache Monitoring in SPM

Responsible for your organization’s Apache servers?  If so, you’ll be happy to hear that you can now capture metrics about your Apache web servers — along with alerting and anomaly detection, traffic spikes, dips/gaps, etc. — with SPM Performance Monitoring.  This includes system-wide visibility into resource utilization, application performance, and operational health.

We’re also announcing other great new additions to SPM in the coming days to complement just-released monitoring support for MySQL, Cassandra, Memcached and AWS CloudWatch.  Watch this space for details…

Here’s a glimpse into what SPM for Apache provides – click on an image to see the full view or you can look at the actual SPM live demo showing some of our own Apache servers and their metrics.

Overview  (click to enlarge)

Apache Overview


Workers  (click to enlarge)

Apache Workers


Traffic Rate  (click to enlarge)

Apache Traffic Rate


Scoreboard Serving  (click to enlarge)

Apache Scoreboard Serving


CPU Details  (click to enlarge)

Apache CPU Details


Memory Details  (click to enlarge)

Apache Memory Details


IO Read/Write  (click to enlarge)

Apache IO Read:Write


Network Traffic  (click to enlarge)

Apache Network Traffic


Please tell us what you think – @sematext is always listening!  Is there something SPM Performance Monitoring doesn’t monitor that you would really like to monitor?

Why Have Something to Just Monitor Apache?

…When you can monitor almost everything with one solution — SPM.  Many organizations tackle performance monitoring with a mish-mash of different monitoring and alerting tools cobbled together in an uneasy coexistence that is often far from seamless.  Think Graphite and Nagios just for Apache, and numerous other tools for…everything else.  SPM takes all that hassle away and makes it easy and comprehensive in one step.

Try SPM for Free for 30 Days

Try SPM Performance Monitoring for Free for 30 days by registering here.  There’s no commitment and no credit card required.

We’re Hiring!

If you enjoy performance monitoring, log analytics, or search analytics, working with projects like Elasticsearch, Solr, HBase, Hadoop, Kafka, and Storm, then drop us a line.  We’re hiring planet-wide!  Front end and JavaScript Developers, Developer Evangelists, Full-stack Engineers, Mobile App Developers…get in touch!

Announcement: AWS CloudWatch Metrics in SPM

Wouldn’t it be great to have metrics for your AWS resources captured in one place?  And beyond just capturing them, to also have the ability to do useful things with those metrics like create custom dashboards, detect and get alerted on metric anomalies, correlate them with other application events and logs, etc., all in a single pane of glass?  Well…you can!  SPM Performance Monitoring Alerting and Anomaly Detection now captures metrics about your AWS resources via AWS CloudWatch.  This includes system-wide visibility into resource utilization, application performance, and operational health.

Why is this important?

AWS shows metrics for various AWS resources in CloudWatch available via AWS Management Console.  This is nice, but it is not very practical if you already use and prefer SPM for your non-AWS resources (e.g. servers and applications running in your data center) or if you are already shipping your logs to Logsene.  Do you really want to use another, separate UI for monitoring just your AWS resources?  It’s also not practical to use alerting in CloudWatch if you already use alerting and anomaly detection functionality in SPM. Now that SPM gathers metrics for your AWS resources you can have a single place to see all your metrics, alerts, and anomalies.

Today we are exposing all Elastic Cloud Compute (EC2), Elastic Load Balancer (ELB), and Elastic Block Store (EBS) metrics in SPM.  We will continue to add other AWS services to this list.  Having AWS metrics in SPM means that you can apply not only threshold-based alerting to your AWS metrics, which AWS itself provides, but also SPM Anomaly Detection which is much more useful and which AWS CloudWatch does not offer.

Headache-relieving and Time-saving Benefits for Your Organization

Major benefits to using SPM to monitor AWS CloudWatch include:

  • there is nothing to install (i.e., it’s all agentless)
  • AWS cost and performance optimization
  • increase in transparency (i.e., now that AWS metrics are in a common monitoring app more people in your organization can see what you have running in AWS)

Have a look at a few of the screenshots to see some of the AWS metrics SPM graphs.  You can also check out SPM’s live demo. Or, if you prefer to see the full list of AWS metrics SPM captures, just jump down past the screenshots to see them listed below.

EBS Read/Write Bandwidth  (click to enlarge)

AWS_EBS Read:Write Bandwidth


EBS Read/Write Latency  (click to enlarge)

AWS_EBS Read:Write Latency


EC2 CPU Utilization  (click to enlarge)

AWS_EC2 CPU Utilization


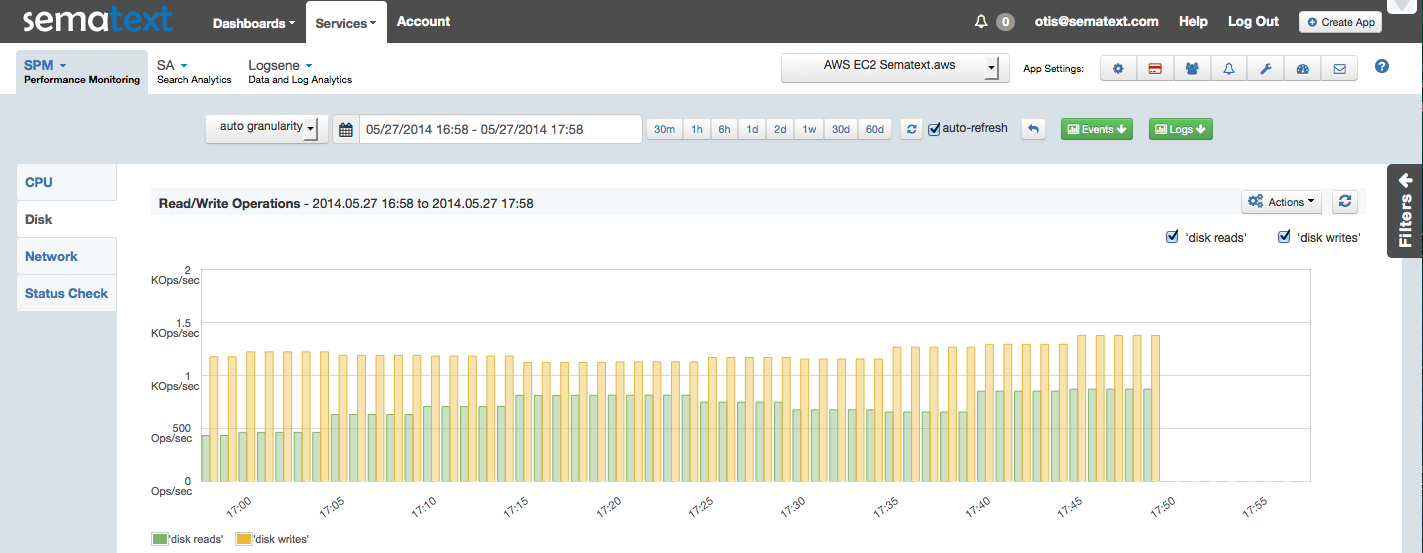
EC2 Read/Write Operations per Second  (click to enlarge)

AWS_EC2 Read:Write Operations


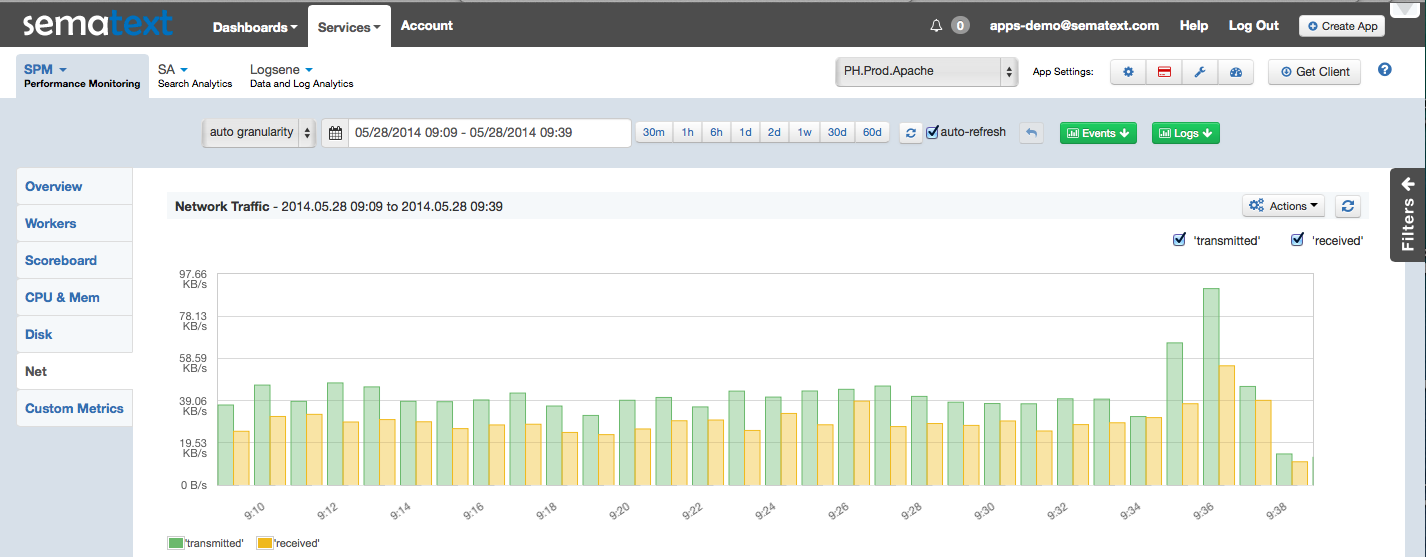
EC2 Network In/Out  (click to enlarge)

AWS_EC2 Network In:Out


ELB Backend 2XX/3XX/4XX/5XX Response Counts  (click to enlarge)

AWS_ELB Backend Responses


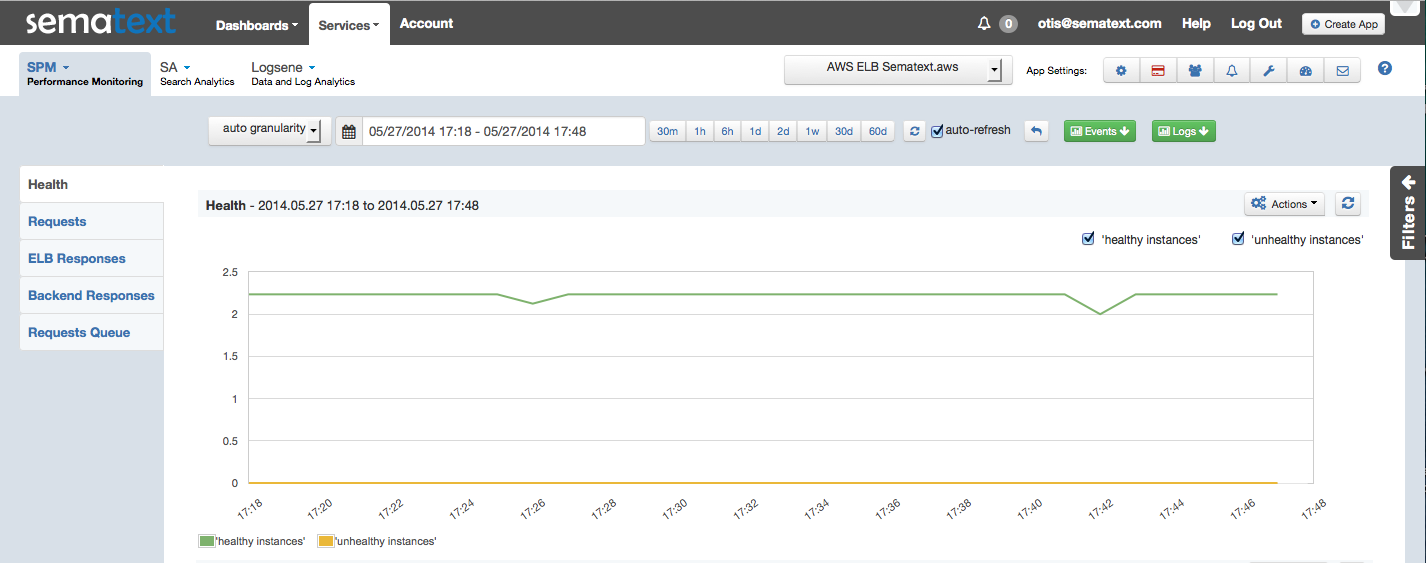
ELB Healthy and Unhealthy Instance Counts  (click to enlarge)

AWS_ELB Healthy:Unhealthy Instances


ELB Request Count  (click to enlarge)

AWS_ELB Requests Count

AWS Metrics List

Here is the complete list of AWS metrics that SPM gathers as of today:

EC2:

  • CPU Utilization
  • Disk Read Operations
  • Disk Write Operations
  • Disk Read Bytes
  • Disk Write Bytes
  • Network In
  • Network Out
  • Status Check Failed
  • Status Check Failed (Instance)
  • Status Check Failed (System)

ELB:

  • Healthy Host Count
  • UnHealthy Host Count
  • Request Count
  • Latency
  • ELB 4XX Responses Count
  • ELB 5XX Responses Count
  • Backend 2XX Responses Count
  • Backend 3XX Responses Count
  • Backend 4XX Responses Count
  • Backend 5XX Responses Count
  • Backend Connection Errors Count
  • Surge Queue Length
  • Spillover Count

EBS:

  • Volume Read Bytes
  • Volume Write Bytes
  • Volume Read Ops
  • Volume Write Ops
  • Volume Total Read Time
  • Volume Total Write Time
  • Volume Idle Time
  • Volume Queue Length

Metrics available for IOPS provisioned instances:

  • VolumeThroughputPercentage
  • VolumeConsumedReadWriteOps

Please tell us what you think – @sematext is always listening!  Is there something SPM Performance Monitoring doesn’t monitor that you would really like to monitor?

Try SPM for Free for 30 Days

Try SPM Performance Monitoring for Free for 30 days by registering here.  There’s no commitment and no credit card required.

We’re Hiring!

If you enjoy performance monitoring, log analytics, or search analytics, working with projects like Elasticsearch, Solr, HBase, Hadoop, Kafka, and Storm, then drop us a line.  We’re hiring planet-wide!  Front end and JavaScript Developers, Developer Evangelists, Full-stack Engineers, Mobile App Developers…get in touch!

Podcast: Tools to Monitor Solr, Manage Logs & Analyze Search Trends

Sematext Founder & President Otis Gospodnetic recently spoke with LucidWorks Chief of Product, Will Hayes as part of their SolrCluster podcast series.  Otis and Will discussed tools that Sematext has built to help monitor Solr and other stacks, manage and analyze logs, and analyze search trends.  They also discuss Solr/SolrCloud and Elasticsearch, their APIs, developer friendliness, as well as the general direction that search and big data industry leaders are moving toward around data acquisition and discovery as data increasingly grows.

Go here to listen to the podcast.  It runs about 36 minutes.  Enjoy!

Announcement: MySQL Performance Monitoring in SPM

We live in the “data era”.  A database of one kind or another lives at the core of virtually every application on the planet.  As such, you better monitor your database performance and availability metrics and you better have alerting and anomaly detection mechanisms to notify you when things go awry before your users start calling you and the spiky-haired boss storms in.

We’re happy to announce MySQL performance monitoring being added to our SPM Performance Monitoring platform.  The addition of MySQL monitoring complements Memcached performance monitoring we announced earlier today, HBase monitoring as well as the Redis monitoring we added earlier this year.  We’re also announcing other great new additions to SPM in the coming days.  Watch this space for details…

The latest release of SPM covers over 150 different MySQL metrics you can monitor, such as:

  • Availability
  • Replication
  • Connections
  • Slow queries
  • Cache
  • Data in/out
  • …and many more

Here’s a glimpse into what SPM for MySQL provides – click on an image to see the full view or look at the actual SPM live demo:

MySQL Overview

MySQL Overview


MySQL Runtime

MySQL Runtime


MySQL Queries/Questions Rate

MySQL_Queries:Questions Rate


MySQL Cache Usage

MySQL Cache Usage


MySQL Table Stats

MySQL Table Stats


Please tell us what you think – @sematext is always listening!  Is there something SPM doesn’t monitor that you would really like to monitor?

Why Have Something to Just Monitor MySQL?

…When you can monitor almost everything with one solution — SPM.  Many organizations tackle performance monitoring with a mish-mash of different monitoring and alerting tools cobbled together in an uneasy coexistence that is often far from seamless.   Think Ganglia+Nagios.   SPM takes all that hassle away and makes it easy and comprehensive in one step.

Try SPM Today for Free for 30 Days

Try SPM Performance Monitoring for Free for 30 days by registering here.  There’s no commitment and no credit card required.

We’re Hiring!

If you enjoy performance monitoring, log analytics, or search analytics, working with projects like Elasticsearch, Solr, HBase, Hadoop, Kafka, and Storm, then drop us a line.  We’re hiring planet-wide!  Front end and JavaScript Developers, Developer Evangelists, Full-stack Engineers, Mobile App Developers…get in touch!


Announcement: Memcached Performance Monitoring in SPM

Memcached is a high-performance, distributed memory object caching server that, despite being over 10 years old, is still used by great many organizations around the planet. While we don’t use it at Sematext, we are happy to announce our SPM Performance Monitoring platform can now monitor Memcached performance and graph Memcached stats.  Of course, all the usual alerting, anomaly detection, etc. can be used with any of the Memcached metrics.

SPM currently monitors and graphs 15 different Memcached metrics, plus over 20 system metrics.  Here is a partial list of the Memcached metrics SPM can monitor:

  • Number of cached objects
  • Number of evictions
  • Number of cache hits
  • Number of cache misses
  • Cache hit rate
  • Get/Set Rate
  • Touch/Flush Rate

Have a look at a few of the screenshots to see how we graph Memcached metrics in SPM.  You can also check out SPM’s live demo. You won’t find any demo apps showing Memcached metrics, but you’ll be able to poke around and see other types of apps being monitored, like the MySQL DB monitoring demo.

Memcached Overview

memcached-overview


Memcached Size – number of objects, evictions, used and free memory

memcached-cache stats-size


Memcached Request Rates – rate of gets, sets, hits, and misses, plus the hit percentage

memcached-cache stats-get_set_rate


Memcached Touch and Flush Rate

memcached-cache stats-touch_flush_rate


Memcached Threads and Connections

memcached-cache system stats-system stats


Memcached Network Traffic

memcached-cache system stats-cache network traffic

Please tell us what you think – @sematext is always listening!  Is there something SPM doesn’t monitor that you would really like to monitor?

Why Have Something to Just Monitor Memcached?

…When you can monitor almost everything with one solution — SPM.  Many organizations tackle performance monitoring with a mish-mash of different monitoring and alerting tools cobbled together in an uneasy coexistence that is often far from seamless.  Think Ganglia+Nagios. SPM takes all that hassle away and makes it easy and comprehensive in one step.

Try SPM Today for Free for 30 Days

Try SPM Performance Monitoring for Free for 30 days by registering here.  There’s no commitment and no credit card required.

We’re Hiring!

If you enjoy performance monitoring, log analytics, or search analytics, working with projects like Elasticsearch, Solr, HBase, Hadoop, Kafka, and Storm, then drop us a line.  We’re hiring planet-wide!  Front end and JavaScript Developers, Developer Evangelists, Full-stack Engineers, Mobile App Developers…get in touch!

Berlin Buzzwords 2014 – Side by Side with Elasticsearch and Solr

Last year at Berlin Buzzwords two Sematext Engineers had the opportunity to give two talks. Radu talked about “JSON Logging with Elasticsearch” (video, slides) and Rafał did the second round of Solr vs Elasticsearch in his talk “Battle of the Giants, round 2” (video, slides). We were also happy to be sponsoring Berlin Buzzwords 2013. This year, we decided to go for a talk where two of us can talk on the same stage, at the same time. On Tuesday, 27th of May, at 11:30, in the Frannz Club Radu and Rafał will be giving a talk called “Side by side with Solr and Elasticsearch“.

side by side

Solr – established, mature and well known open-source search server, commonly used. Elasticsearch – still young, but quickly gaining popularity, with over 200k downloads per month. Both search servers are based on Lucene – the open-source full text searching Java library, but each with their own extensions, their pros and cons.

We all know that Solr and Elasticsearch are different, but what those differences are and which solution is the best fit for a particular use case is a frequent question. We will try to make those differences clear, not by showing slides and comparing them, but by showing on online demo of both Elasticsearch and Solr:

  • Set up and start both search servers. See what you need to prepare and launch Solr and Elasticsearch.
  • Index data right after the server was started using the “schemaless” mode
  • Create index structure and modify it using the provided API
  • Explore different query use cases
  • Scale by adding and removing nodes from the cluster, creating indices and managing shards. See how that affects data indexing and querying.
  • Monitor and administer clusters.  See what metrics can be seen out of the box, how to get them and what tools can provide you with the graphical view of all the goodies that each search server can provide.

If you want to come, hear about both Solr and Elasticsearch from @sematext and how to achieve similar things, what how they behave and don’t see too many slides, come join us 🙂

Elasticsearch Server by Rafal Kuc & Marek Rogozinski – now updated!

Use Elasticsearch now?  Thinking about using Elasticsearch?  Wish there was a comprehensive resource that pulled everything you ever wanted to know about Elasticsearch together in one place?  Fret not — you are in luck!

All Elasticsearch, all the time

Sematext engineer Rafał Kuć has co-authored (with Marek Rogozinski) not one, but two(!) different Elasticsearch books: Elasticsearch Server and Mastering Elasticsearch.  Considering that Elasticsearch has only been around a few years — not to mention how much is going on under the hood — it’s a pretty impressive accomplishment.  Even more impressive?  Rafal and Marek have just published a second edition of Elasticsearch Server that encompasses all the changes between Elasticsearch 0.20 and 1.0.  So if you wish you knew more about Elasticsearch, look no further.

Here’s a brief Q&A with Rafal to add some insight:

Q:  What has changed since the first edition of Elasticsearch Server?

A:  After releasing the first edition of the book, which happened to be the first book about Elasticsearch, we got a nice amount of comments and suggestions which we took into consideration when writing the second edition.  The first edition was based on Elasticsearch 0.20, so we already had a lot of material to work with when we were asked to write the second edition and take readers up to version 1.0.  Some of the features we decided to write about were aggregations, new function queries allowing extensive score control, snapshotting, and others.  Some features that are still used by Elasticsearch users, like faceting, did not need much updating.  But others, like percolator, had to be completely rewritten.

Q:  How much work was it?

A:  We tried to make the book as good as we could so the readers could enjoy it and learn from it.  And believe me, we both learned a lot during the writing of the first edition of the book and while writing Mastering Elasticsearch. We had a lot of comments both from the readers and from people working on the book’s Japanese translation.  Thanks Jun!

We incorporated all the comments and suggestion, but it took time, of course. We also wanted to fully restructure the book so that it flowed better.  Hopefully we achieved that. Of course, in addition to all that we had to rewrite major parts of the book to bring it up to date, review all the parts that we decided to leave in the book and make updates as needed, and then write the new sections.

Q:  Where can someone buy it?

A:  You can buy it from Amazon or direct from Packt Publishing.