Don’t worry, we didn’t just stop at Storm monitoring and metrics while improving SPM. We’re also happy to announce support for Redis.
Specifically, here are some of the key Redis metrics SPM monitors:
Used Memory
Used Memory Peak
Used Memory RSS
Connected Clients
Connected Slaves
Master Last IO Seconds Ago
Keyspace Hits
Keyspace Misses
Evicted Keys
Expired Keys
Commands Processed
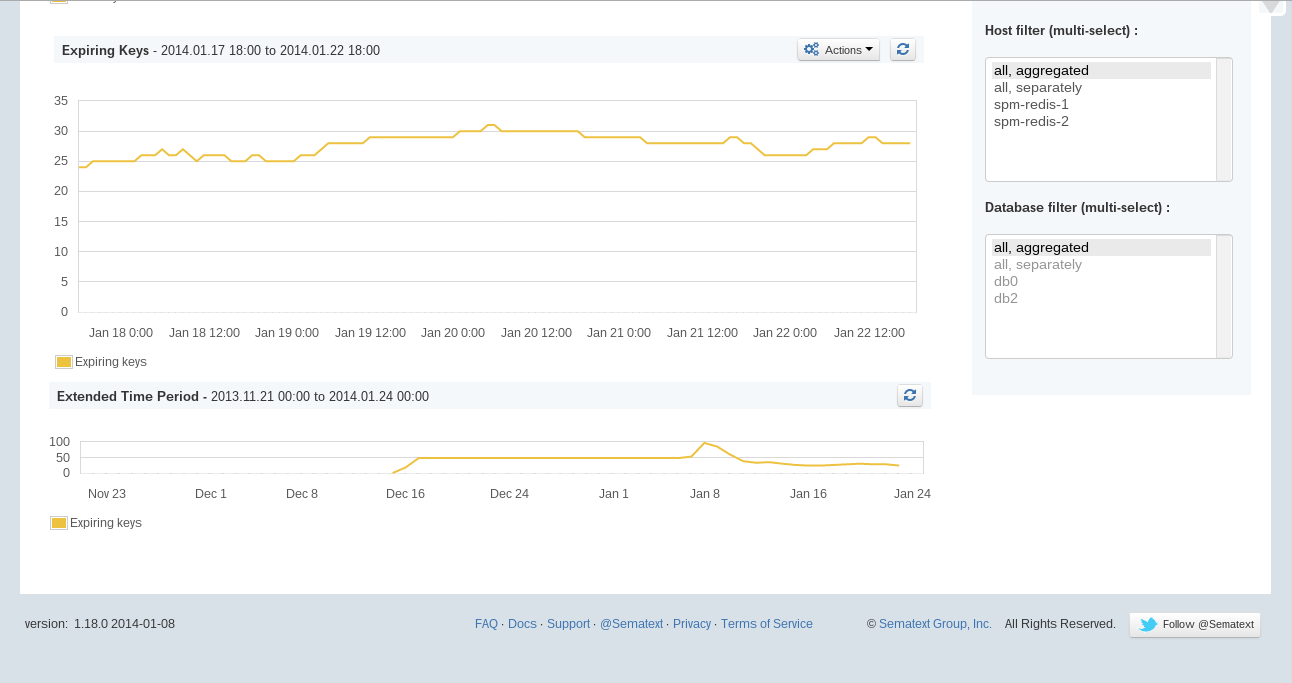
Keys count per db
To be expired keys count per db
Also, for all application types users can add alerting rules, heartbeat alerts, and Algolerts, as well as receive emails with performance reports for a given time period.
Enough with the words, these are what the graphs look like — click them to enlarge them:
Redis-Overview
Redis-Memory
Used memory/Used memory peak/Used memory RSS chart
Redis-Keyspace-Hits
Keyspace Hits chart
Redis-Expiring-Keys
Expiring Keys chart
Redis-Evicted-Keys
Evicted Keys chart
And we’re not done. Watch this space for more SPM updates coming soon…
Give SPM a spin – it’s free to get going and you’ll have it up and running, graphing all your Redis metrics in 5 minutes!
If you enjoy performance monitoring, log analytics, or search analytics, working with projects like Elasticsearch, Solr, HBase, Hadoop, Kafka, Storm, we’re hiring planet-wide!
There has been a “storm” brewing here at Sematext recently. Fortunately this has nothing to do with the fierce winter weather many of us are experiencing in different parts of the globe — it’s actually a good kind of storm! We’ve gotten a lot of requests to add Apache Storm support to SPM and we’re please to say that is now a reality. SPM can already monitor Kafka, ZooKeeper, Hadoop, Elasticsearch, and more. As a matter of fact, we’ve just announced Redis monitoring, too!
Here’s why you should care:
SPM users can see different Storm metrics in dynamic , real-time graphs, a big improvement from the standard Storm UI which only allows some time-specific snapshots. Isn’t it better to see trends as opposed to static snapshots? We certainly think so.
SPM users can create an external link and share their charts with others (like a Mailing List or in a blog post) to get insight into problems without having to provide login credentials. Here’s an example (you will see the chart even though you don’t know UN/PW): https://apps.sematext.com/spm-reports/s/aQjuv5GdC1
SPM also provides its users with common System and JVM-related metrics like CPU usage, memory usage, JVM heap size and pool utilization, among others. This lets you troubleshoot performance issues better by allowing you to correlate Storm-specific metrics with common System and JVM metrics.
…
Here are the Storm metrics SPM can now monitor:
Supervisors count
Topologies count
Supervisor total/free/used slots count
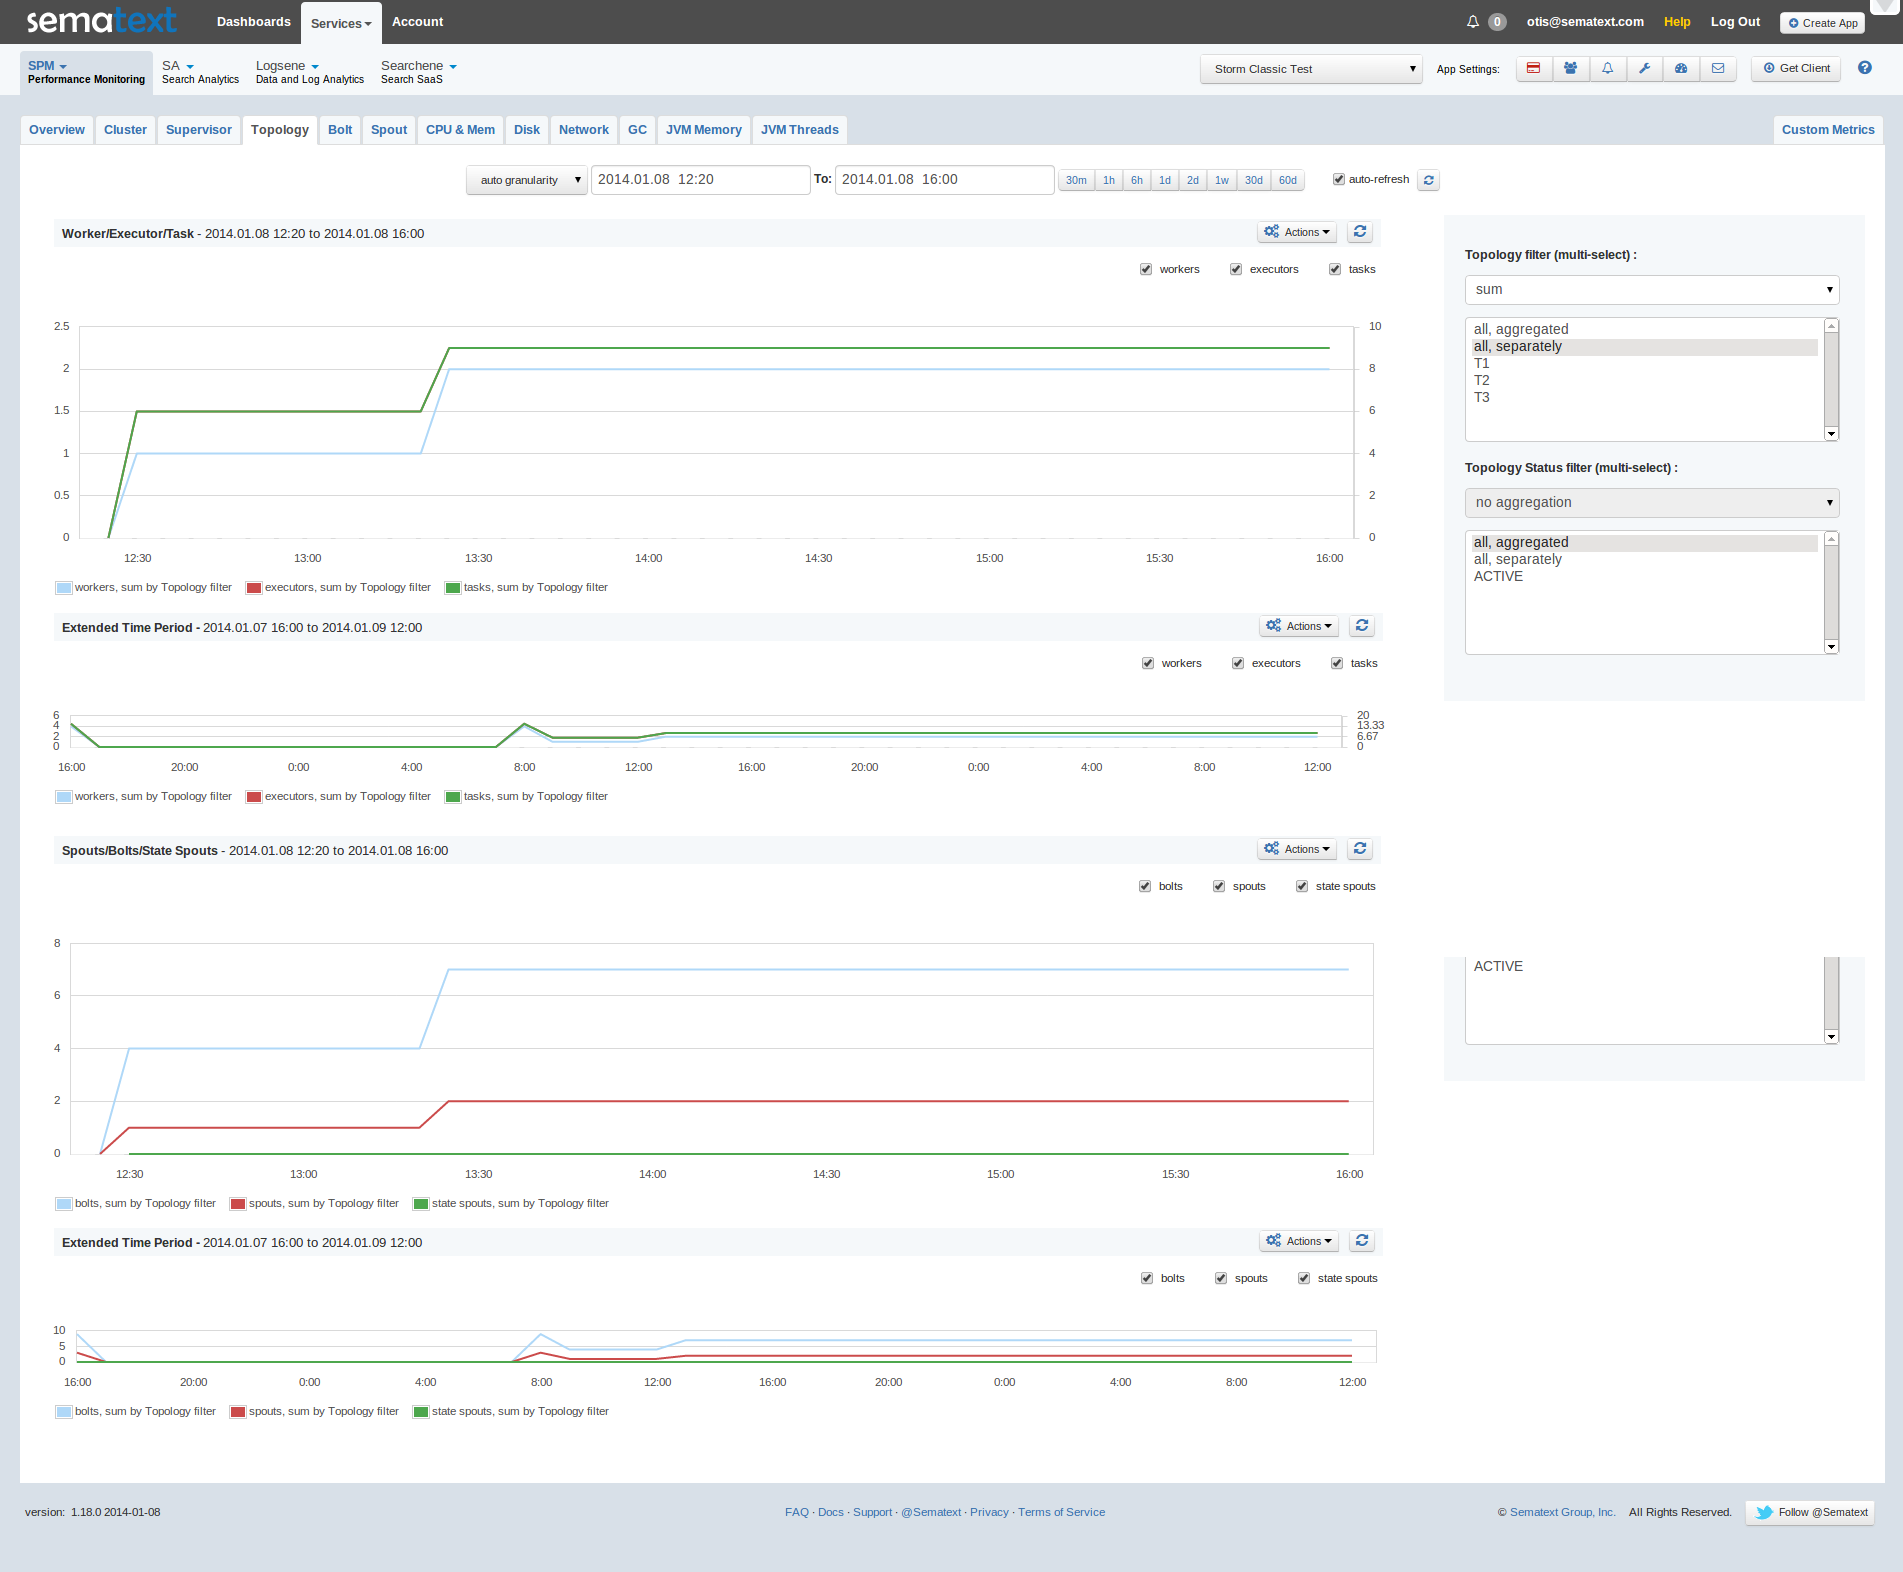
Topology workers/executors/tasks count
Topology spouts/bolts/state spouts count
Bolt emitted/transferred events
Bolt acked/executed/failed events
Bolt executed/processed latencies
Spout emitted/transferred events
Spout acked/failed events
Spout complete latency
Also important to note — users can add alerting rules for all metrics, including Algolerts and heartbeat alerts, as well as receive daily, weekly, and monthly performance reports via email.
Here are some of the graphs — click on them to see larger versions:
Overview
For observing the general state of the system
Acked-Failed Decrease
Do you see how “acked” (blue line) decreased? It may be related to some problems with resources (e.g., CPU load)
Timing-Increased
Check out this “Timing” chart: see the spike at ~13:21? It seems that something is up with the CPU (again); it might be the “pressure” from Java GC (Garbage Collector)
Start-Topology-Workers
On the first chart you can see how the counts of tasks and workers grew. It is because a new topology (“job” in Storm terminology) started at 12:25.
Start-Topology
The same as above: you can see that between 12:00 and 12:30 Storm Supervisor was restarted (something that works on each machine inside the cluster) and topology was added after restarting.
Give SPM a spin – it’s free to get going and you’ll have it up and running, graphing all your Storm metrics in 5 minutes!
If you enjoy performance monitoring, log analytics, or search analytics, working with projects like Elasticsearch, Solr, HBase, Hadoop, Kafka, Storm, we’re hiring planet-wide!
Recently, the first rsyslog version 8 release was announced. Major changes in its core should give outputs better performance, and the one for Elasticsearch should benefit a lot. Since we’re using rsyslog and Elasticsearch in Sematext‘s own Logsene, we had to take the new version for a spin.
The Weapon and the Target
For testing, we used a good-old i3 laptop, with 8GB of RAM. We generated 20 million logs, sent them to rsyslog via TCP and from there to Elasticsearch in the Logstash format, so they can get explored with Kibana. The objective was to stuff as many events per second into Elasticsearch as possible.
Rsyslog Architecture Overview
In order to tweak rsyslog effectively, one needs to understand its architecture, which is not that obvious (although there’s an ongoing effort to improve the documentation). The gist of it its architecture represented in the figure below.
you have input modules taking messages (from files, network, journal, etc.) and pushing them to a main queue
one or more main queue threads take those events and parse them. By default, they parse syslog formats, but you can configure rsyslog to use message modifier modules to do additional parsing (e.g. CEE-formatted JSON messages). Either way, this parsing generates structured events, made out of properties
after parsing, the main queue threads push events to the action queue. Or queues, if there are multiple actions and you want to fan-out
for each defined action, one or more action queue threads takes properties from events according to templates, and makes messages that would be sent to the destination. In Elasticsearch’s case, a template should make Elasticsearch JSON documents, and the destination would be the REST API endpoint
rsyslog message flow
There are two more things to say about rsyslog’s architecture before we move on to the actual test:
you can have multiple independent flows (like the one in the figure above) in the same rsyslog process by using rulesets. Think of rulesets as swim-lanes. They’re useful for example when you want to process local logs and remote logs in a completely separate manner
queues can be in-memory, on disk, or a combination called disk-assisted. Here, we’ll use in-memory because they’re the fastest. For more information about how queues work, take a look here
Configuration
To generate messages, we used tcpflood, a small and light tool that’s part of rsyslog’s testbench. It generates messages and sends them over to the local syslog via TCP.
Rsyslog took received those messages with the imtcp input module, queued them and forwarded them to Elasticsearch 0.90.7, which was also installed locally. We also tried with Elasticsearch 1.0 Beta 1 and got the same results (see below).
The flow of messages in this test is represented in the following figure:
Flow of messages in this test
The actual rsyslog config is listed below. It can be tuned further (for example by using the multithreaded imptcp input module), but we didn’t get significant improvements.
module(load="imtcp")   # TCP input module
module(load="omelasticsearch") # Elasticsearch output module

input(type="imtcp" port="13514")  # where to listen for TCP messages

main_queue(
    queue.size="1000000" # capacity of the main queue
    queue.dequeuebatchsize="1000" # process messages in batches of 1000
    queue.workerthreads="2" # 2 threads for the main queue
)

# template to generate JSON documents for Elasticsearch
template(name="plain-syslog"
         type="list") {
           constant(value="{")
             constant(value="\"@timestamp\":\"")      property(name="timereported" dateFormat="rfc3339")
             constant(value="\",\"host\":\"")        property(name="hostname")
             constant(value="\",\"severity\":\"")    property(name="syslogseverity-text")
             constant(value="\",\"facility\":\"")    property(name="syslogfacility-text")
             constant(value="\",\"syslogtag\":\"")   property(name="syslogtag" format="json")
             constant(value="\",\"message\":\"")    property(name="msg" format="json")
             constant(value="\"}")
         }

action(type="omelasticsearch"
       template="plain-syslog"  # use the template defined earlier
       searchIndex="test-index"
       bulkmode="on"
       queue.dequeuebatchsize="5000"   # ES bulk size
       queue.size="100000"
       queue.workerthreads="5"
       action.resumeretrycount="-1"  # retry indefinitely if ES is unreachable
)
You can see from the configuration that:
both main and action queues have a defined size in number of messages
both have number of threads that deliver messages to the next step. The action needs more because it has to wait for Elasticsearch to reply
moving of messages from the queues happens in batches. For the Elasticsearch output, the batch of messages is sent through the Bulk API, which makes queue.dequeuebatchsize effectively the bulk size
Results
We started with default Elasticsearch settings. Then we tuned them to leave rsyslog with a more significant slice of the CPU. We measured the indexing rate with SPM. Here are the average results over 20 million indexed events:
with default Elasticsearch settings, we got 8,000 events per second
after setting Elasticsearch up more production-like (5 second refresh interval, increased index buffer size, translog thresholds, etc), and the throughput went up to average of 20,000 events per second
in the end, we went berserk and used in-memory indices, updated the mapping to disable any storing or indexing for any field, to have Elasticsearch do as little work as possible and make room for rsyslog. Got an average of 30,000 events per second. In this scenario, rsyslog was using between 1 and 1.5 of the 4 virtual CPU cores, with tcpflood using 0.5 and Elasticsearch using from 2 to 2.5
Conclusion
20K EPS on a low-end machine with production-like configuration means Elasticsearch is quick at indexing. This is very good for logs, where you typically have lots of messages being generated, compared to how often you search.
If you need some tool to ship your logs to Elasticsearch with minimum overhead, rsyslog with its new version 8 may well be your best bet.
During last year’s Lucene Revolution conference in Dublin we had the opportunity to give four talks, one of which was Scaling Solr with SolrCloud. Through it we wanted to share our experiences around scaling Solr, especially as we have experience in running Solr internally and as a team of search consultants. Enjoy the video and/or the slides!
Note: we are looking for engineers passionate about search to join our professional services team. We’re hiring planet-wide!
As you know, at Sematext, we are not only about consulting services, but also about administration, monitoring, and data analysis. Because of that, during last year’s Lucene Revolution conference in Dublin we gave a talk about administration and monitoring of SolrCloud clusters. During the talk, Rafał Kuć discusses some administration procedures for SolrCloud like collection management and schema modifications with the schema API. In addition, he also talks about why monitoring is important and what to pay attention to. Finally, he shows three real life examples of monitoring usefulnesses. Enjoy the video and/or the slides!
Note: we are looking for engineers passionate about search to join our professional services team. We’re hiring planet-wide!